| Param | Original file | Final file |
|---|---|---|
| Filename | modeM0/AS1A12_054T03_9000005516_40072cztM0_level2.fits | modeM0/AS1A12_054T03_9000005516_40072cztM0_level2_quad_clean.evt |
| Size (bytes) | 422,887,680 | 85,072,320 |
| Size | 403.3 MB | 81.1 MB |
| Events in quadrant A | 5,829,303 | 507,874 |
| Events in quadrant B | 2,364,721 | 612,050 |
| Events in quadrant C | 4,005,413 | 563,003 |
| Events in quadrant D | 3,043,112 | 522,912 |
| Mode M9 | |||
|---|---|---|---|
| Quadrant | BADHDUFLAG | Total packets | Discarded packets |
| A | 0 | 23 | 0 |
| B | 0 | 23 | 0 |
| C | 0 | 23 | 0 |
| D | 0 | 24 | 0 |
| Mode SS | |||
|---|---|---|---|
| Quadrant | BADHDUFLAG | Total packets | Discarded packets |
| A | 0 | 106 | 0 |
| B | 0 | 106 | 0 |
| C | 0 | 106 | 0 |
| D | 0 | 106 | 0 |
| Mode M0 | |||
|---|---|---|---|
| Quadrant | BADHDUFLAG | Total packets | Discarded packets |
| A | 0 | 20871 | 2 |
| B | 0 | 10764 | 1 |
| C | 0 | 15436 | 1 |
| D | 0 | 12961 | 1 |
| Quadrant | Total seconds | Saturated seconds | Saturation percentage |
|---|---|---|---|
| A | 5288 | 922 | 17.435703% |
| B | 5288 | 11 | 0.208018% |
| C | 5288 | 224 | 4.236006% |
| D | 5288 | 135 | 2.552950% |
Noise dominated data is calculated using 1-second bins in cleaned event files. If a bin has >2000 counts, and if more than 50% of those come from <1% of pixels, then it is considered to be noise-dominated and hence unusable.
| Quadrant | # 1 sec bins | Bins with >0 counts | Bins with >2000 counts | High rate bins dominated by noise | Noise dominated (total time) | Noise dominated (detector-on time) | Marked lightcurve |
|---|---|---|---|---|---|---|---|
| A | 7260 | 5289 | 811 | 811 | 11.17% | 15.33% | 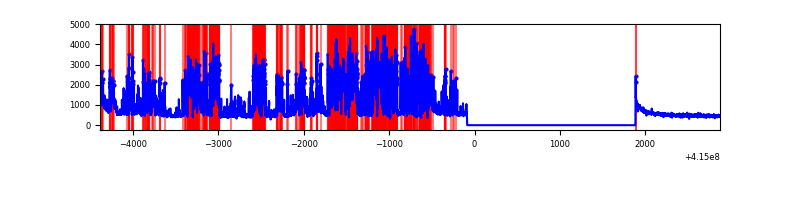 |
| B | 7260 | 5289 | 4 | 4 | 0.06% | 0.08% | 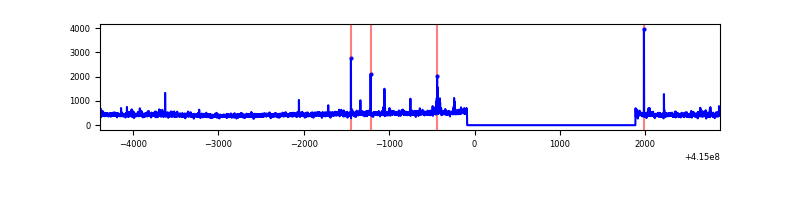 |
| C | 7260 | 5289 | 231 | 231 | 3.18% | 4.37% | 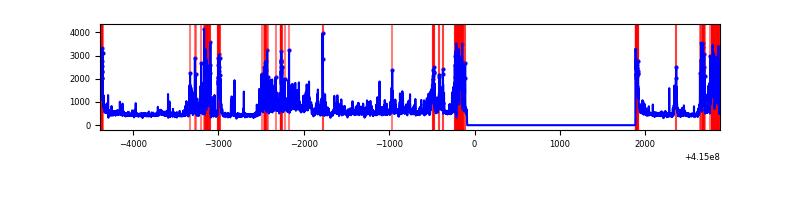 |
| D | 7260 | 5289 | 109 | 109 | 1.50% | 2.06% | 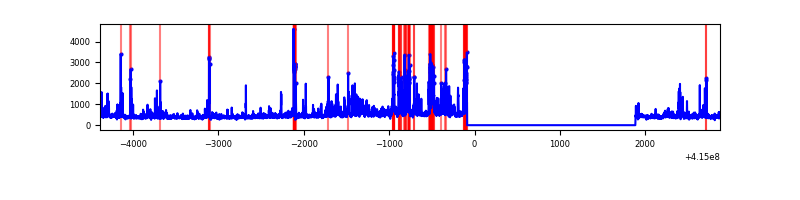 |
Top three noisy pixels from each quadrant. If the there are fewer than three noisy pixels in the level2.evt file, extra rows are filled as -1
| Pixel properties | Quadrant properties | ||||||
|---|---|---|---|---|---|---|---|
| Quadrant | DetID | PixID | Counts | Sigma | Mean | Median | Sigma |
| A | 2 | 79 | 3251123 | 29816.11 | 537 | 528 | 109.0 |
| A | 10 | 83 | 451491 | 4136.46 | 537 | 528 | 109.0 |
| A | 15 | 223 | 29491 | 265.66 | 537 | 528 | 109.0 |
| B | 4 | 171 | 51775 | 455.86 | 573 | 556 | 112.4 |
| B | 0 | 230 | 34387 | 301.1 | 573 | 556 | 112.4 |
| B | 0 | 190 | 14298 | 122.31 | 573 | 556 | 112.4 |
| C | 9 | 187 | 1328934 | 10466.3 | 552 | 556 | 126.9 |
| C | 15 | 214 | 218839 | 1719.85 | 552 | 556 | 126.9 |
| C | 3 | 233 | 125316 | 982.98 | 552 | 556 | 126.9 |
| D | 2 | 249 | 375059 | 2746.3 | 553 | 537 | 136.4 |
| D | 12 | 227 | 152386 | 1113.48 | 553 | 537 | 136.4 |
| D | 2 | 250 | 141357 | 1032.61 | 553 | 537 | 136.4 |
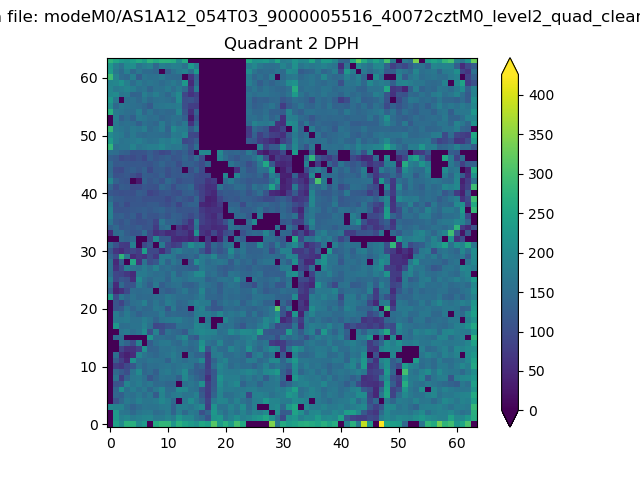
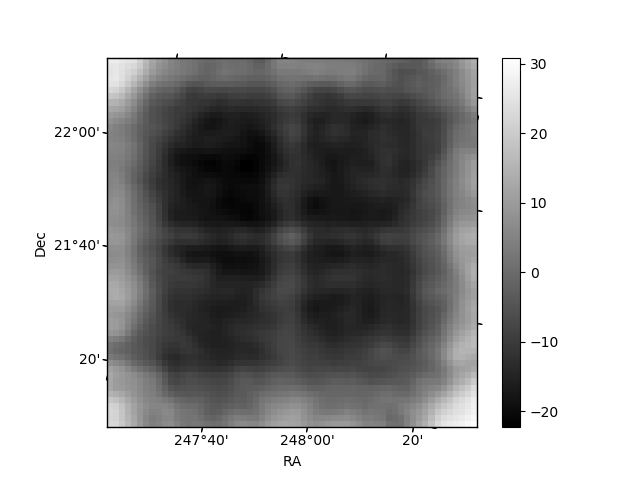
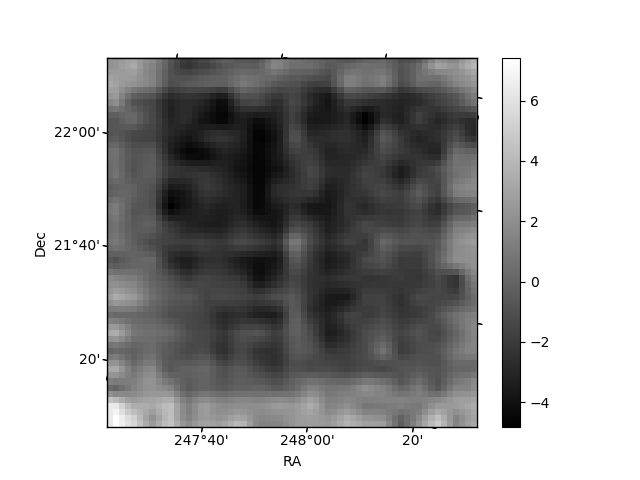
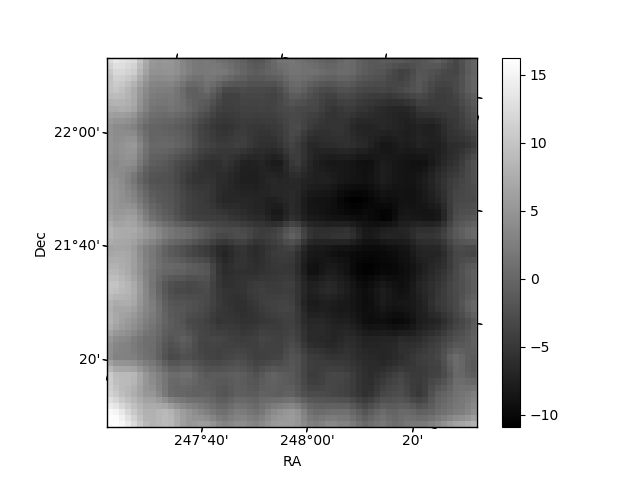
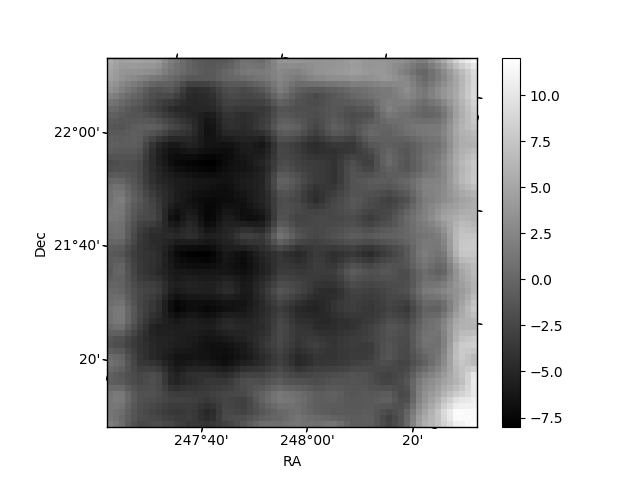
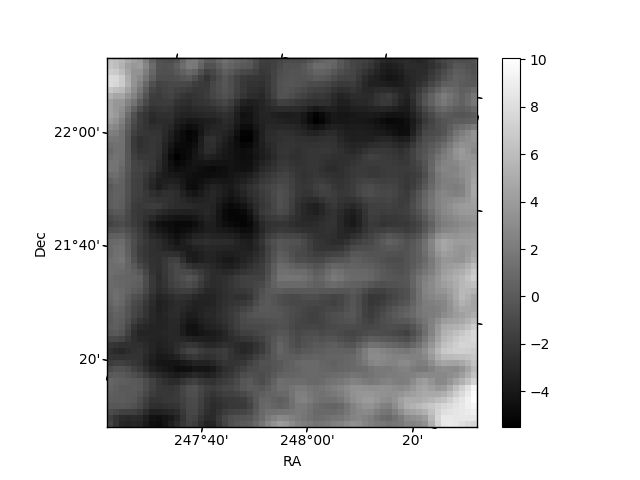
Histogram calculated using DETX and DETY for each event in the final _common_clean file
| Quadrant A | 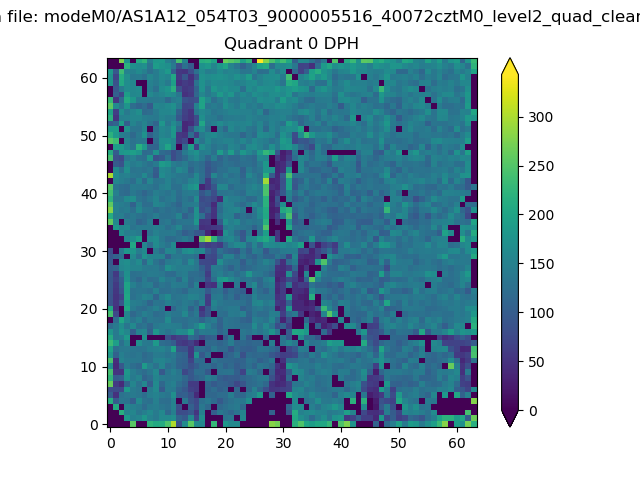 |
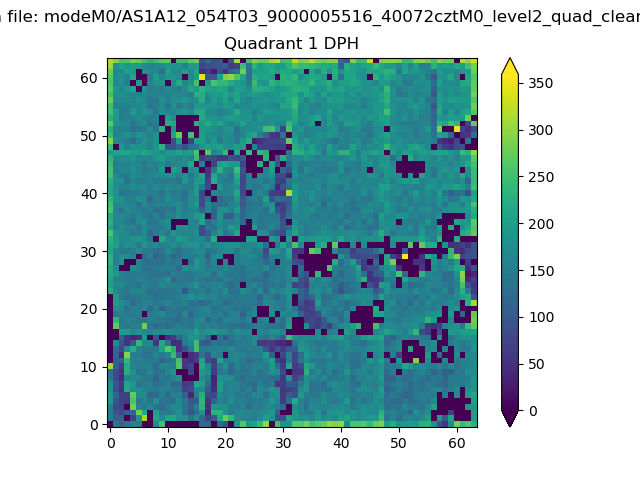 |
Quadrant B |
|---|---|---|---|
| Quadrant D | 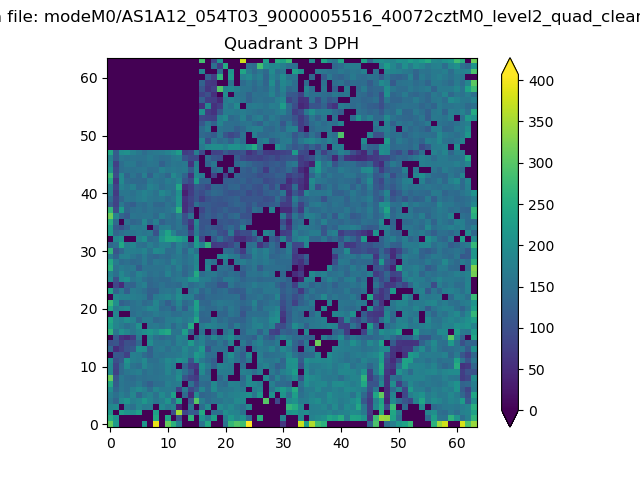 |
 |
Quadrant C |
| Plot type | Count rate plots | Images |
|---|---|---|
| Comparison with Poisson distribution Blue bars denote a histogram of data divided into 1 sec bins. Red curve is a Poisson curve with rate = median count rate of data. |
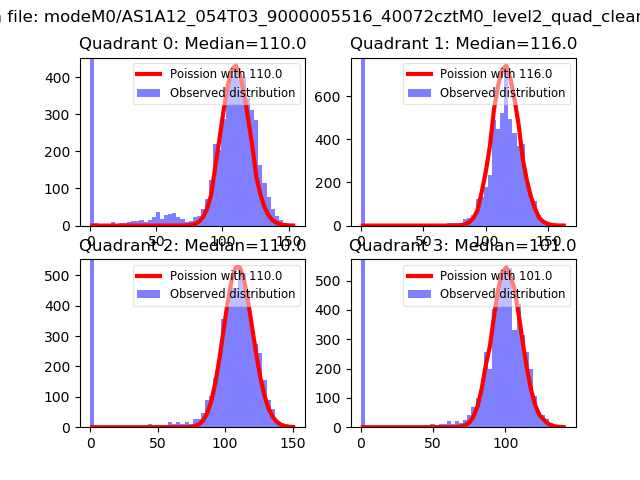 |
 |
| Quadrant-wise count rates Data is divided into 100 sec bins |
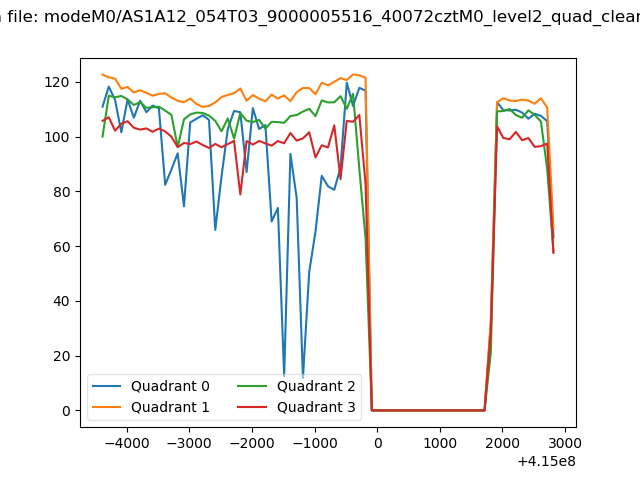 |
|
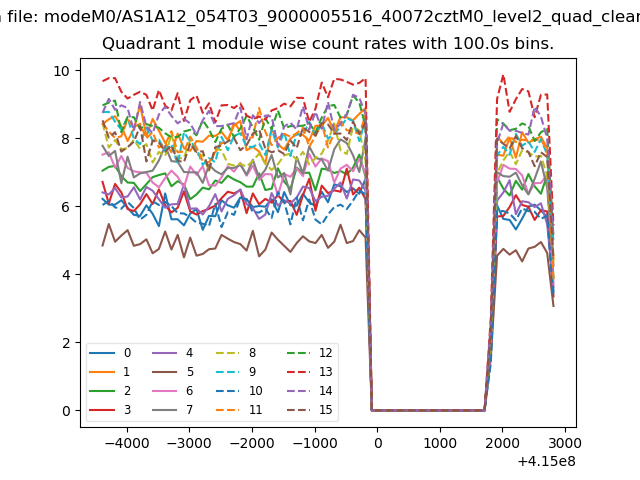
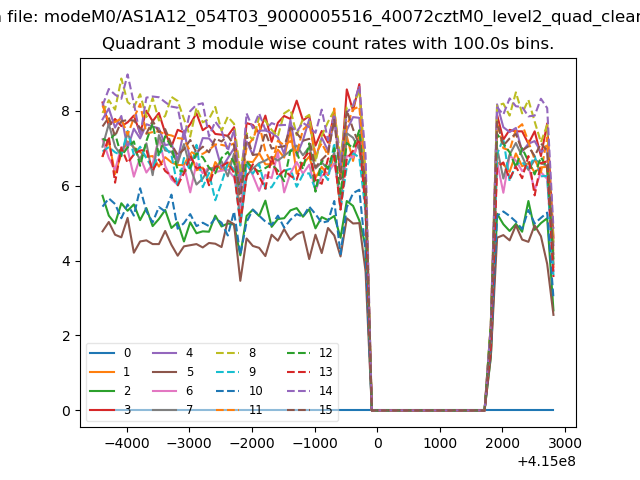
| Module-wise count rates for Quadrant A Data is divided into 100 sec bins |
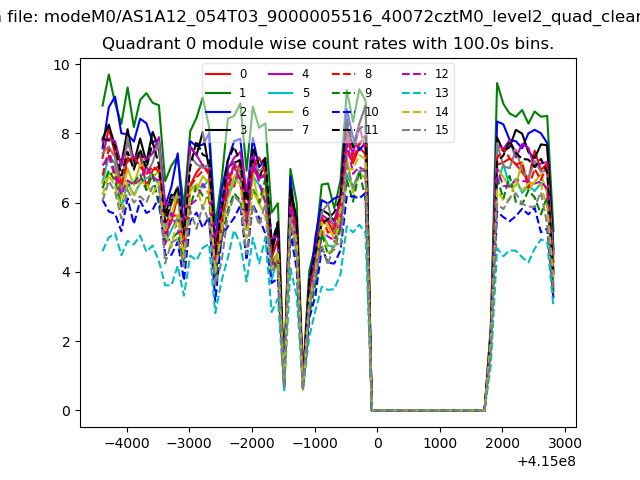 |
 |
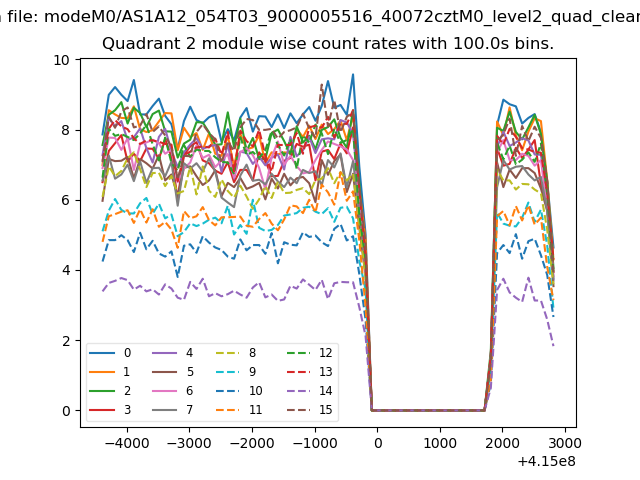
| Module-wise count rates for Quadrant B Data is divided into 100 sec bins |
 |
 |
| Module-wise count rates for Quadrant C Data is divided into 100 sec bins |
 |
 |
| Module-wise count rates for Quadrant D Data is divided into 100 sec bins |
 |
 |
| Parameter | Plot |
|---|---|
| CZT HV Monitor | 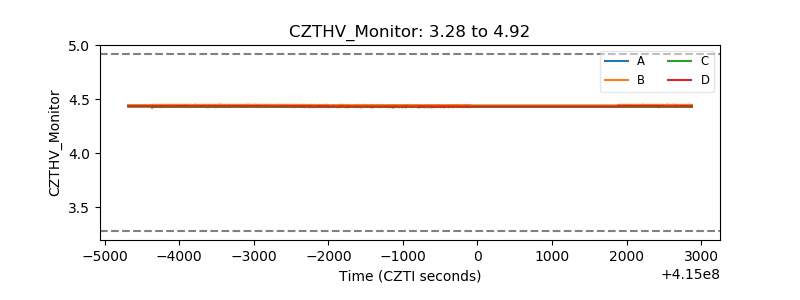 |
| D_VDD | 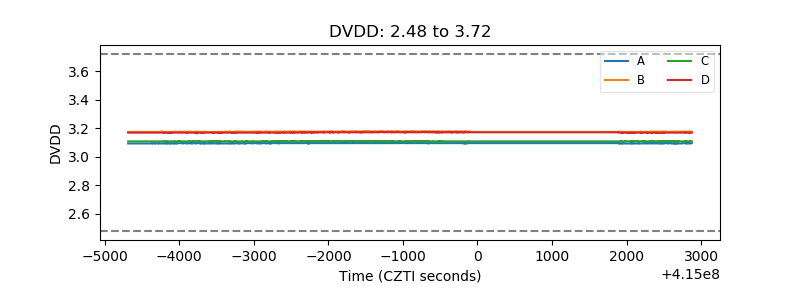 |
| Temperature 1 | 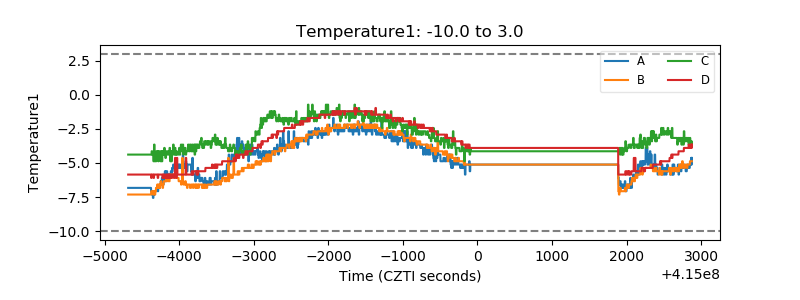 |
| Veto HV Monitor | 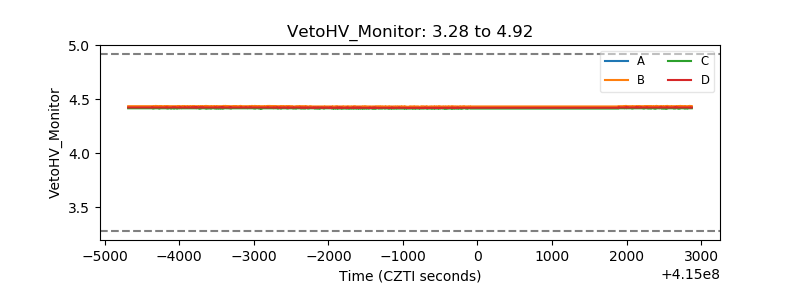 |
| Veto LLD | 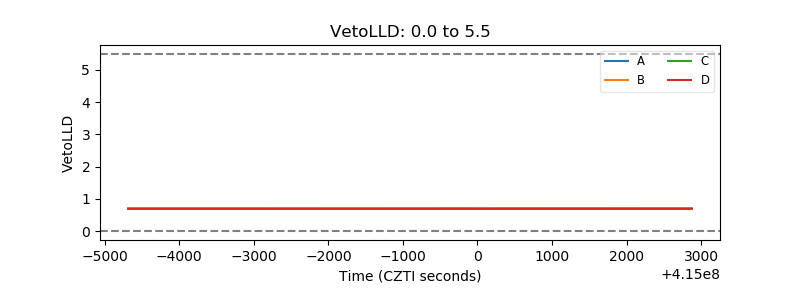 |
| Alpha Counter | 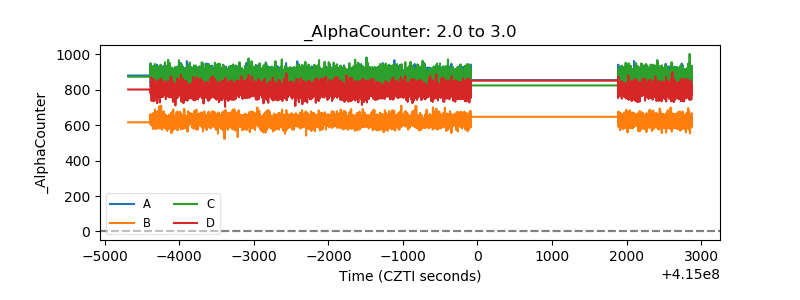 |
| _CPM_Rate | 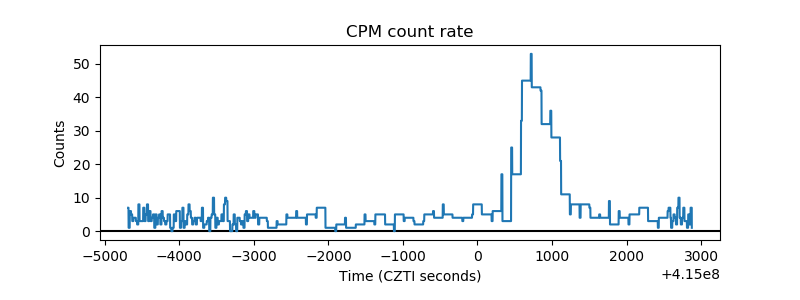 |
| CZT Counter | 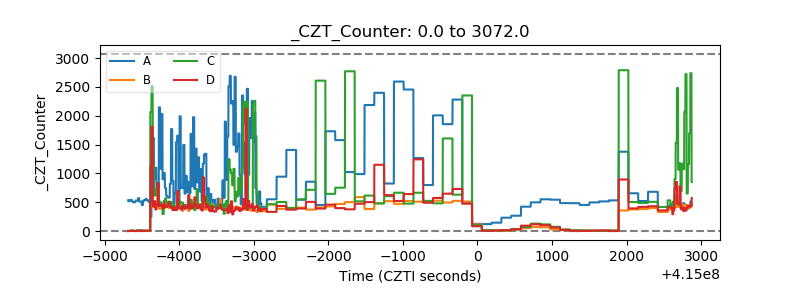 |
| +2.5 Volts monitor | 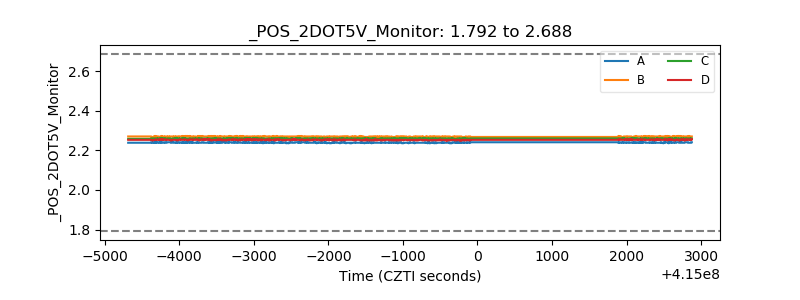 |
| +5 Volts monitor | 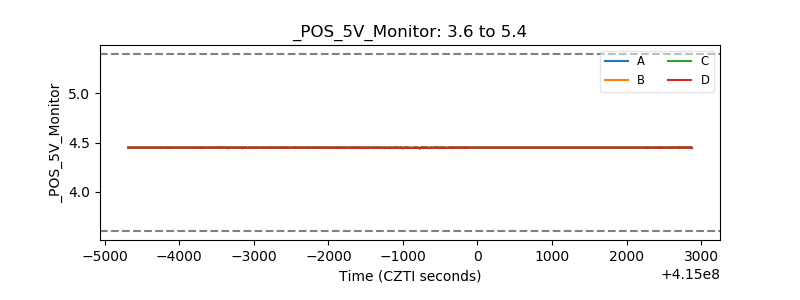 |
| _ROLL_ROT | 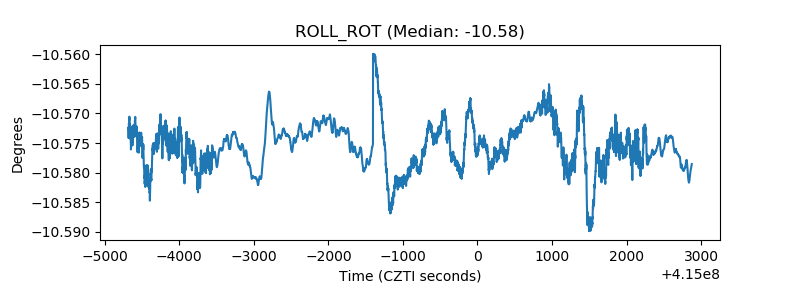 |
| _Roll_DEC | 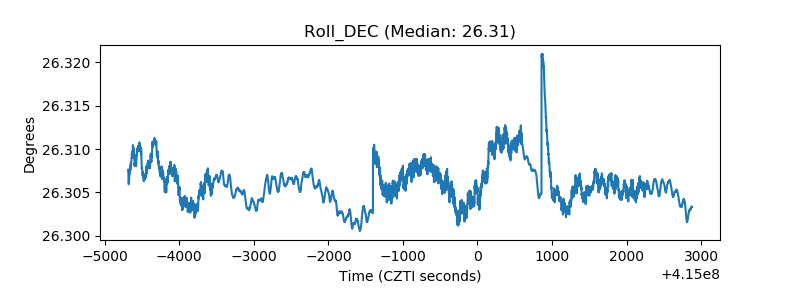 |
| _Roll_RA | 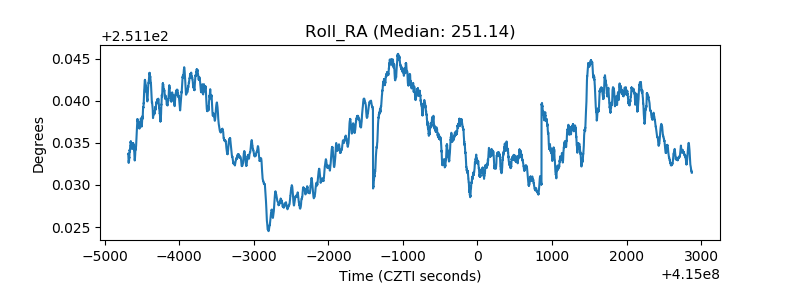 |
| Veto Counter | 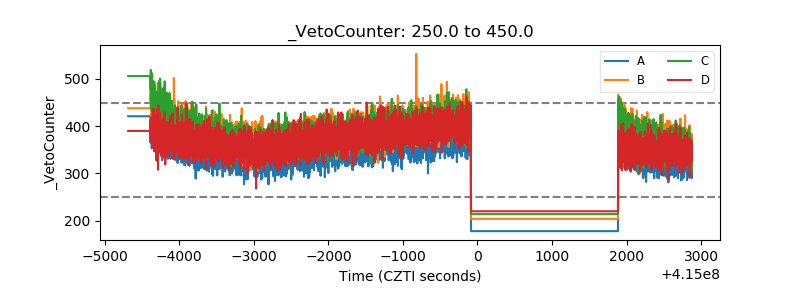 |