| Param | Original file | Final file |
|---|---|---|
| Filename | modeM0/AS1A12_054T03_9000005516_40073cztM0_level2.fits | modeM0/AS1A12_054T03_9000005516_40073cztM0_level2_quad_clean.evt |
| Size (bytes) | 337,109,760 | 73,347,840 |
| Size | 321.5 MB | 69.9 MB |
| Events in quadrant A | 2,280,136 | 497,787 |
| Events in quadrant B | 2,097,480 | 515,574 |
| Events in quadrant C | 4,905,026 | 445,061 |
| Events in quadrant D | 2,842,775 | 443,374 |
| Mode M9 | |||
|---|---|---|---|
| Quadrant | BADHDUFLAG | Total packets | Discarded packets |
| A | 0 | 4 | 0 |
| B | 0 | 4 | 0 |
| C | 0 | 4 | 0 |
| D | 0 | 5 | 0 |
| Mode SS | |||
|---|---|---|---|
| Quadrant | BADHDUFLAG | Total packets | Discarded packets |
| A | 0 | 92 | 0 |
| B | 0 | 92 | 0 |
| C | 0 | 92 | 0 |
| D | 0 | 92 | 0 |
| Mode M0 | |||
|---|---|---|---|
| Quadrant | BADHDUFLAG | Total packets | Discarded packets |
| A | 0 | 9442 | 1 |
| B | 0 | 9330 | 1 |
| C | 0 | 17678 | 1 |
| D | 0 | 11699 | 1 |
| Quadrant | Total seconds | Saturated seconds | Saturation percentage |
|---|---|---|---|
| A | 4535 | 6 | 0.132304% |
| B | 4535 | 12 | 0.264609% |
| C | 4535 | 593 | 13.076075% |
| D | 4535 | 101 | 2.227122% |
Noise dominated data is calculated using 1-second bins in cleaned event files. If a bin has >2000 counts, and if more than 50% of those come from <1% of pixels, then it is considered to be noise-dominated and hence unusable.
| Quadrant | # 1 sec bins | Bins with >0 counts | Bins with >2000 counts | High rate bins dominated by noise | Noise dominated (total time) | Noise dominated (detector-on time) | Marked lightcurve |
|---|---|---|---|---|---|---|---|
| A | 4535 | 4535 | 5 | 5 | 0.11% | 0.11% | 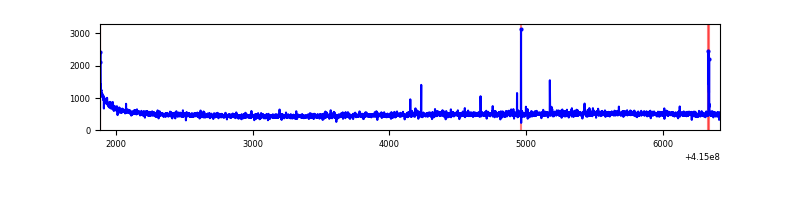 |
| B | 4535 | 4535 | 2 | 2 | 0.04% | 0.04% | 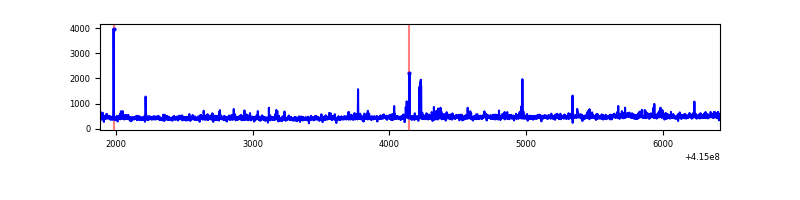 |
| C | 4535 | 4535 | 536 | 536 | 11.82% | 11.82% | 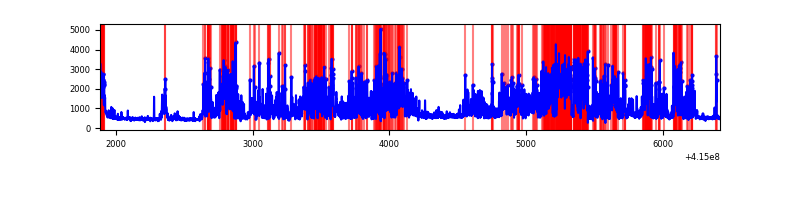 |
| D | 4535 | 4535 | 75 | 75 | 1.65% | 1.65% | 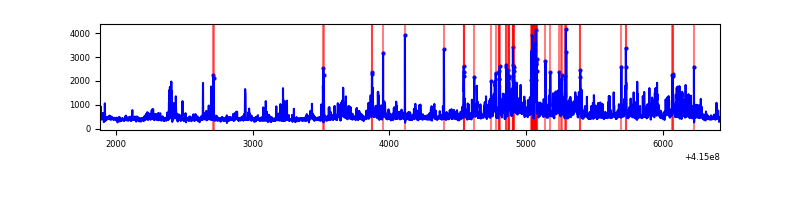 |
Top three noisy pixels from each quadrant. If the there are fewer than three noisy pixels in the level2.evt file, extra rows are filled as -1
| Pixel properties | Quadrant properties | ||||||
|---|---|---|---|---|---|---|---|
| Quadrant | DetID | PixID | Counts | Sigma | Mean | Median | Sigma |
| A | 10 | 83 | 333251 | 3271.19 | 496 | 486 | 101.7 |
| A | 9 | 143 | 11743 | 110.66 | 496 | 486 | 101.7 |
| A | 2 | 79 | 9921 | 92.75 | 496 | 486 | 101.7 |
| B | 4 | 171 | 89941 | 919.1 | 493 | 480 | 97.3 |
| B | 0 | 230 | 36981 | 375.0 | 493 | 480 | 97.3 |
| B | 0 | 190 | 16611 | 165.73 | 493 | 480 | 97.3 |
| C | 9 | 187 | 2735618 | 24904.59 | 465 | 468 | 109.8 |
| C | 15 | 214 | 178628 | 1622.22 | 465 | 468 | 109.8 |
| C | 3 | 233 | 79911 | 723.36 | 465 | 468 | 109.8 |
| D | 12 | 227 | 278854 | 2350.48 | 481 | 466 | 118.4 |
| D | 2 | 250 | 243726 | 2053.88 | 481 | 466 | 118.4 |
| D | 9 | 19 | 136668 | 1149.97 | 481 | 466 | 118.4 |
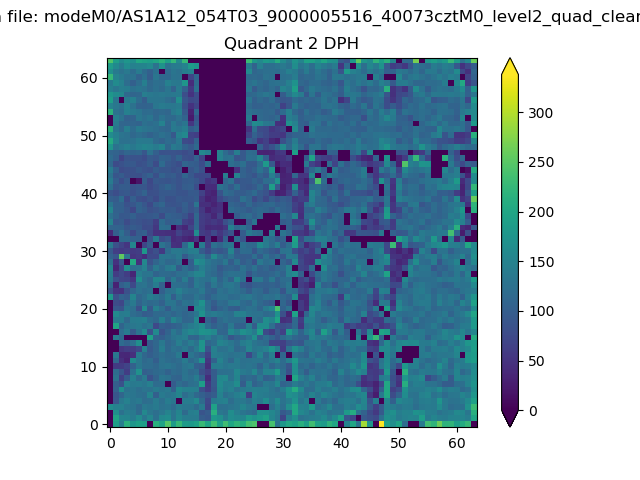
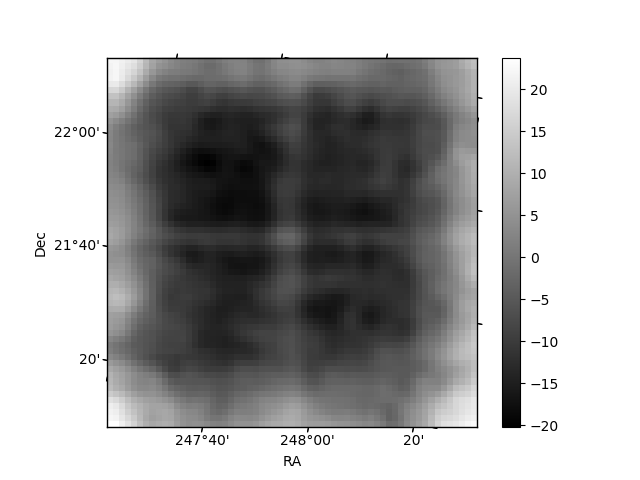
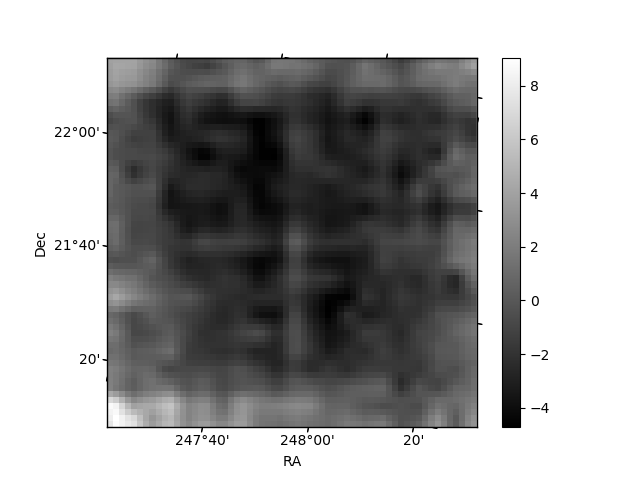
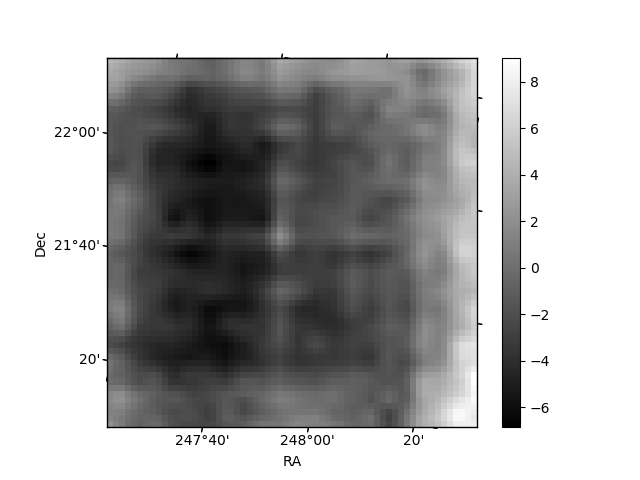
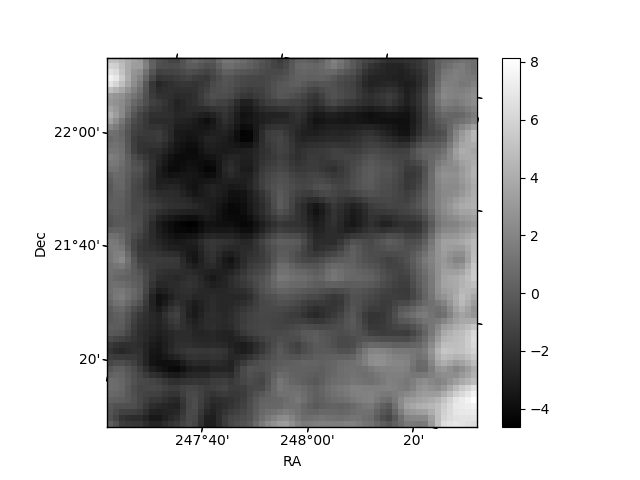
Histogram calculated using DETX and DETY for each event in the final _common_clean file
| Quadrant A | 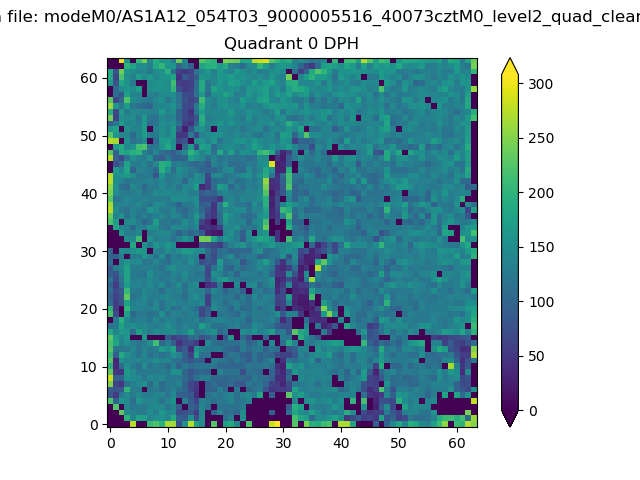 |
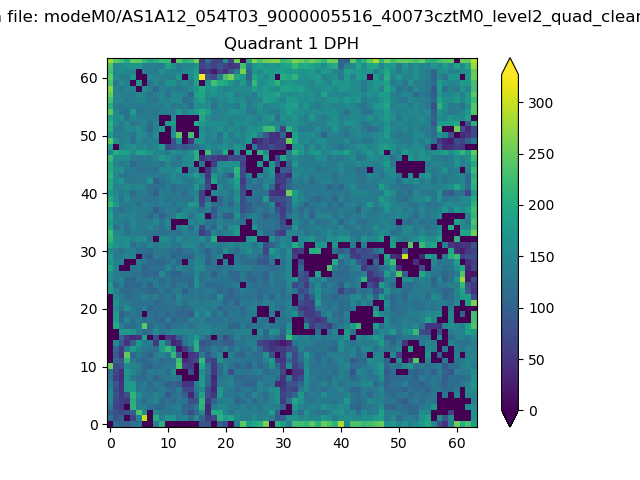 |
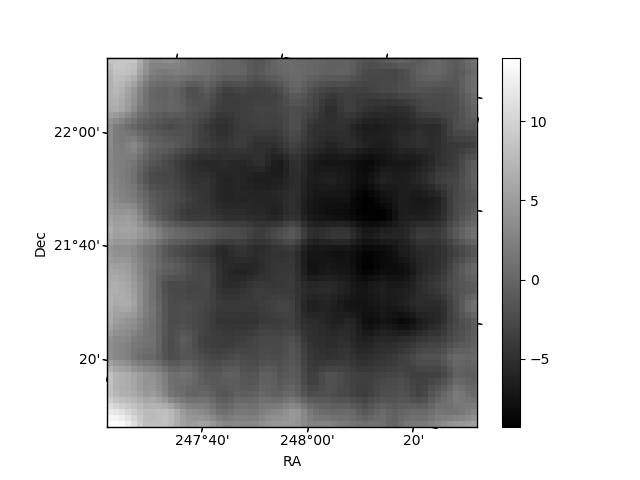
Quadrant B |
|---|---|---|---|
| Quadrant D | 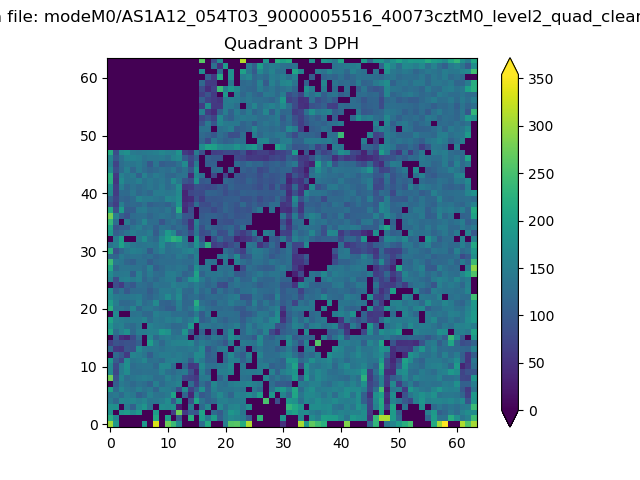 |
 |
Quadrant C |
| Plot type | Count rate plots | Images |
|---|---|---|
| Comparison with Poisson distribution Blue bars denote a histogram of data divided into 1 sec bins. Red curve is a Poisson curve with rate = median count rate of data. |
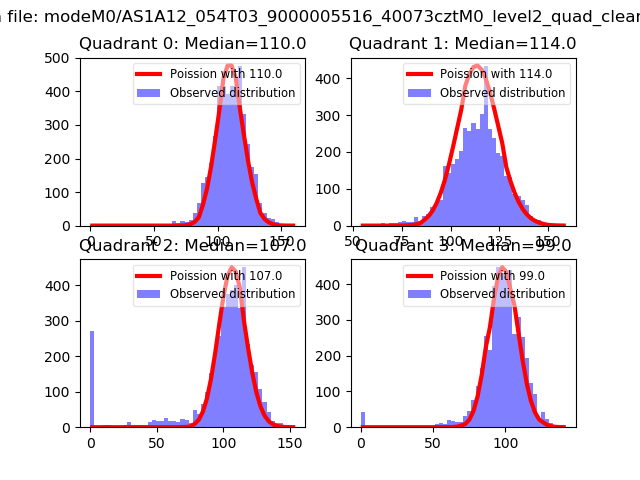 |
 |
| Quadrant-wise count rates Data is divided into 100 sec bins |
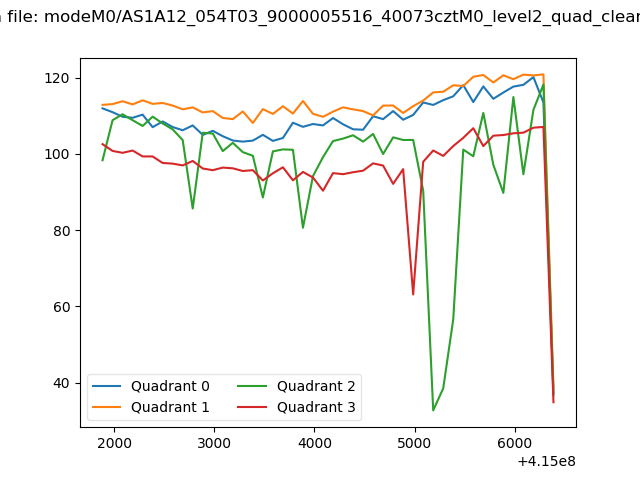 |
|
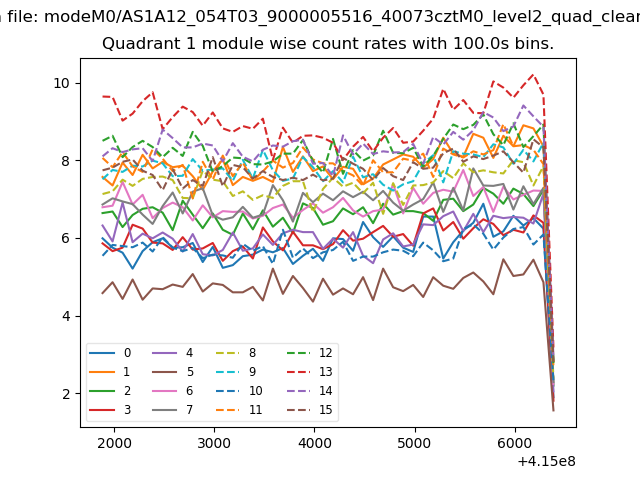
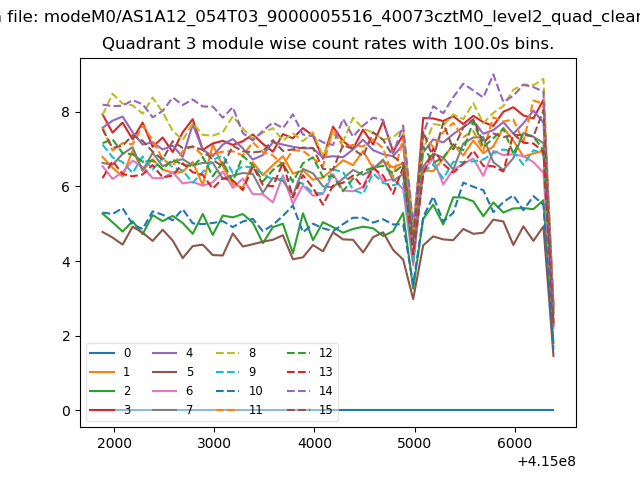
| Module-wise count rates for Quadrant A Data is divided into 100 sec bins |
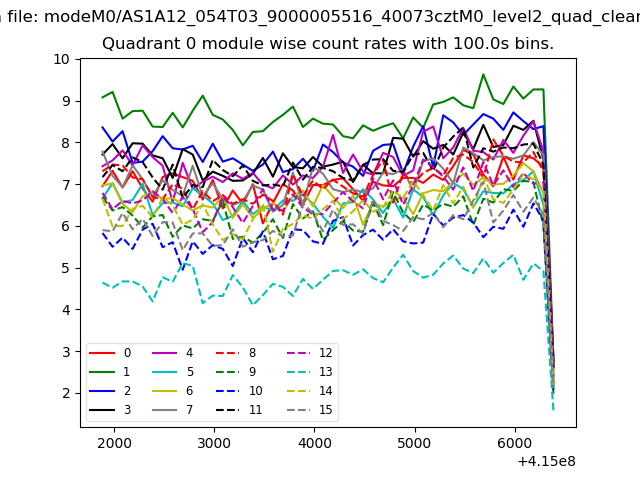 |
 |
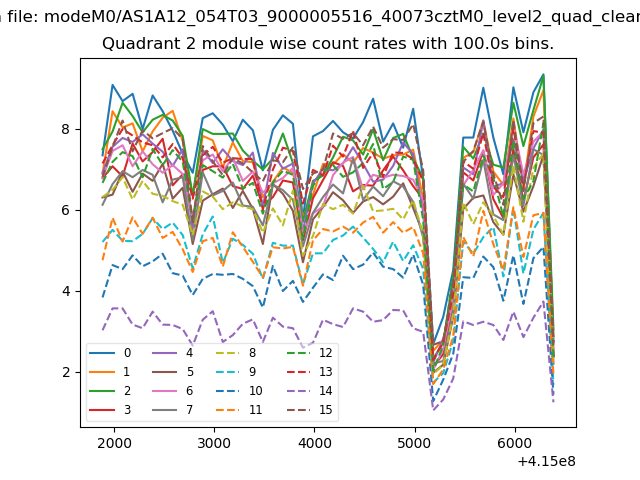
| Module-wise count rates for Quadrant B Data is divided into 100 sec bins |
 |
 |
| Module-wise count rates for Quadrant C Data is divided into 100 sec bins |
 |
 |
| Module-wise count rates for Quadrant D Data is divided into 100 sec bins |
 |
 |
| Parameter | Plot |
|---|---|
| CZT HV Monitor | 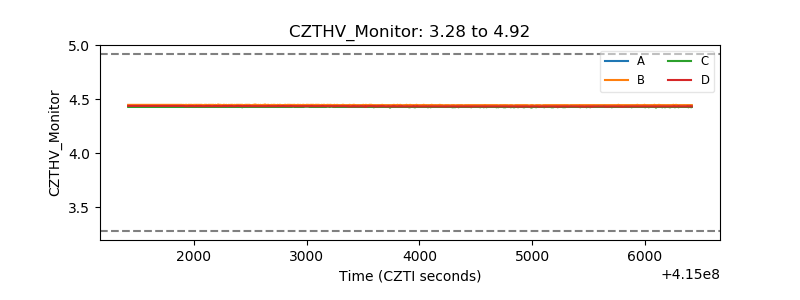 |
| D_VDD | 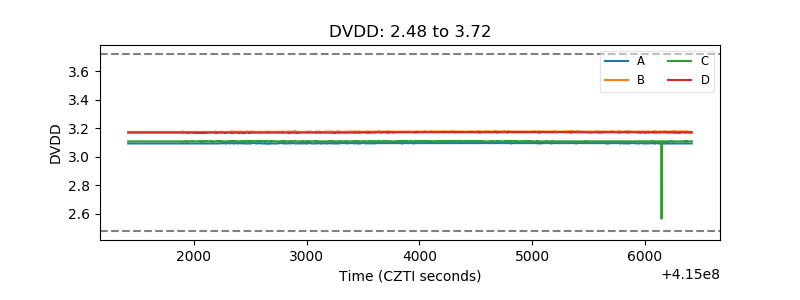 |
| Temperature 1 | 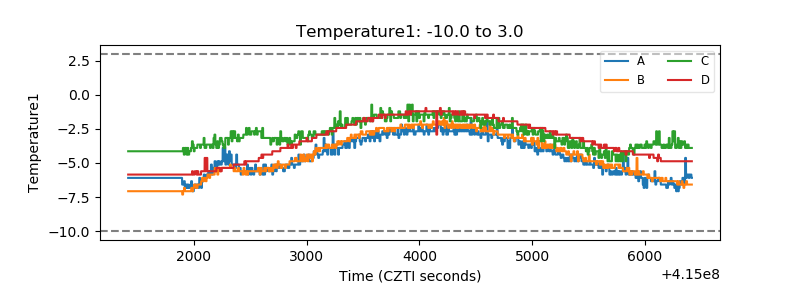 |
| Veto HV Monitor | 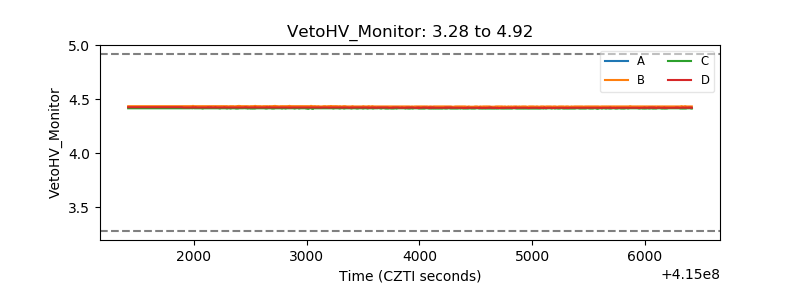 |
| Veto LLD | 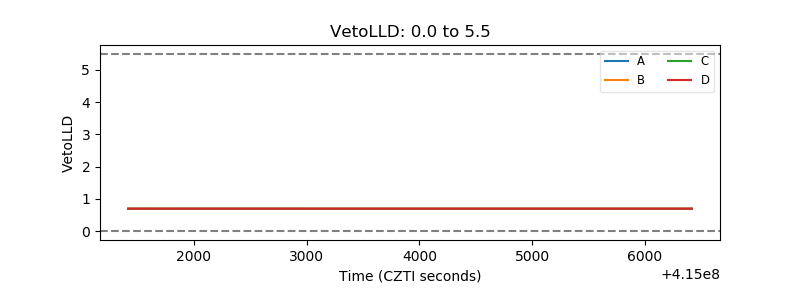 |
| Alpha Counter | 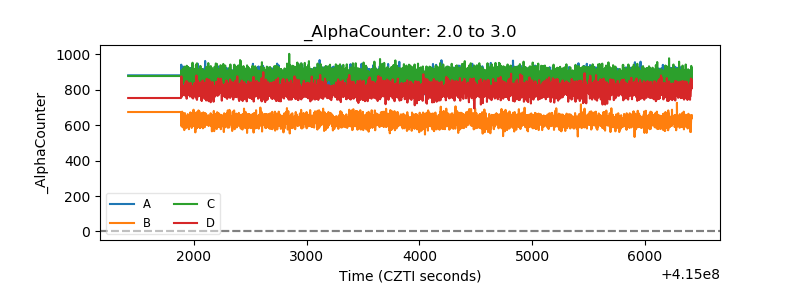 |
| _CPM_Rate | 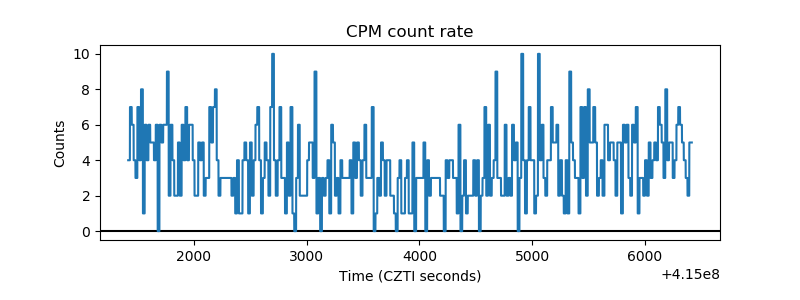 |
| CZT Counter | 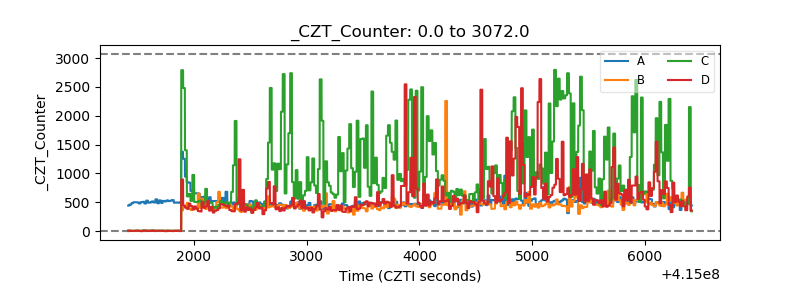 |
| +2.5 Volts monitor | 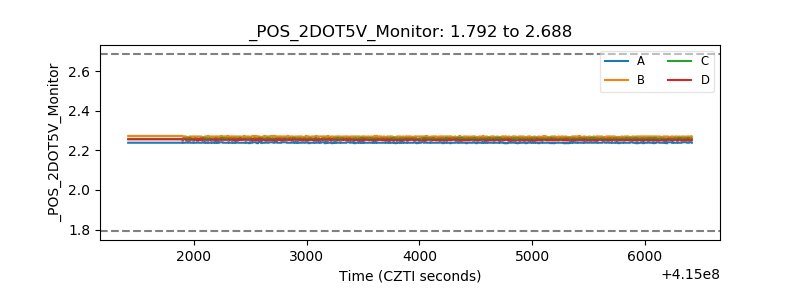 |
| +5 Volts monitor | 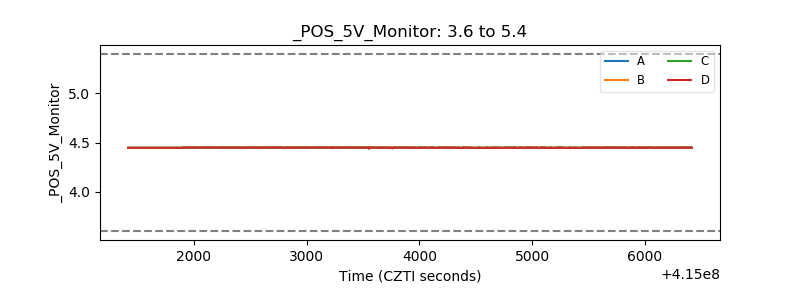 |
| _ROLL_ROT | 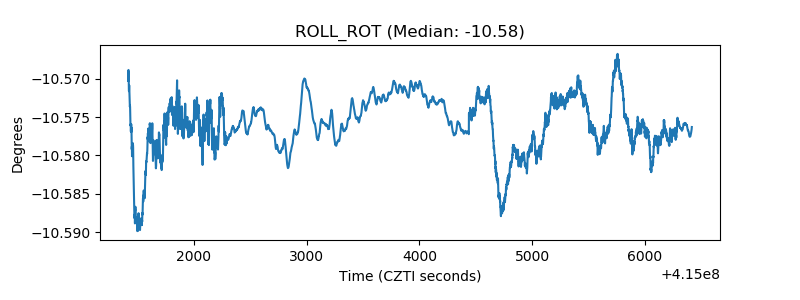 |
| _Roll_DEC | 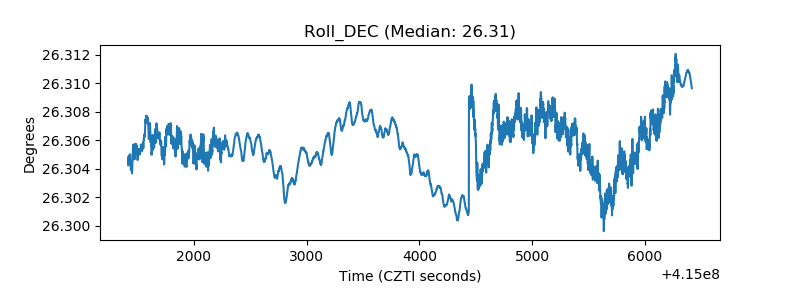 |
| _Roll_RA | 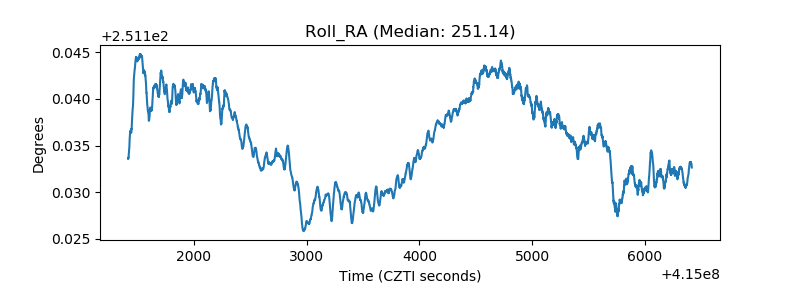 |
| Veto Counter | 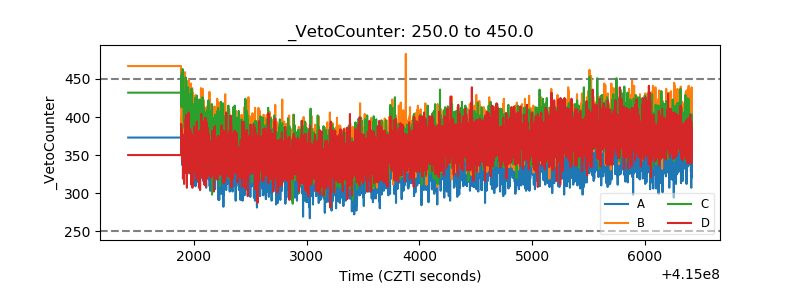 |