| Param | Original file | Final file |
|---|---|---|
| Filename | modeM0/AS1T05_086T01_9000005518_40073cztM0_level2.fits | modeM0/AS1T05_086T01_9000005518_40073cztM0_level2_quad_clean.evt |
| Size (bytes) | 62,098,560 | 15,468,480 |
| Size | 59.2 MB | 14.8 MB |
| Events in quadrant A | 518,774 | 101,987 |
| Events in quadrant B | 445,621 | 107,142 |
| Events in quadrant C | 824,504 | 98,961 |
| Events in quadrant D | 439,802 | 93,744 |
| Mode SS | |||
|---|---|---|---|
| Quadrant | BADHDUFLAG | Total packets | Discarded packets |
| A | 0 | 16 | 0 |
| B | 0 | 16 | 0 |
| C | 0 | 16 | 0 |
| D | 0 | 16 | 0 |
| Mode M0 | |||
|---|---|---|---|
| Quadrant | BADHDUFLAG | Total packets | Discarded packets |
| A | 0 | 2069 | 2 |
| B | 0 | 1881 | 1 |
| C | 0 | 3021 | 1 |
| D | 0 | 1884 | 1 |
| Mode M9 | |||
|---|---|---|---|
| Quadrant | BADHDUFLAG | Total packets | Discarded packets |
| A | 0 | 6 | 0 |
| B | 0 | 6 | 0 |
| C | 0 | 6 | 0 |
| D | 0 | 6 | 0 |
| Quadrant | Total seconds | Saturated seconds | Saturation percentage |
|---|---|---|---|
| A | 858 | 5 | 0.582751% |
| B | 858 | 3 | 0.349650% |
| C | 858 | 63 | 7.342657% |
| D | 858 | 4 | 0.466200% |
Noise dominated data is calculated using 1-second bins in cleaned event files. If a bin has >2000 counts, and if more than 50% of those come from <1% of pixels, then it is considered to be noise-dominated and hence unusable.
| Quadrant | # 1 sec bins | Bins with >0 counts | Bins with >2000 counts | High rate bins dominated by noise | Noise dominated (total time) | Noise dominated (detector-on time) | Marked lightcurve |
|---|---|---|---|---|---|---|---|
| A | 858 | 858 | 2 | 2 | 0.23% | 0.23% | 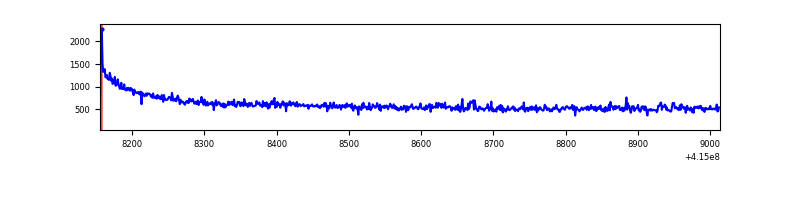 |
| B | 858 | 858 | 1 | 1 | 0.12% | 0.12% | 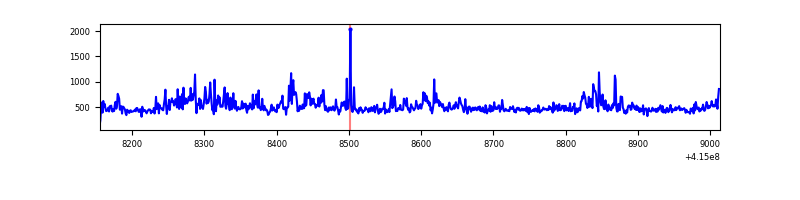 |
| C | 858 | 858 | 63 | 63 | 7.34% | 7.34% | 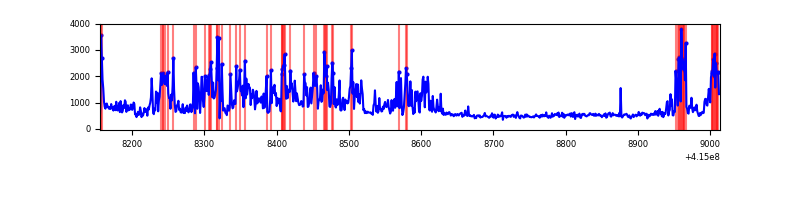 |
| D | 858 | 858 | 4 | 4 | 0.47% | 0.47% | 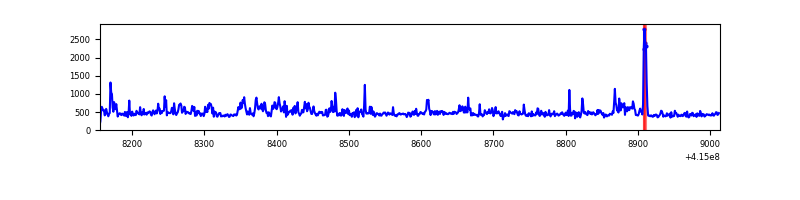 |
Top three noisy pixels from each quadrant. If the there are fewer than three noisy pixels in the level2.evt file, extra rows are filled as -1
| Pixel properties | Quadrant properties | ||||||
|---|---|---|---|---|---|---|---|
| Quadrant | DetID | PixID | Counts | Sigma | Mean | Median | Sigma |
| A | 10 | 83 | 132408 | 5962.71 | 98 | 96 | 22.2 |
| A | 2 | 79 | 5017 | 221.77 | 98 | 96 | 22.2 |
| A | 10 | 67 | 1875 | 80.17 | 98 | 96 | 22.2 |
| B | 4 | 171 | 41006 | 1917.83 | 97 | 95 | 21.3 |
| B | 10 | 246 | 20011 | 933.62 | 97 | 95 | 21.3 |
| B | 12 | 111 | 2372 | 106.74 | 97 | 95 | 21.3 |
| C | 9 | 187 | 401888 | 16691.64 | 93 | 93 | 24.1 |
| C | 15 | 214 | 40057 | 1660.21 | 93 | 93 | 24.1 |
| C | 0 | 10 | 15126 | 624.51 | 93 | 93 | 24.1 |
| D | 12 | 227 | 71281 | 2778.33 | 94 | 90 | 25.6 |
| D | 3 | 238 | 3890 | 148.3 | 94 | 90 | 25.6 |
| D | 2 | 234 | 2981 | 112.83 | 94 | 90 | 25.6 |
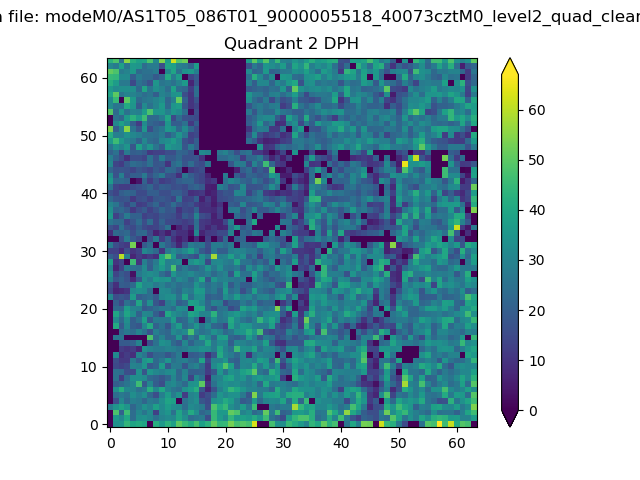
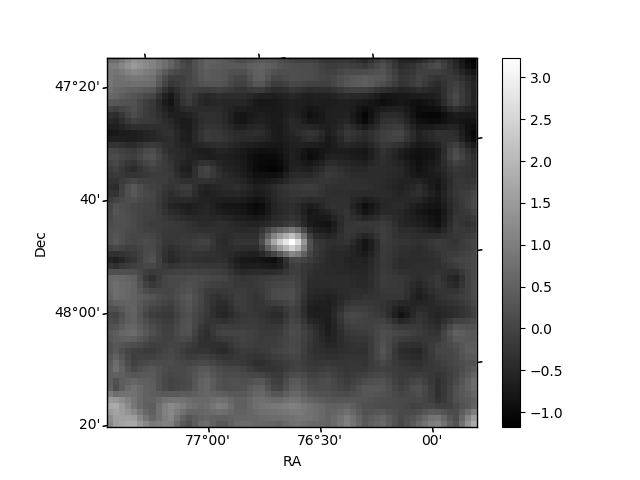
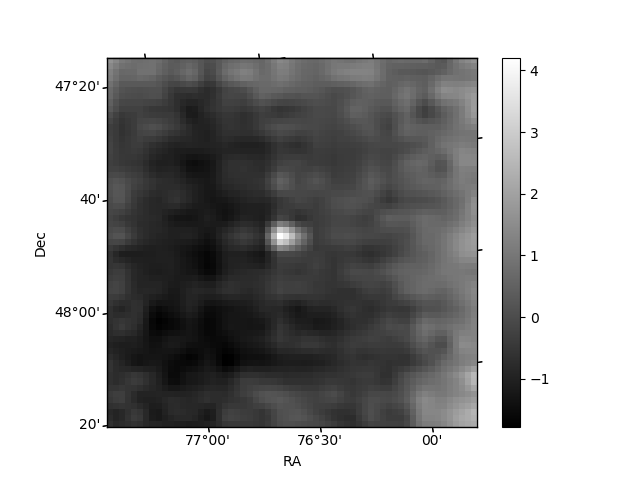
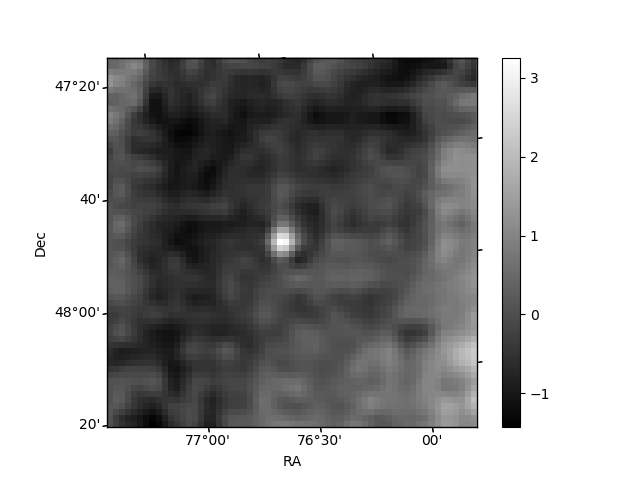
Histogram calculated using DETX and DETY for each event in the final _common_clean file
| Quadrant A | 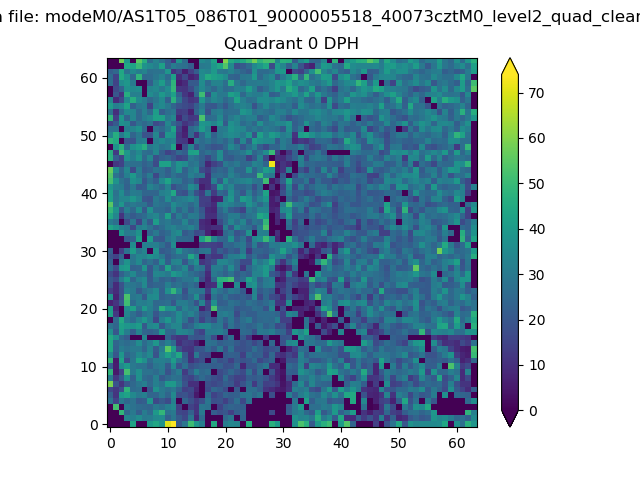 |
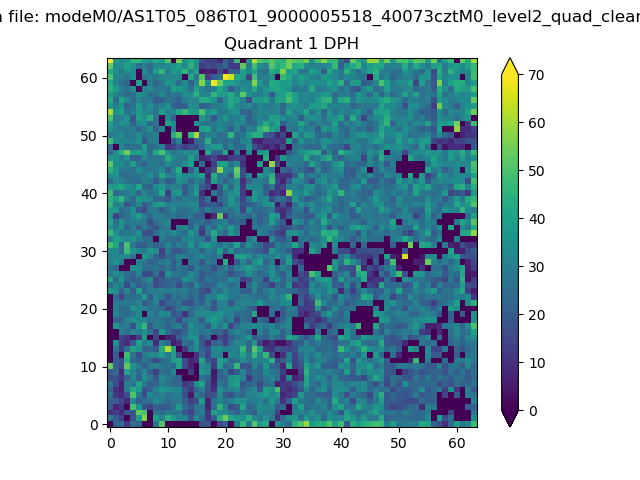 |
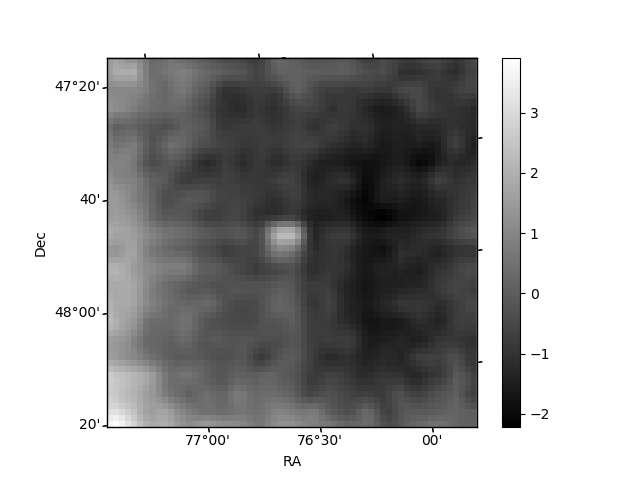
Quadrant B |
|---|---|---|---|
| Quadrant D | 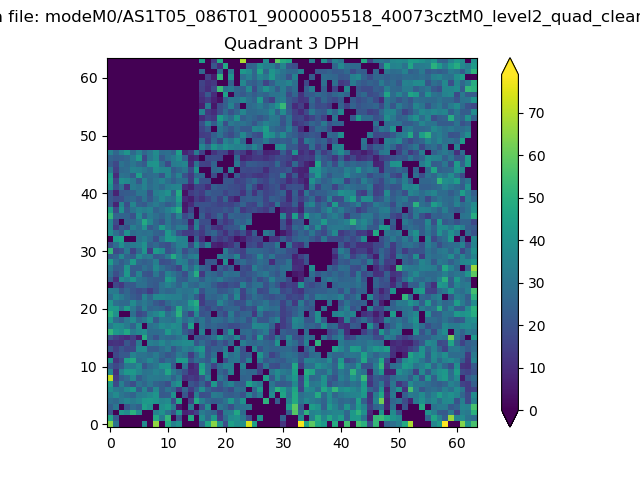 |
 |
Quadrant C |
| Plot type | Count rate plots | Images |
|---|---|---|
| Comparison with Poisson distribution Blue bars denote a histogram of data divided into 1 sec bins. Red curve is a Poisson curve with rate = median count rate of data. |
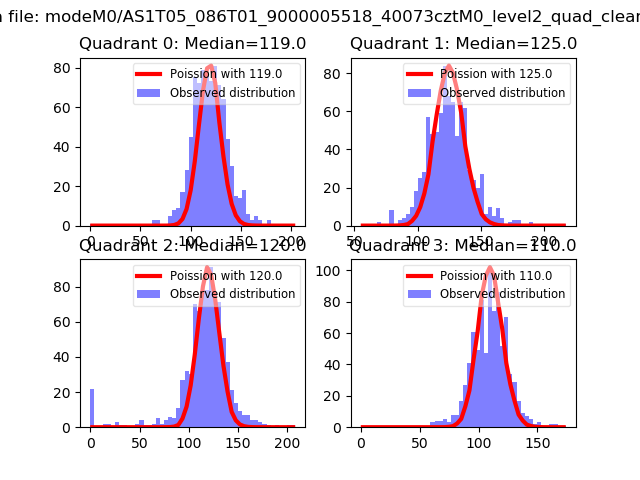 |
 |
| Quadrant-wise count rates Data is divided into 100 sec bins |
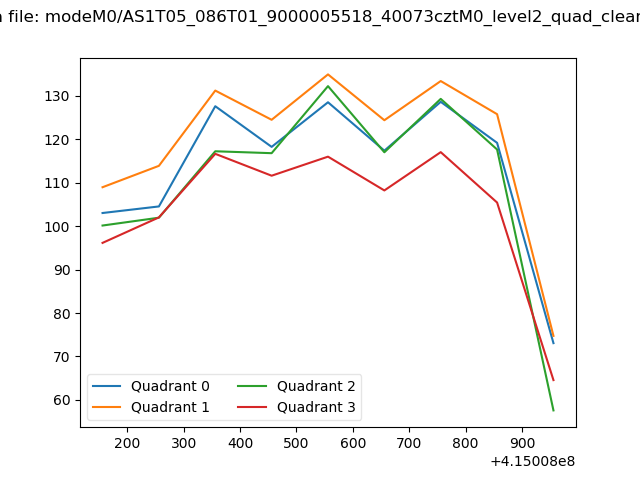 |
|
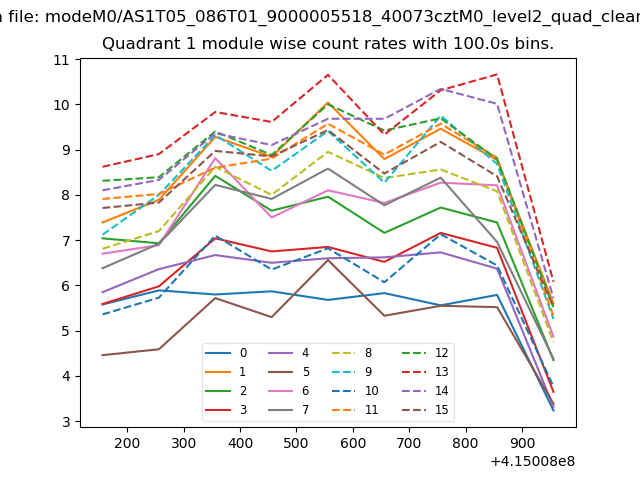
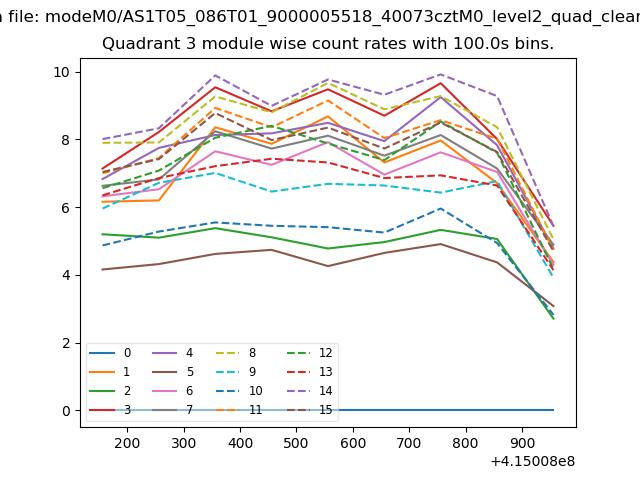
| Module-wise count rates for Quadrant A Data is divided into 100 sec bins |
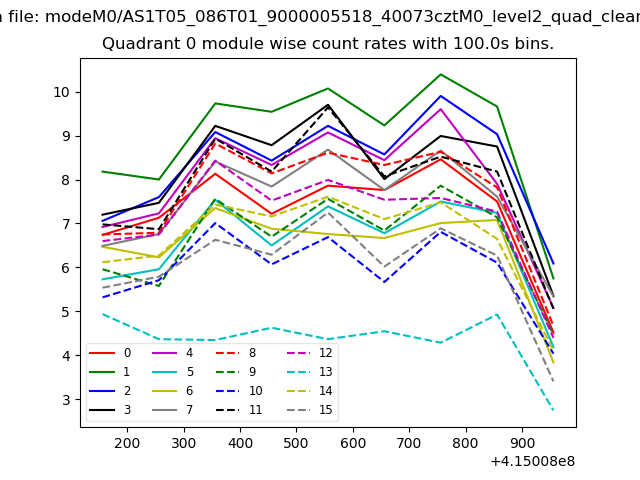 |
 |
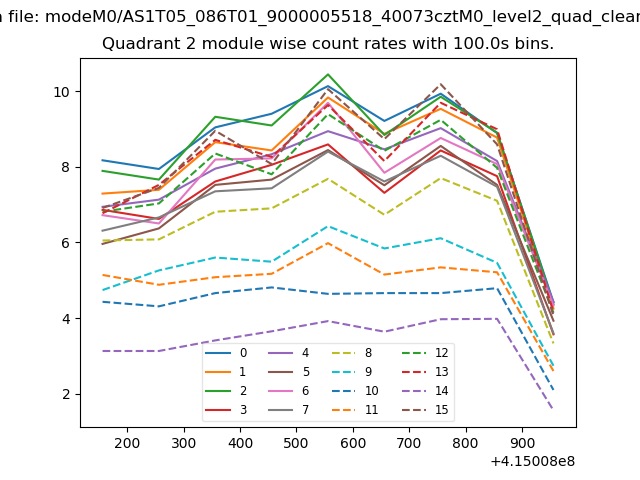
| Module-wise count rates for Quadrant B Data is divided into 100 sec bins |
 |
 |
| Module-wise count rates for Quadrant C Data is divided into 100 sec bins |
 |
 |
| Module-wise count rates for Quadrant D Data is divided into 100 sec bins |
 |
 |
| Parameter | Plot |
|---|---|
| CZT HV Monitor | 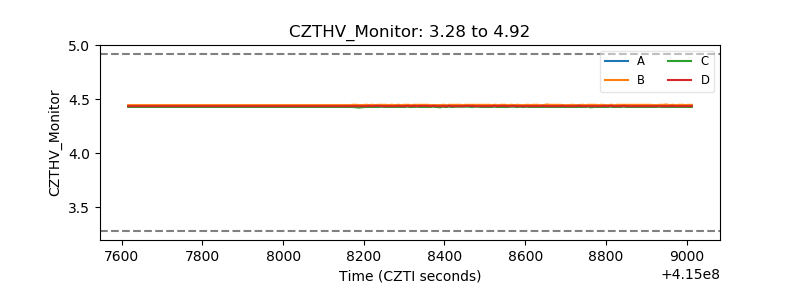 |
| D_VDD | 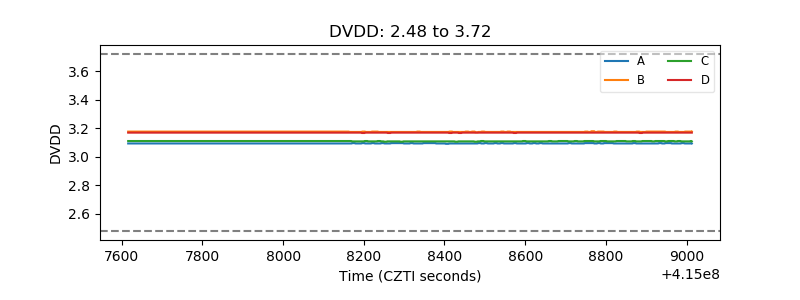 |
| Temperature 1 | 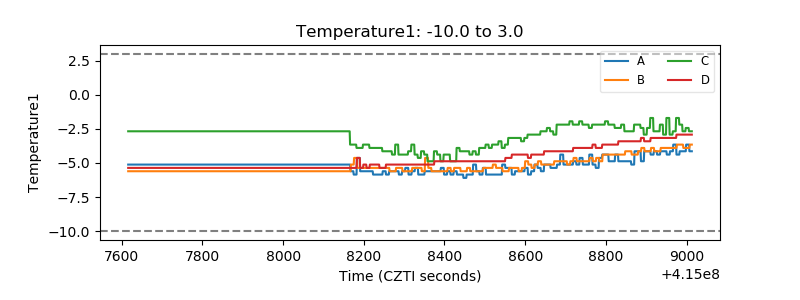 |
| Veto HV Monitor | 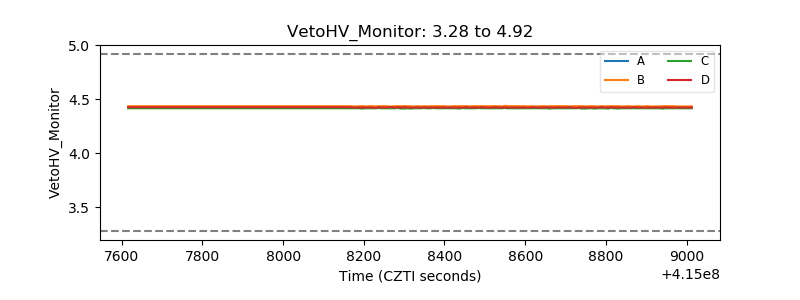 |
| Veto LLD | 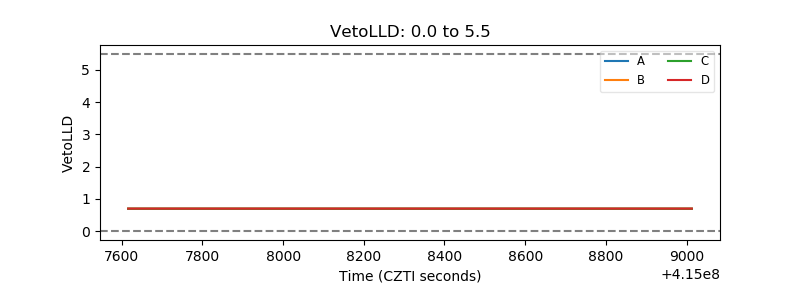 |
| Alpha Counter | 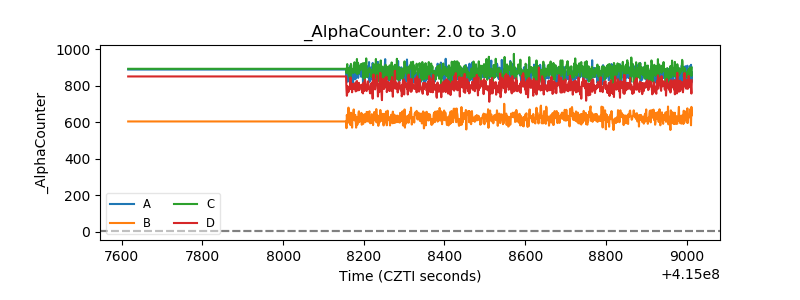 |
| _CPM_Rate | 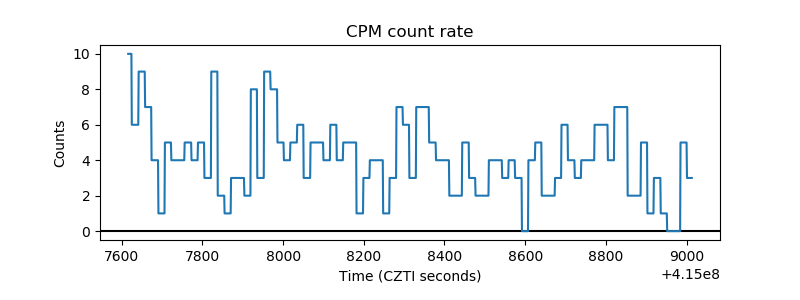 |
| CZT Counter | 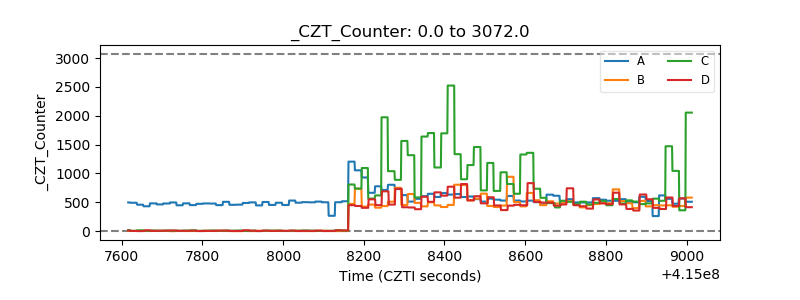 |
| +2.5 Volts monitor | 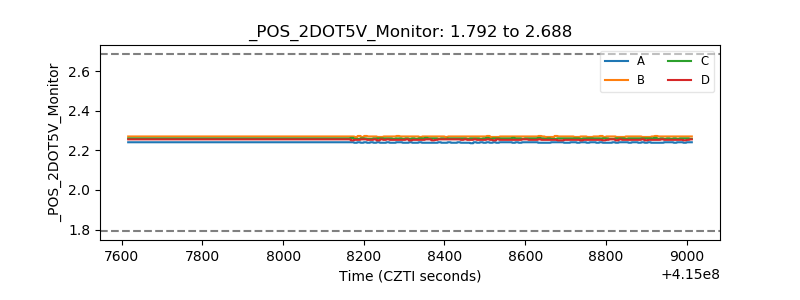 |
| +5 Volts monitor | 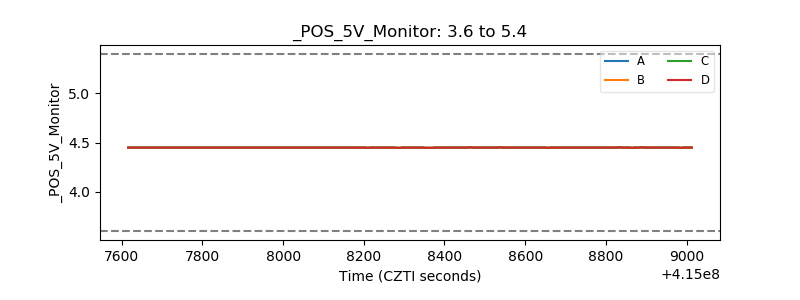 |
| _ROLL_ROT | 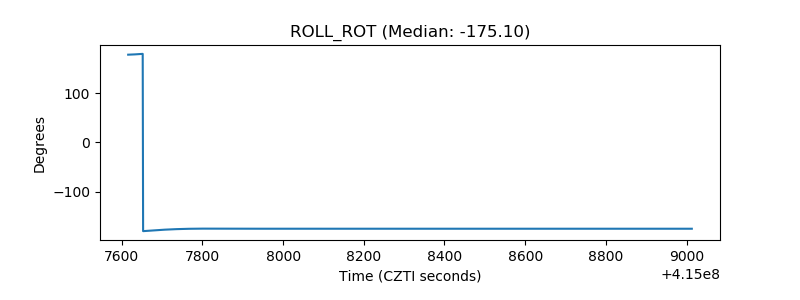 |
| _Roll_DEC | 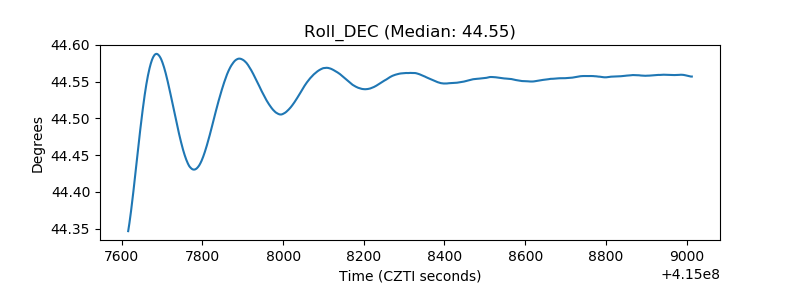 |
| _Roll_RA | 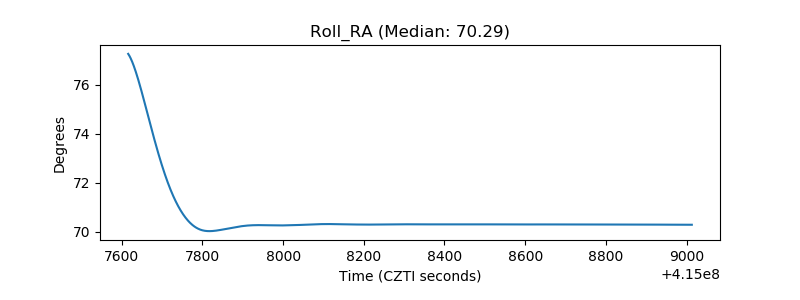 |
| Veto Counter | 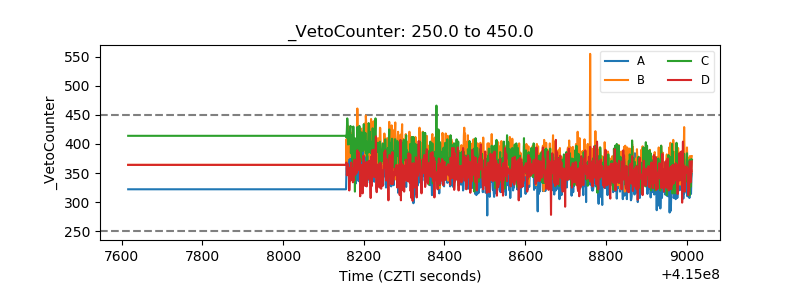 |