| Param | Original file | Final file |
|---|---|---|
| Filename | modeM0/AS1T05_086T01_9000005518_40075cztM0_level2.fits | modeM0/AS1T05_086T01_9000005518_40075cztM0_level2_quad_clean.evt |
| Size (bytes) | 728,746,560 | 185,705,280 |
| Size | 695.0 MB | 177.1 MB |
| Events in quadrant A | 5,585,980 | 1,293,269 |
| Events in quadrant B | 4,785,031 | 1,322,365 |
| Events in quadrant C | 9,345,014 | 1,167,169 |
| Events in quadrant D | 6,454,678 | 1,120,324 |
| Mode SS | |||
|---|---|---|---|
| Quadrant | BADHDUFLAG | Total packets | Discarded packets |
| A | 0 | 212 | 0 |
| B | 0 | 212 | 0 |
| C | 0 | 212 | 0 |
| D | 0 | 212 | 0 |
| Mode M0 | |||
|---|---|---|---|
| Quadrant | BADHDUFLAG | Total packets | Discarded packets |
| A | 0 | 22711 | 3 |
| B | 0 | 21147 | 2 |
| C | 0 | 34824 | 2 |
| D | 0 | 26240 | 2 |
| Mode M9 | |||
|---|---|---|---|
| Quadrant | BADHDUFLAG | Total packets | Discarded packets |
| A | 0 | 26 | 0 |
| B | 0 | 26 | 0 |
| C | 0 | 26 | 0 |
| D | 0 | 26 | 0 |
| Quadrant | Total seconds | Saturated seconds | Saturation percentage |
|---|---|---|---|
| A | 10397 | 74 | 0.711744% |
| B | 10397 | 29 | 0.278927% |
| C | 10397 | 773 | 7.434837% |
| D | 10397 | 216 | 2.077522% |
Noise dominated data is calculated using 1-second bins in cleaned event files. If a bin has >2000 counts, and if more than 50% of those come from <1% of pixels, then it is considered to be noise-dominated and hence unusable.
| Quadrant | # 1 sec bins | Bins with >0 counts | Bins with >2000 counts | High rate bins dominated by noise | Noise dominated (total time) | Noise dominated (detector-on time) | Marked lightcurve |
|---|---|---|---|---|---|---|---|
| A | 13021 | 10399 | 56 | 56 | 0.43% | 0.54% | 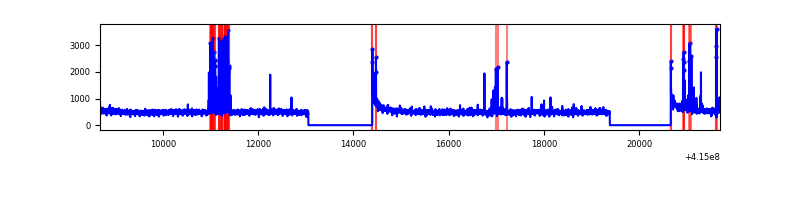 |
| B | 13021 | 10399 | 24 | 24 | 0.18% | 0.23% | 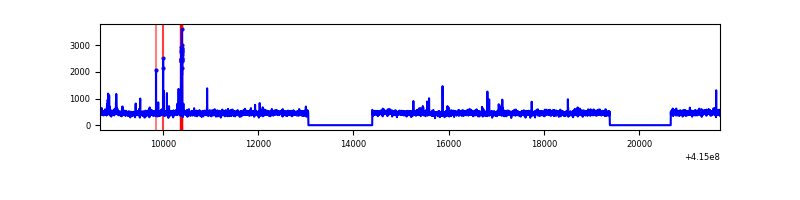 |
| C | 13021 | 10399 | 653 | 653 | 5.01% | 6.28% | 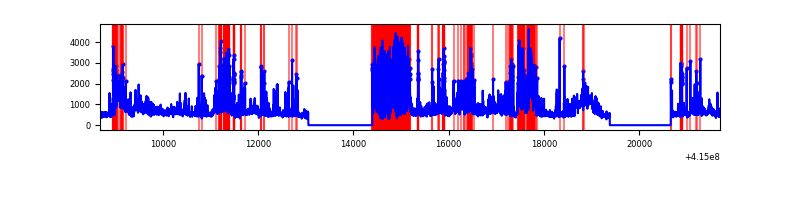 |
| D | 13021 | 10399 | 195 | 195 | 1.50% | 1.88% | 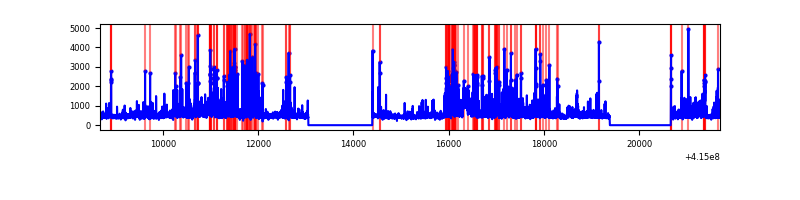 |
Top three noisy pixels from each quadrant. If the there are fewer than three noisy pixels in the level2.evt file, extra rows are filled as -1
| Pixel properties | Quadrant properties | ||||||
|---|---|---|---|---|---|---|---|
| Quadrant | DetID | PixID | Counts | Sigma | Mean | Median | Sigma |
| A | 10 | 83 | 743160 | 3046.98 | 1159 | 1138 | 243.5 |
| A | 13 | 248 | 253067 | 1034.5 | 1159 | 1138 | 243.5 |
| A | 9 | 143 | 83740 | 339.19 | 1159 | 1138 | 243.5 |
| B | 0 | 230 | 78570 | 345.21 | 1153 | 1125 | 224.3 |
| B | 5 | 32 | 72152 | 316.6 | 1153 | 1125 | 224.3 |
| B | 4 | 171 | 39563 | 171.34 | 1153 | 1125 | 224.3 |
| C | 9 | 187 | 3645137 | 14048.69 | 1096 | 1109 | 259.4 |
| C | 3 | 233 | 410799 | 1579.46 | 1096 | 1109 | 259.4 |
| C | 15 | 214 | 408772 | 1571.65 | 1096 | 1109 | 259.4 |
| D | 12 | 227 | 712024 | 2533.74 | 1120 | 1091 | 280.6 |
| D | 2 | 249 | 581672 | 2069.17 | 1120 | 1091 | 280.6 |
| D | 2 | 250 | 238152 | 844.88 | 1120 | 1091 | 280.6 |
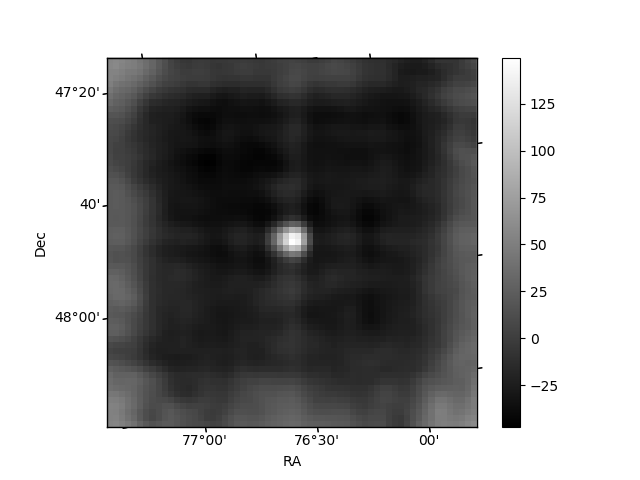
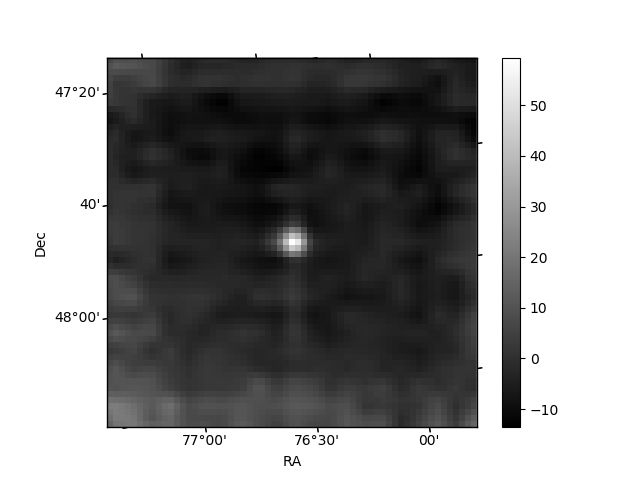
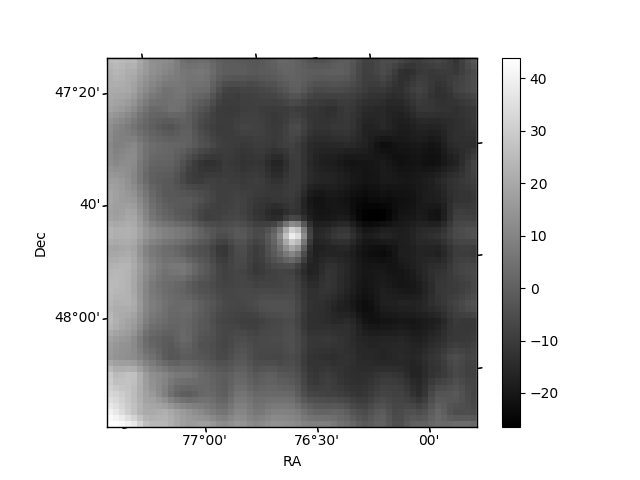
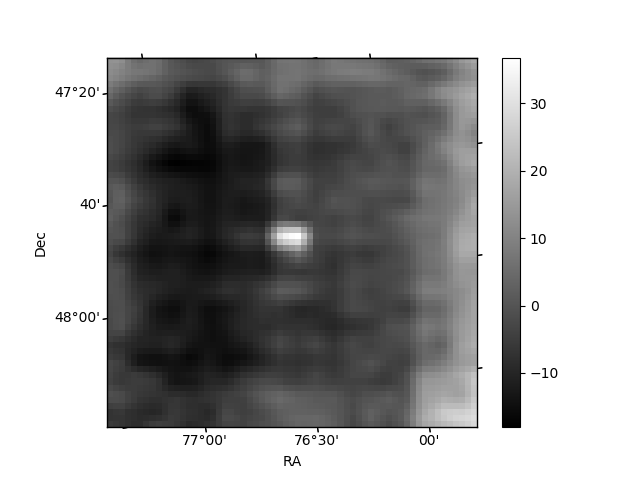
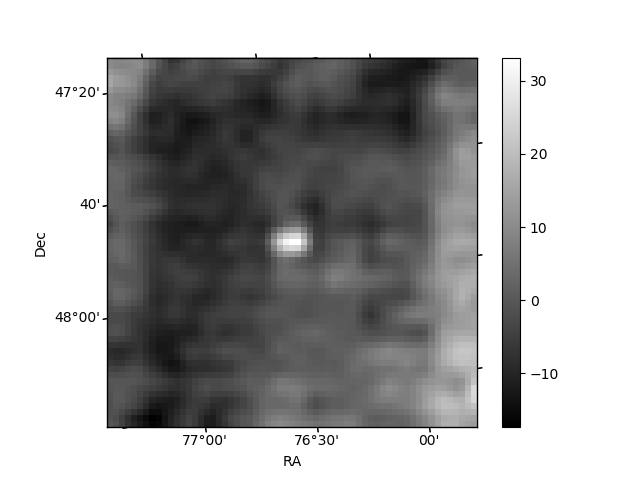
Histogram calculated using DETX and DETY for each event in the final _common_clean file
| Quadrant A | 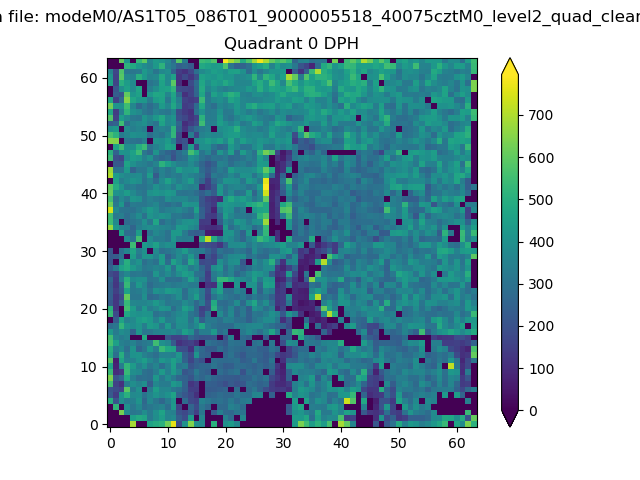 |
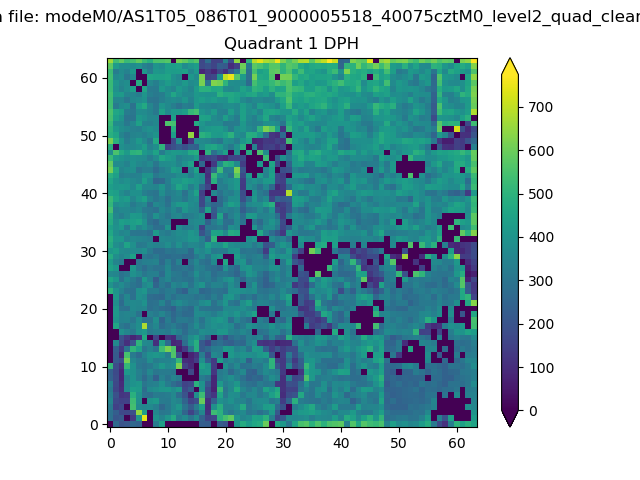 |
Quadrant B |
|---|---|---|---|
| Quadrant D | 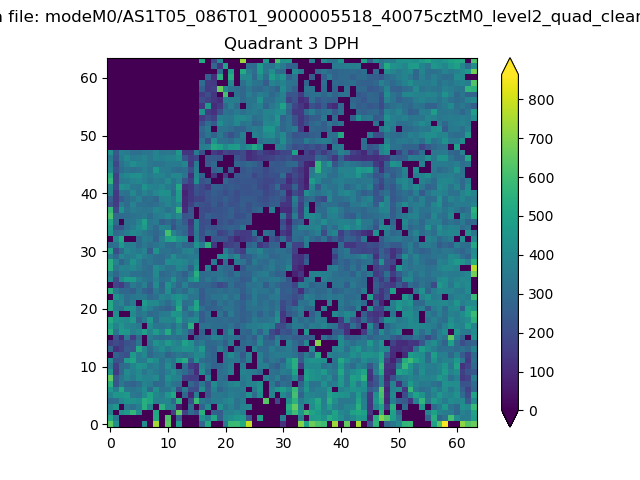 |
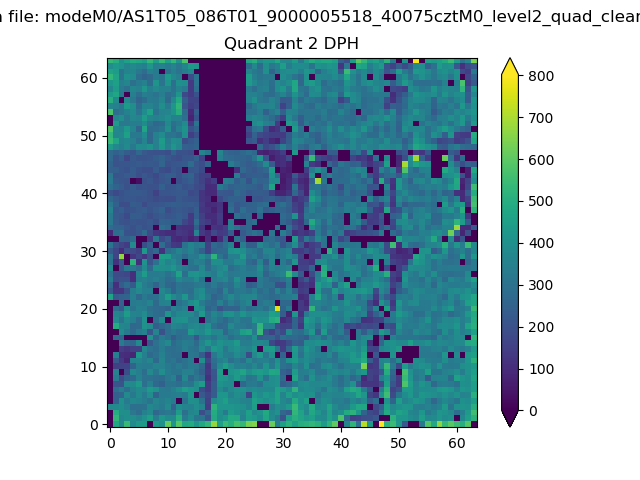 |
Quadrant C |
| Plot type | Count rate plots | Images |
|---|---|---|
| Comparison with Poisson distribution Blue bars denote a histogram of data divided into 1 sec bins. Red curve is a Poisson curve with rate = median count rate of data. |
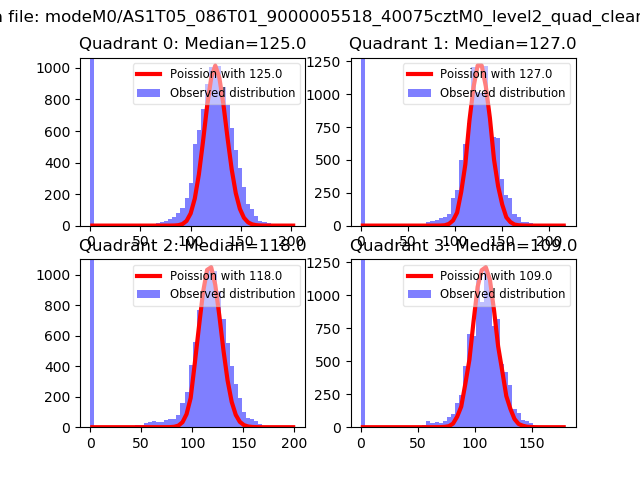 |
 |
| Quadrant-wise count rates Data is divided into 100 sec bins |
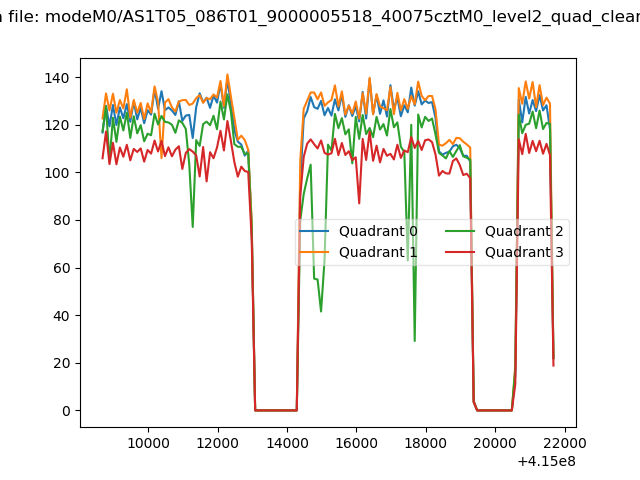 |
|
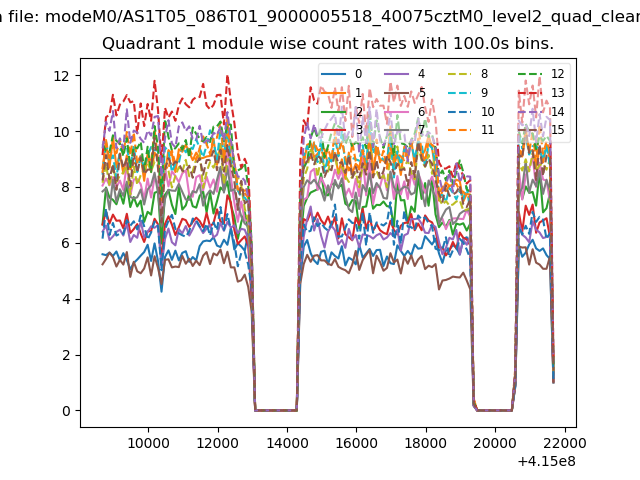
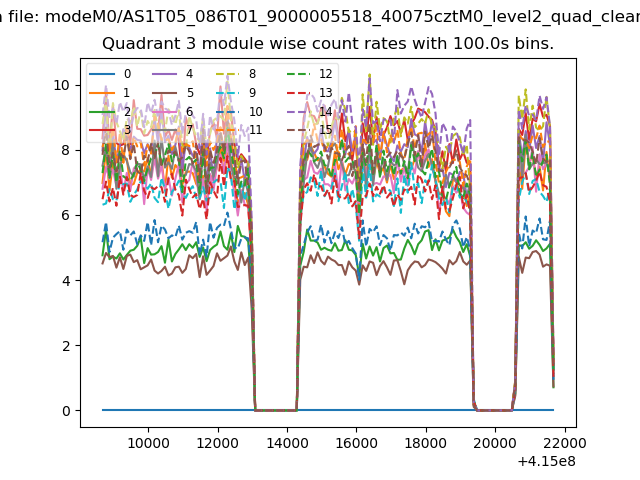
| Module-wise count rates for Quadrant A Data is divided into 100 sec bins |
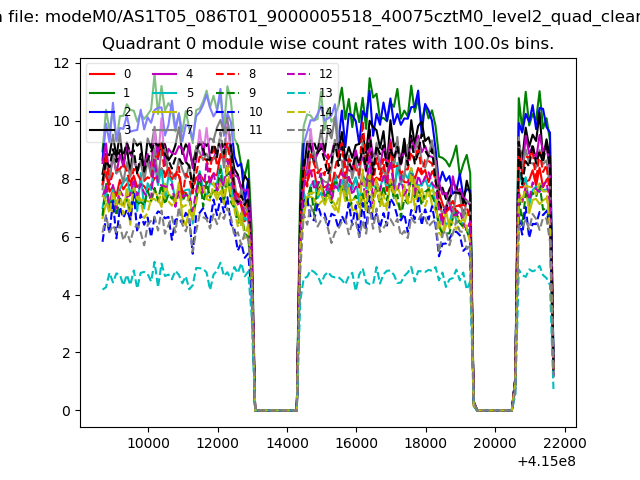 |
 |
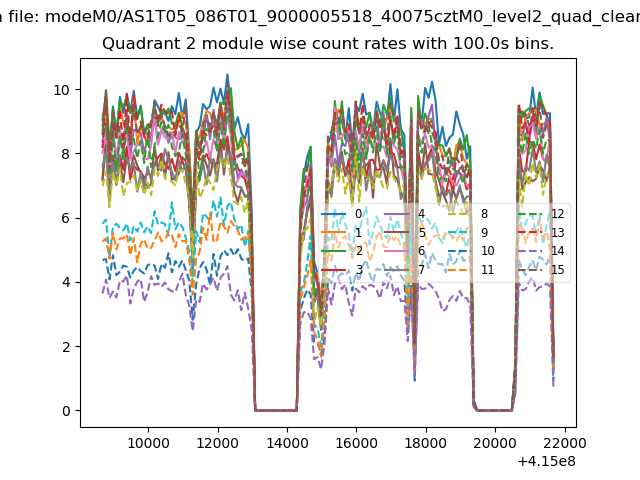
| Module-wise count rates for Quadrant B Data is divided into 100 sec bins |
 |
 |
| Module-wise count rates for Quadrant C Data is divided into 100 sec bins |
 |
 |
| Module-wise count rates for Quadrant D Data is divided into 100 sec bins |
 |
 |
| Parameter | Plot |
|---|---|
| CZT HV Monitor | 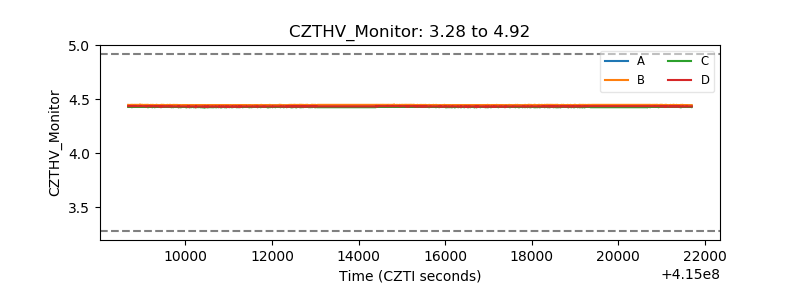 |
| D_VDD | 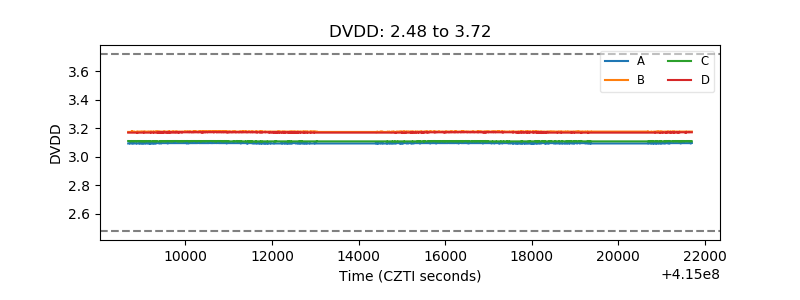 |
| Temperature 1 | 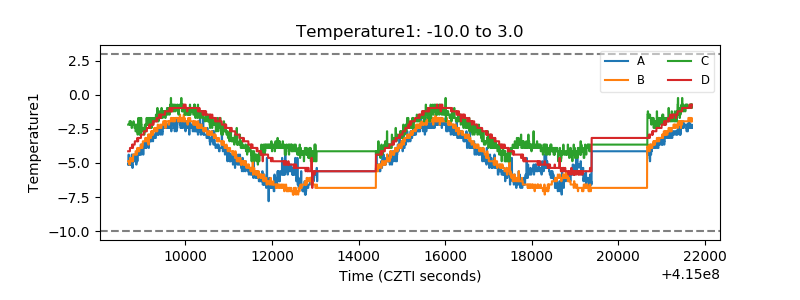 |
| Veto HV Monitor | 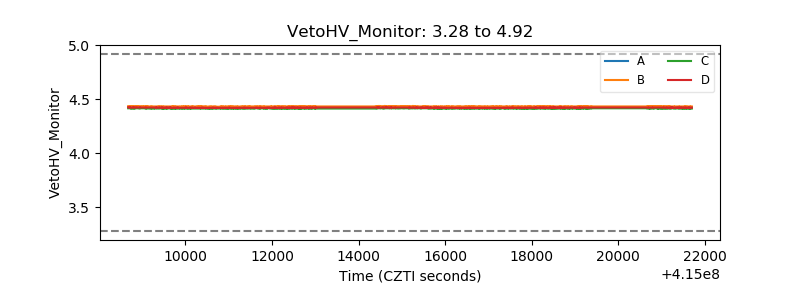 |
| Veto LLD | 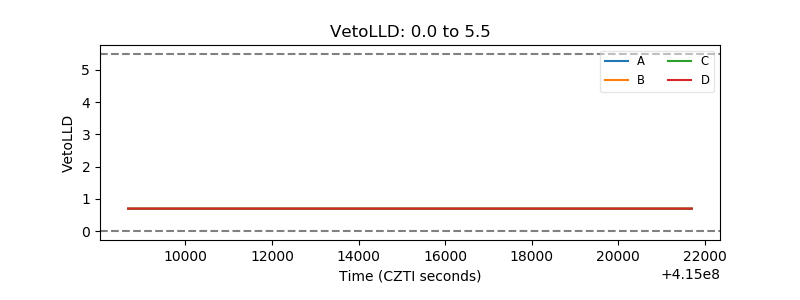 |
| Alpha Counter | 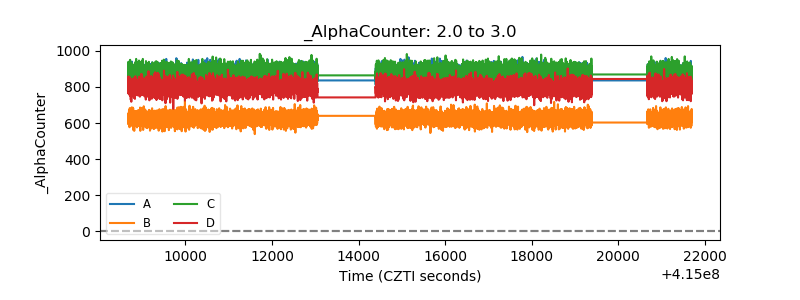 |
| _CPM_Rate | 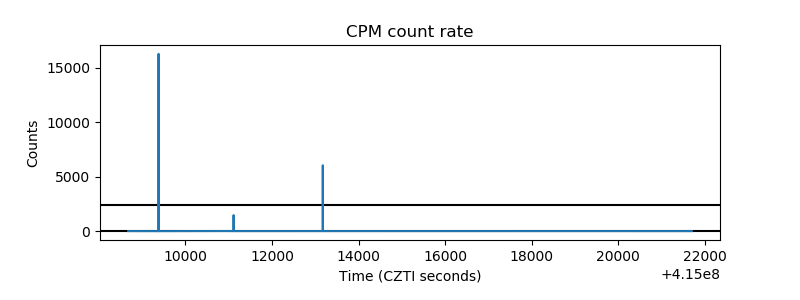 |
| CZT Counter | 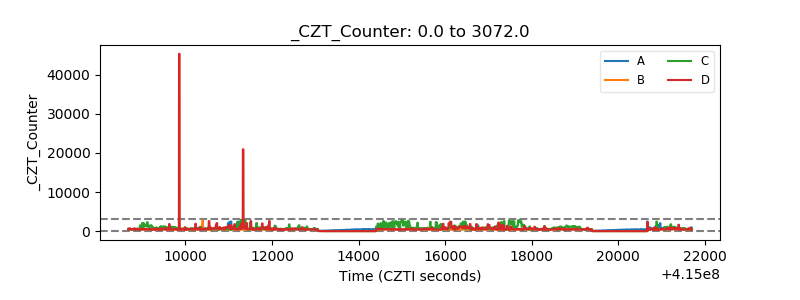 |
| +2.5 Volts monitor | 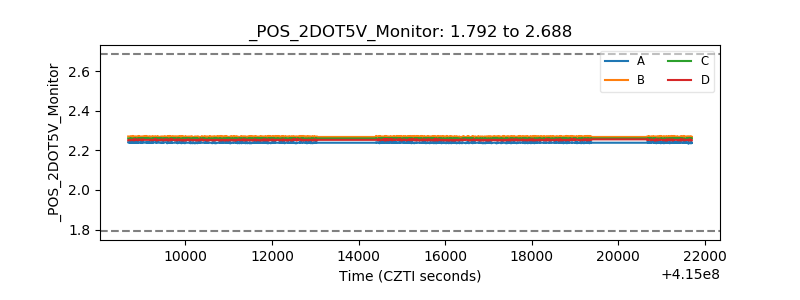 |
| +5 Volts monitor | 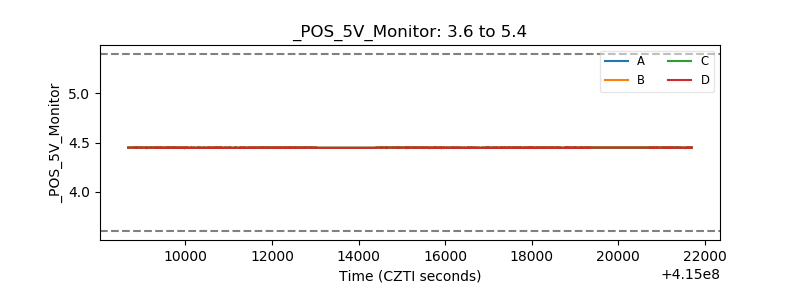 |
| _ROLL_ROT | 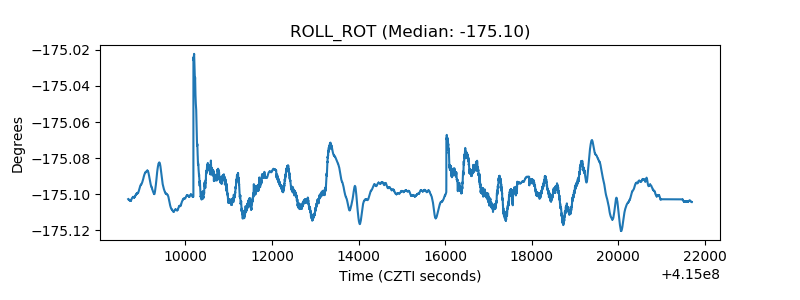 |
| _Roll_DEC | 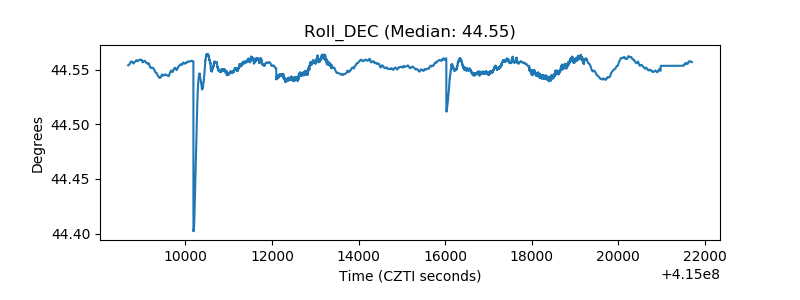 |
| _Roll_RA | 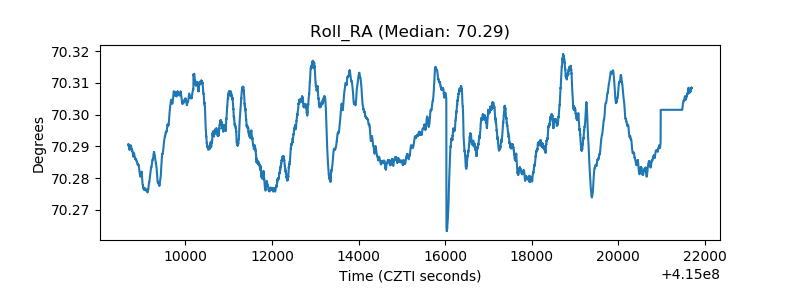 |
| Veto Counter | 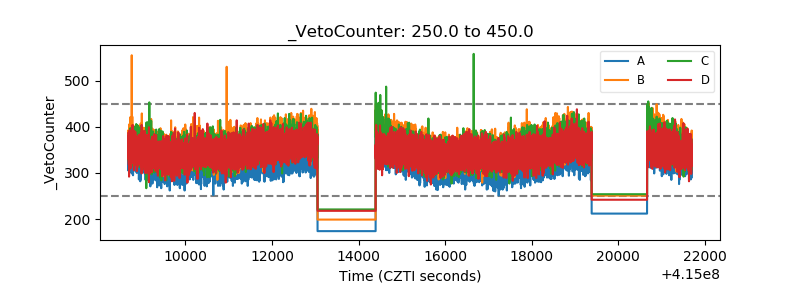 |