| Param | Original file | Final file |
|---|---|---|
| Filename | modeM0/AS1T05_086T01_9000005518_40077cztM0_level2.fits | modeM0/AS1T05_086T01_9000005518_40077cztM0_level2_quad_clean.evt |
| Size (bytes) | 625,642,560 | 171,506,880 |
| Size | 596.7 MB | 163.6 MB |
| Events in quadrant A | 5,102,685 | 1,171,910 |
| Events in quadrant B | 4,359,693 | 1,197,242 |
| Events in quadrant C | 6,674,815 | 1,117,507 |
| Events in quadrant D | 6,259,953 | 1,025,428 |
| Mode SS | |||
|---|---|---|---|
| Quadrant | BADHDUFLAG | Total packets | Discarded packets |
| A | 0 | 200 | 0 |
| B | 0 | 200 | 0 |
| C | 0 | 200 | 0 |
| D | 0 | 200 | 0 |
| Mode M0 | |||
|---|---|---|---|
| Quadrant | BADHDUFLAG | Total packets | Discarded packets |
| A | 0 | 21163 | 2 |
| B | 0 | 19839 | 2 |
| C | 0 | 26110 | 2 |
| D | 0 | 25458 | 2 |
| Mode M9 | |||
|---|---|---|---|
| Quadrant | BADHDUFLAG | Total packets | Discarded packets |
| A | 0 | 27 | 0 |
| B | 0 | 26 | 0 |
| C | 0 | 26 | 0 |
| D | 0 | 27 | 0 |
| Quadrant | Total seconds | Saturated seconds | Saturation percentage |
|---|---|---|---|
| A | 9828 | 42 | 0.427350% |
| B | 9828 | 24 | 0.244200% |
| C | 9828 | 218 | 2.218152% |
| D | 9828 | 225 | 2.289377% |
Noise dominated data is calculated using 1-second bins in cleaned event files. If a bin has >2000 counts, and if more than 50% of those come from <1% of pixels, then it is considered to be noise-dominated and hence unusable.
| Quadrant | # 1 sec bins | Bins with >0 counts | Bins with >2000 counts | High rate bins dominated by noise | Noise dominated (total time) | Noise dominated (detector-on time) | Marked lightcurve |
|---|---|---|---|---|---|---|---|
| A | 11139 | 9829 | 24 | 24 | 0.22% | 0.24% | 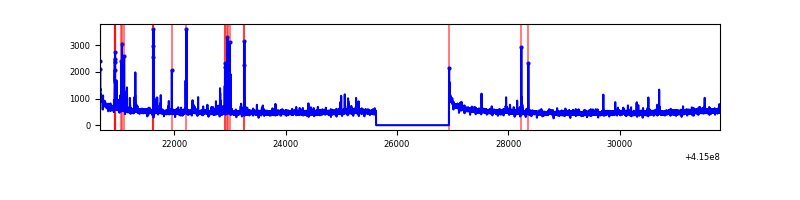 |
| B | 11139 | 9829 | 4 | 4 | 0.04% | 0.04% | 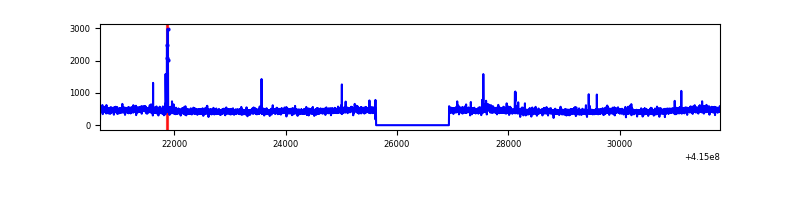 |
| C | 11139 | 9829 | 239 | 239 | 2.15% | 2.43% | 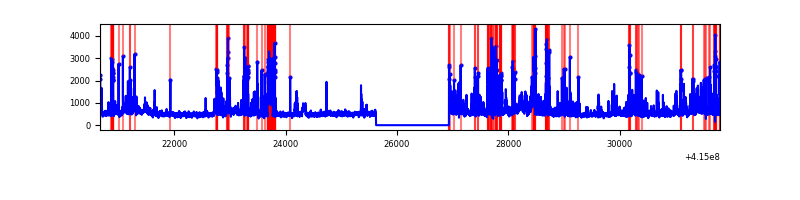 |
| D | 11139 | 9829 | 226 | 226 | 2.03% | 2.30% | 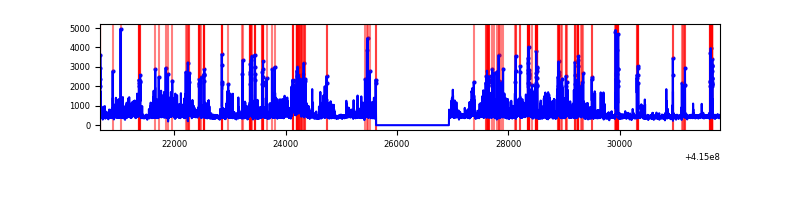 |
Top three noisy pixels from each quadrant. If the there are fewer than three noisy pixels in the level2.evt file, extra rows are filled as -1
| Pixel properties | Quadrant properties | ||||||
|---|---|---|---|---|---|---|---|
| Quadrant | DetID | PixID | Counts | Sigma | Mean | Median | Sigma |
| A | 10 | 83 | 700773 | 3153.08 | 1078 | 1060 | 221.9 |
| A | 9 | 143 | 114198 | 509.83 | 1078 | 1060 | 221.9 |
| A | 13 | 248 | 60674 | 268.64 | 1078 | 1060 | 221.9 |
| B | 0 | 186 | 43382 | 203.13 | 1077 | 1053 | 208.4 |
| B | 0 | 230 | 40922 | 191.32 | 1077 | 1053 | 208.4 |
| B | 0 | 189 | 26139 | 120.38 | 1077 | 1053 | 208.4 |
| C | 9 | 187 | 1016012 | 4120.89 | 1047 | 1059 | 246.3 |
| C | 14 | 254 | 678274 | 2749.61 | 1047 | 1059 | 246.3 |
| C | 15 | 214 | 396504 | 1605.58 | 1047 | 1059 | 246.3 |
| D | 12 | 227 | 932069 | 3624.93 | 1039 | 1012 | 256.8 |
| D | 2 | 249 | 470478 | 1827.8 | 1039 | 1012 | 256.8 |
| D | 2 | 250 | 275347 | 1068.08 | 1039 | 1012 | 256.8 |
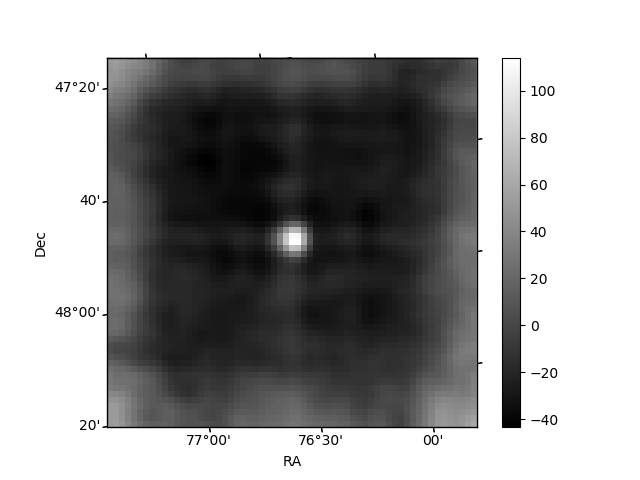
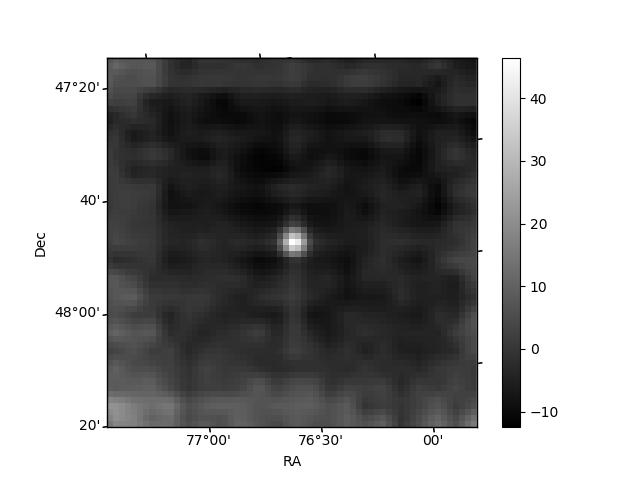
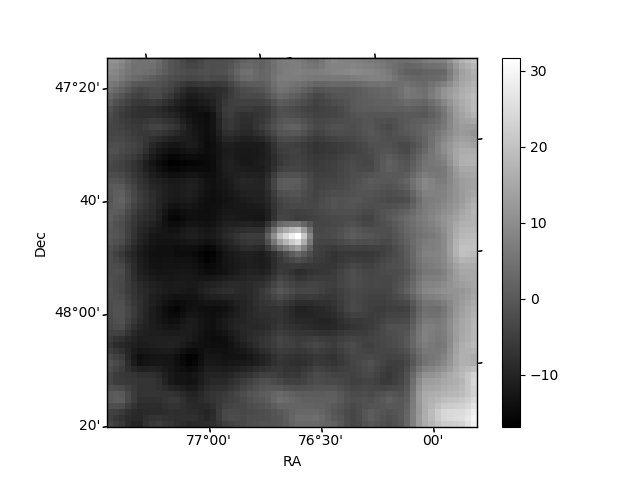
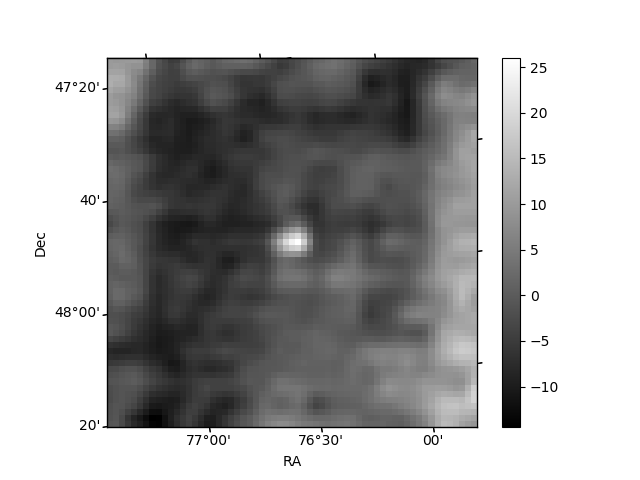
Histogram calculated using DETX and DETY for each event in the final _common_clean file
| Quadrant A | 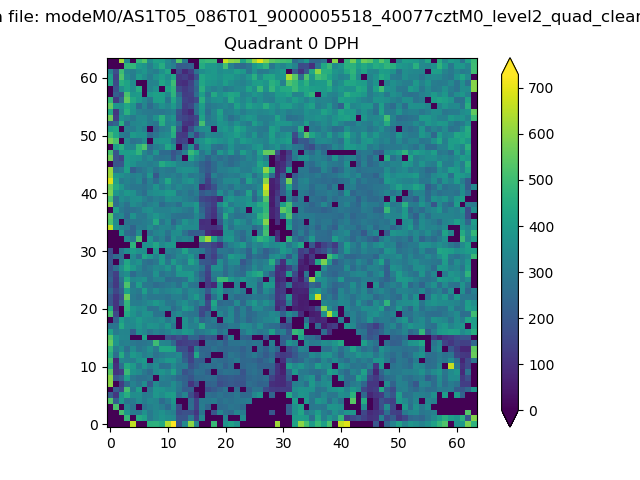 |
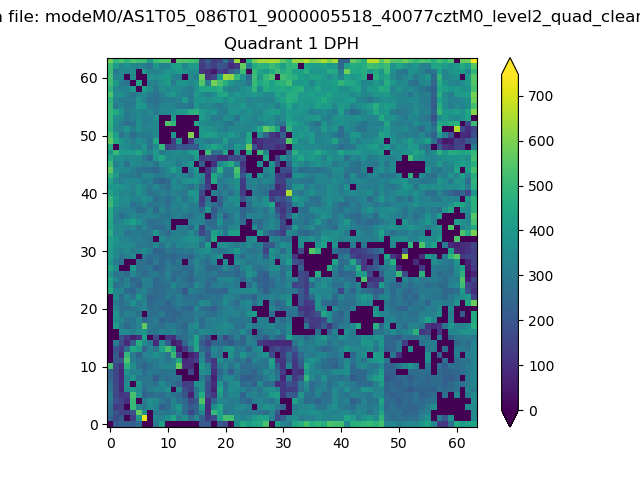 |
Quadrant B |
|---|---|---|---|
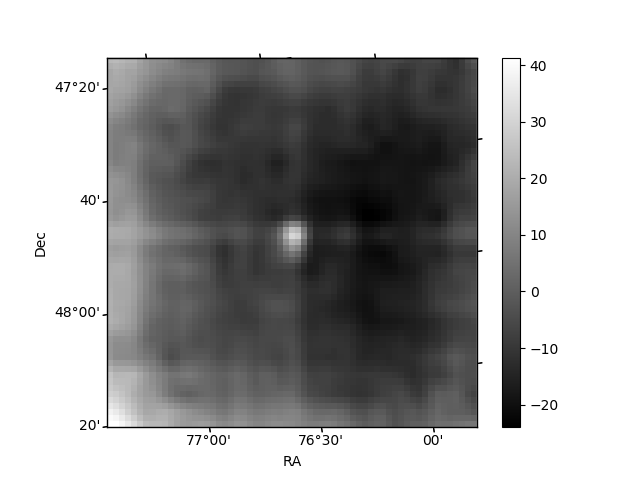
| Quadrant D | 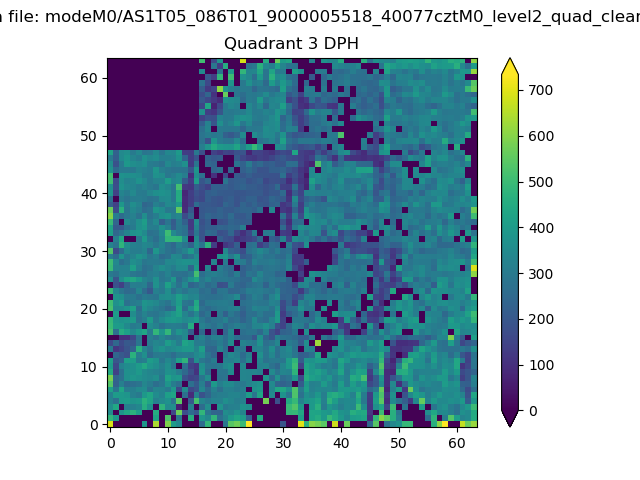 |
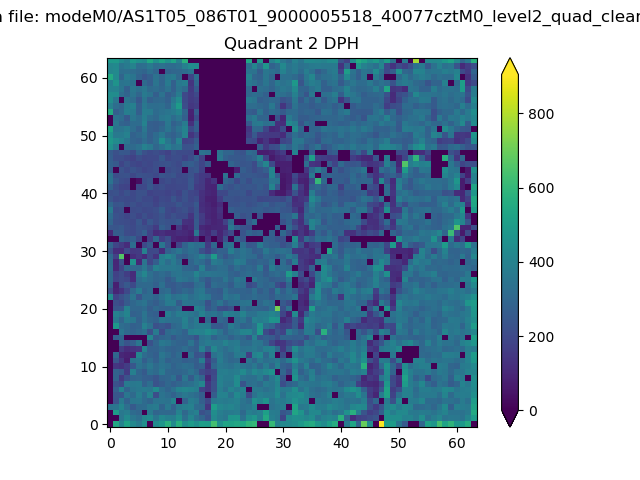 |
Quadrant C |
| Plot type | Count rate plots | Images |
|---|---|---|
| Comparison with Poisson distribution Blue bars denote a histogram of data divided into 1 sec bins. Red curve is a Poisson curve with rate = median count rate of data. |
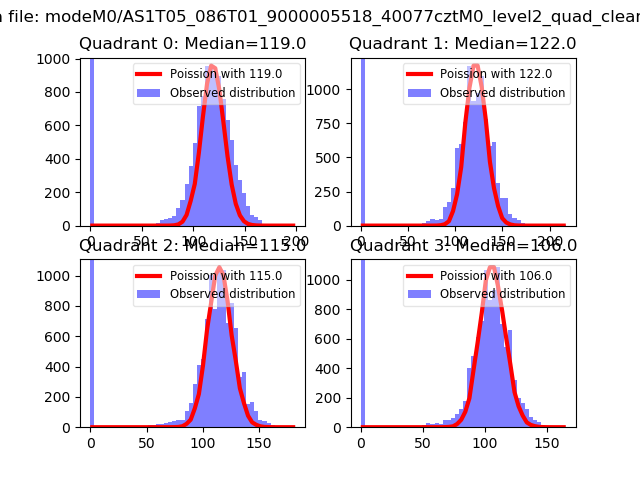 |
 |
| Quadrant-wise count rates Data is divided into 100 sec bins |
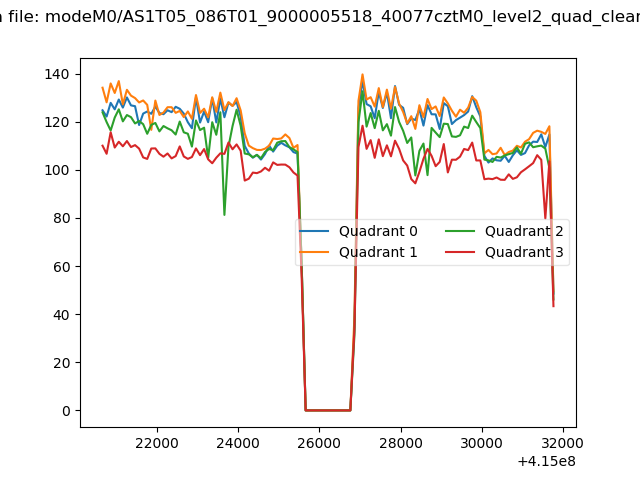 |
|
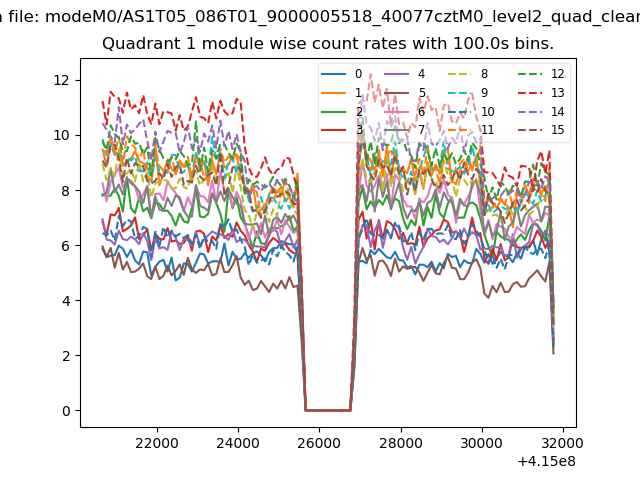
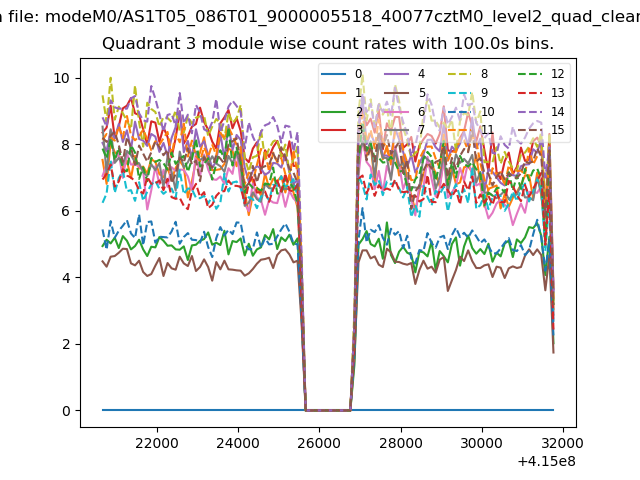
| Module-wise count rates for Quadrant A Data is divided into 100 sec bins |
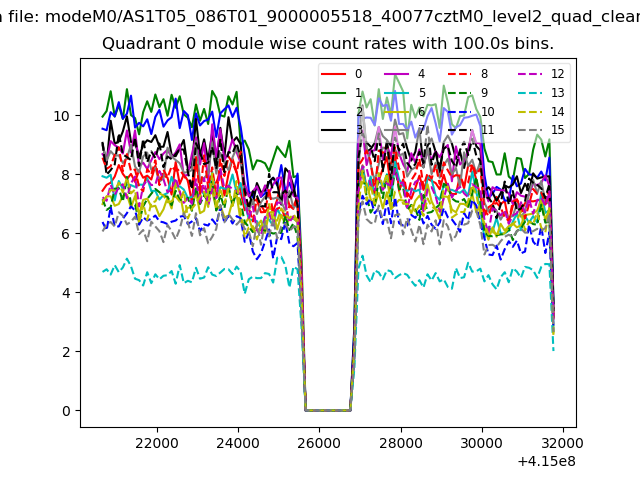 |
 |
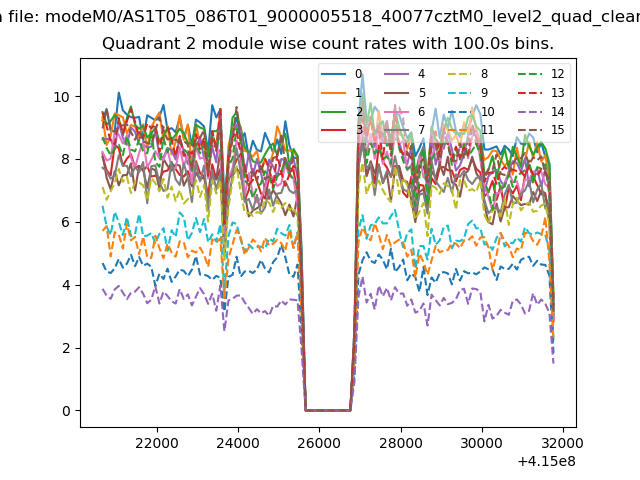
| Module-wise count rates for Quadrant B Data is divided into 100 sec bins |
 |
 |
| Module-wise count rates for Quadrant C Data is divided into 100 sec bins |
 |
 |
| Module-wise count rates for Quadrant D Data is divided into 100 sec bins |
 |
 |
| Parameter | Plot |
|---|---|
| CZT HV Monitor | 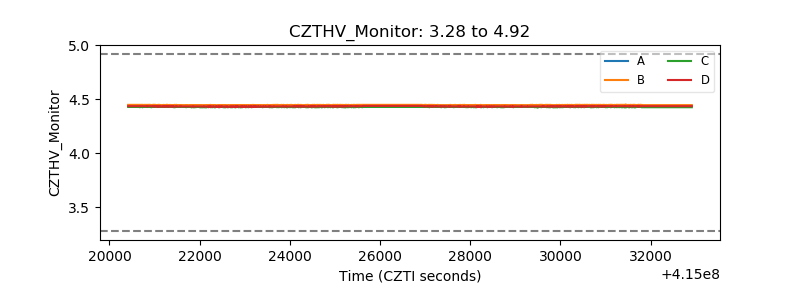 |
| D_VDD | 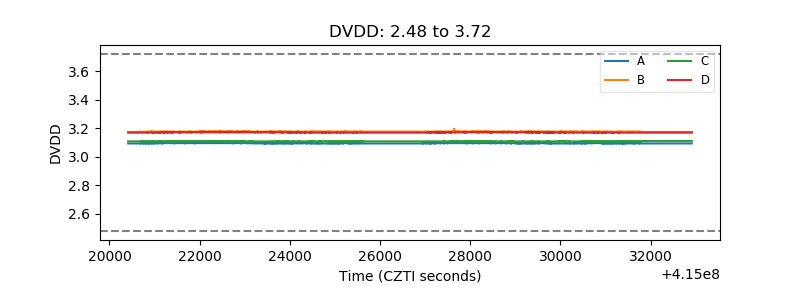 |
| Temperature 1 | 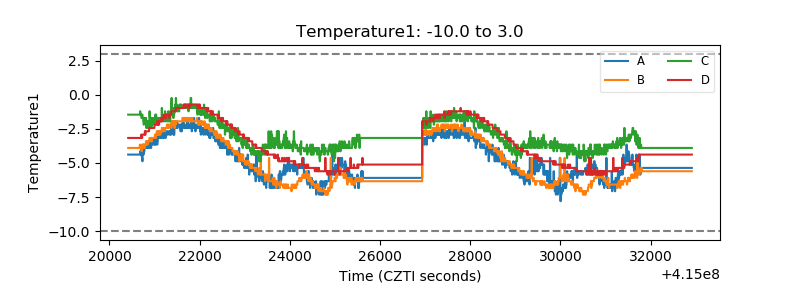 |
| Veto HV Monitor | 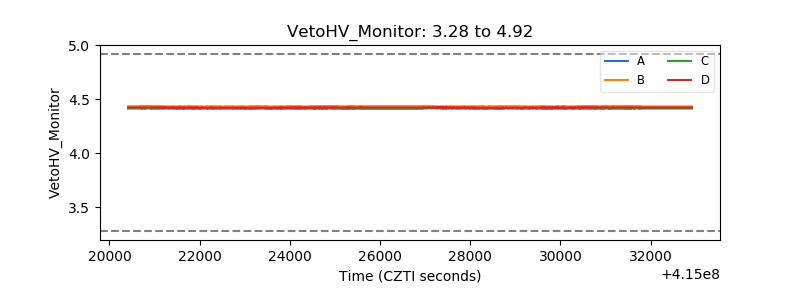 |
| Veto LLD | 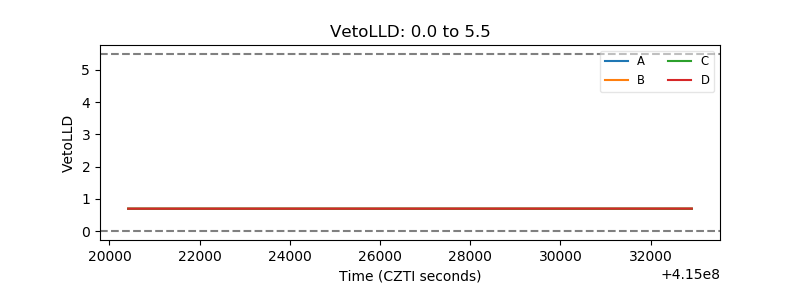 |
| Alpha Counter | 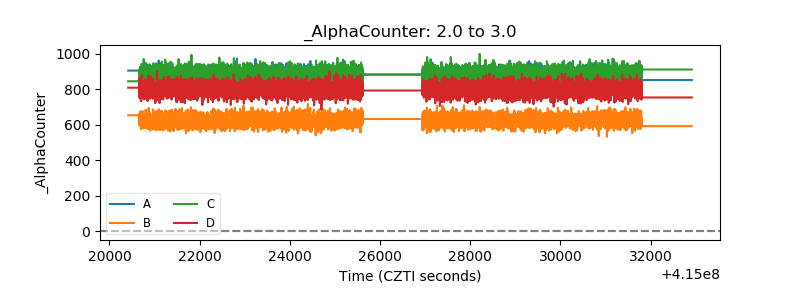 |
| _CPM_Rate | 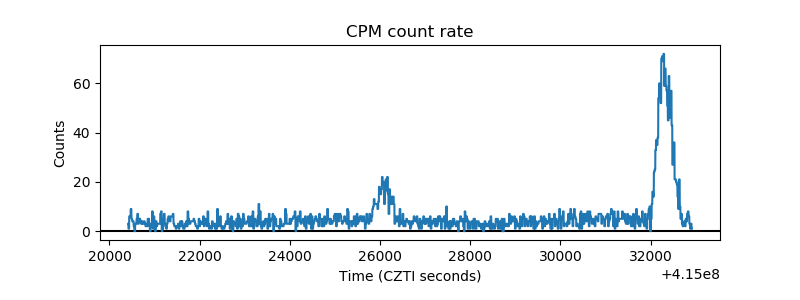 |
| CZT Counter | 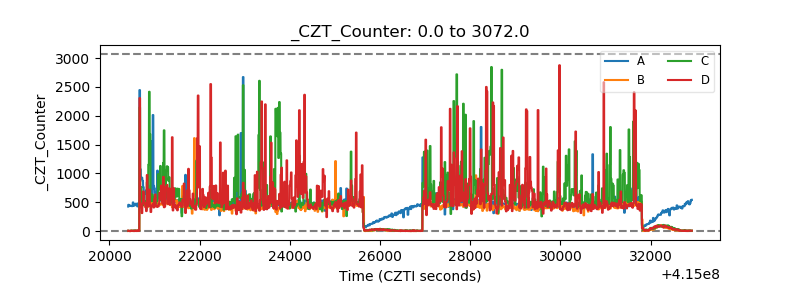 |
| +2.5 Volts monitor | 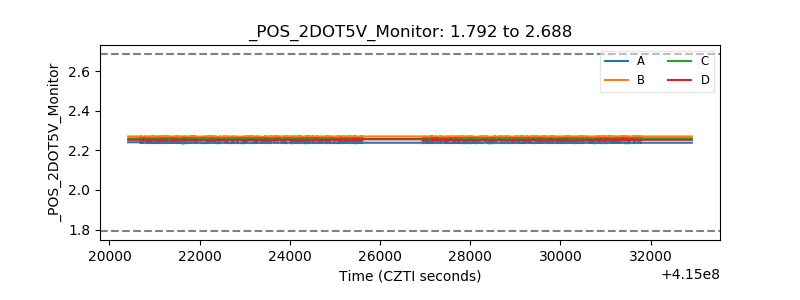 |
| +5 Volts monitor | 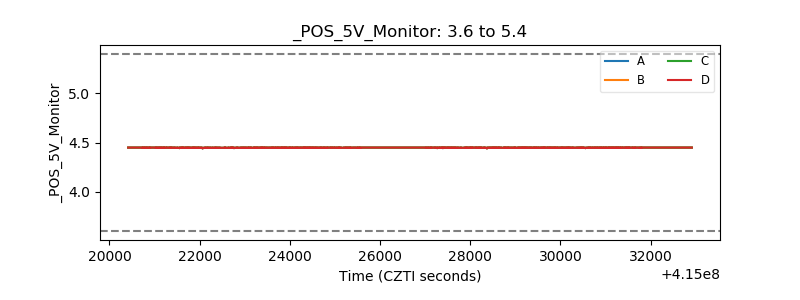 |
| _ROLL_ROT | 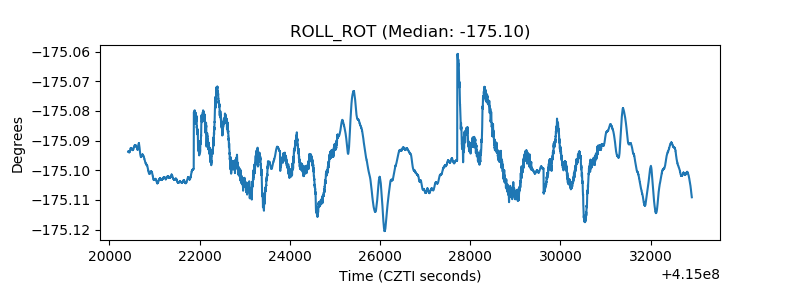 |
| _Roll_DEC | 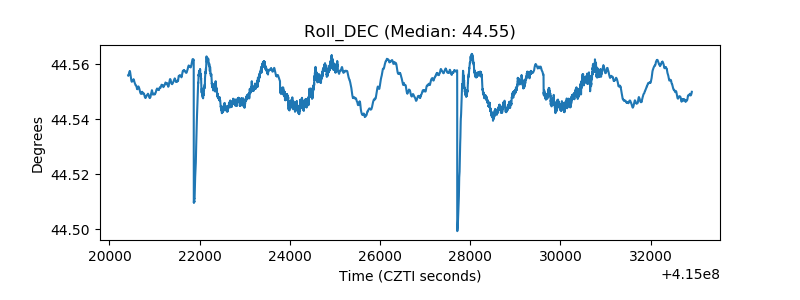 |
| _Roll_RA | 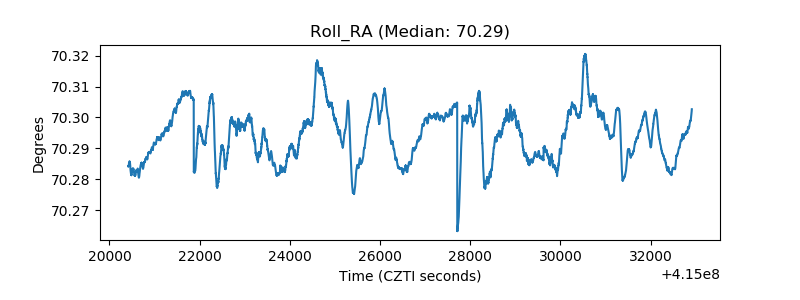 |
| Veto Counter | 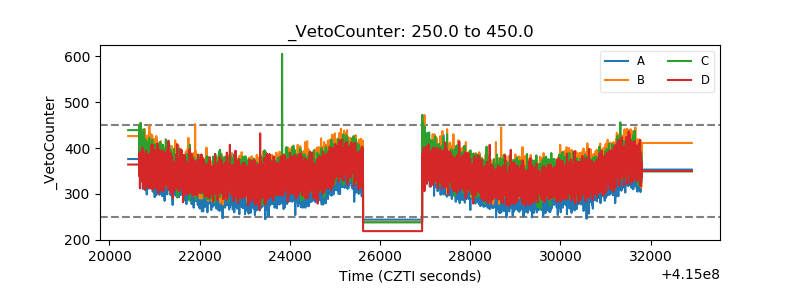 |