| Param | Original file | Final file |
|---|---|---|
| Filename | modeM0/AS1T05_086T01_9000005518_40078cztM0_level2.fits | modeM0/AS1T05_086T01_9000005518_40078cztM0_level2_quad_clean.evt |
| Size (bytes) | 1,777,492,800 | 436,363,200 |
| Size | 1.7 GB | 416.1 MB |
| Events in quadrant A | 13,283,437 | 3,037,216 |
| Events in quadrant B | 11,283,400 | 3,102,596 |
| Events in quadrant C | 21,946,011 | 2,751,879 |
| Events in quadrant D | 17,356,848 | 2,604,376 |
| Mode SS | |||
|---|---|---|---|
| Quadrant | BADHDUFLAG | Total packets | Discarded packets |
| A | 0 | 510 | 0 |
| B | 0 | 510 | 0 |
| C | 0 | 510 | 0 |
| D | 0 | 510 | 0 |
| Mode M0 | |||
|---|---|---|---|
| Quadrant | BADHDUFLAG | Total packets | Discarded packets |
| A | 0 | 54614 | 6 |
| B | 0 | 50694 | 5 |
| C | 0 | 81835 | 5 |
| D | 0 | 68737 | 5 |
| Mode M9 | |||
|---|---|---|---|
| Quadrant | BADHDUFLAG | Total packets | Discarded packets |
| A | 0 | 68 | 0 |
| B | 0 | 68 | 0 |
| C | 0 | 68 | 0 |
| D | 0 | 68 | 0 |
| Quadrant | Total seconds | Saturated seconds | Saturation percentage |
|---|---|---|---|
| A | 24948 | 165 | 0.661376% |
| B | 24948 | 56 | 0.224467% |
| C | 24948 | 1976 | 7.920475% |
| D | 24948 | 1068 | 4.280904% |
Noise dominated data is calculated using 1-second bins in cleaned event files. If a bin has >2000 counts, and if more than 50% of those come from <1% of pixels, then it is considered to be noise-dominated and hence unusable.
| Quadrant | # 1 sec bins | Bins with >0 counts | Bins with >2000 counts | High rate bins dominated by noise | Noise dominated (total time) | Noise dominated (detector-on time) | Marked lightcurve |
|---|---|---|---|---|---|---|---|
| A | 31807 | 24953 | 112 | 112 | 0.35% | 0.45% | 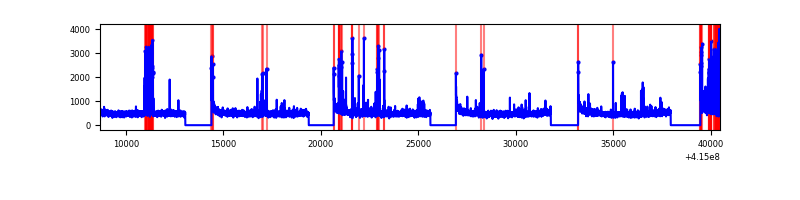 |
| B | 31807 | 24953 | 28 | 28 | 0.09% | 0.11% | 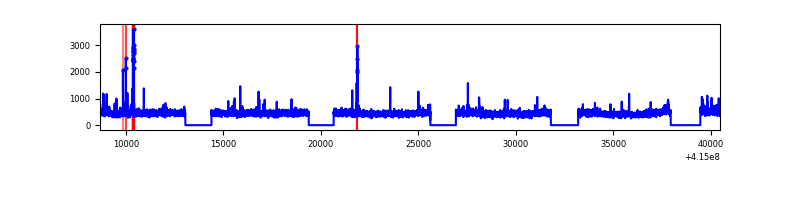 |
| C | 31807 | 24953 | 1717 | 1717 | 5.40% | 6.88% | 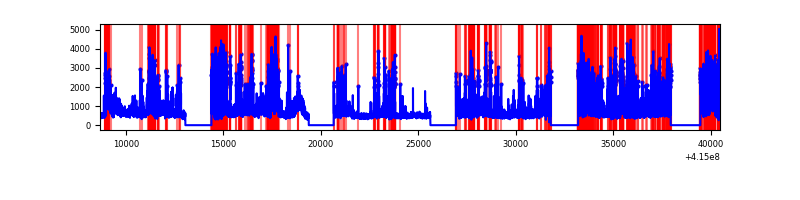 |
| D | 31807 | 24953 | 1000 | 1000 | 3.14% | 4.01% | 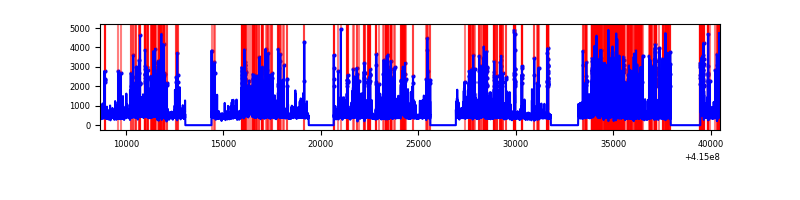 |
Top three noisy pixels from each quadrant. If the there are fewer than three noisy pixels in the level2.evt file, extra rows are filled as -1
| Pixel properties | Quadrant properties | ||||||
|---|---|---|---|---|---|---|---|
| Quadrant | DetID | PixID | Counts | Sigma | Mean | Median | Sigma |
| A | 10 | 83 | 1800791 | 3182.67 | 2752 | 2710 | 565.0 |
| A | 13 | 248 | 543713 | 957.59 | 2752 | 2710 | 565.0 |
| A | 9 | 143 | 127178 | 220.31 | 2752 | 2710 | 565.0 |
| B | 0 | 189 | 144189 | 268.35 | 2746 | 2680 | 527.3 |
| B | 0 | 230 | 129265 | 240.05 | 2746 | 2680 | 527.3 |
| B | 5 | 32 | 81482 | 149.44 | 2746 | 2680 | 527.3 |
| C | 9 | 187 | 8573353 | 13958.33 | 2609 | 2640 | 614.0 |
| C | 15 | 214 | 983282 | 1597.08 | 2609 | 2640 | 614.0 |
| C | 14 | 254 | 822161 | 1334.68 | 2609 | 2640 | 614.0 |
| D | 12 | 227 | 3375409 | 5110.78 | 2642 | 2575 | 659.9 |
| D | 2 | 249 | 1605291 | 2428.56 | 2642 | 2575 | 659.9 |
| D | 9 | 19 | 773291 | 1167.85 | 2642 | 2575 | 659.9 |
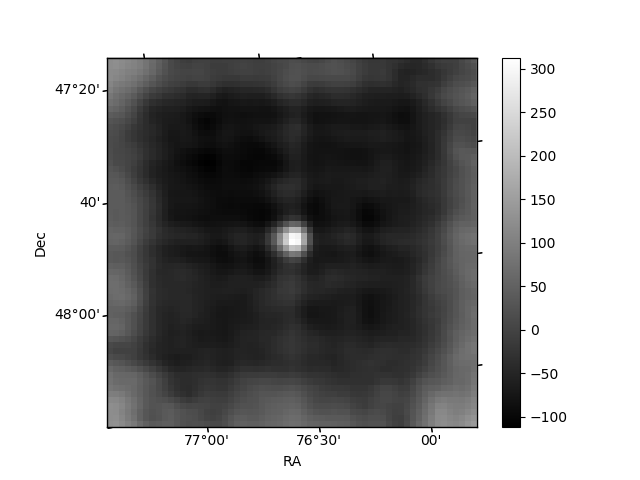
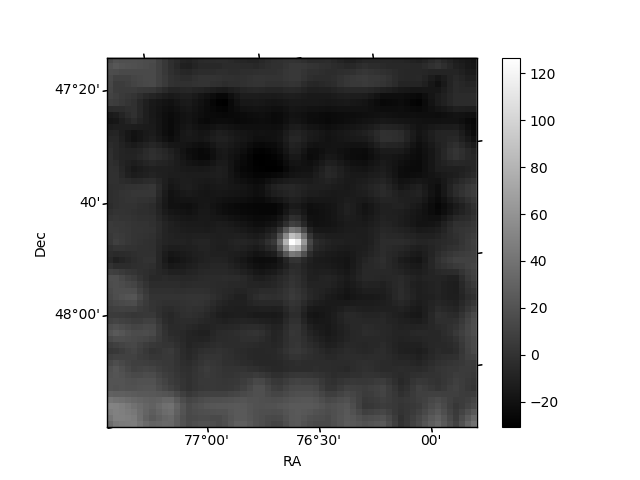
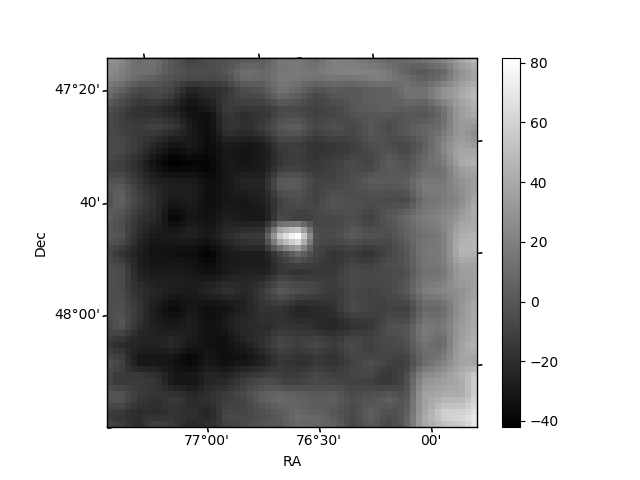
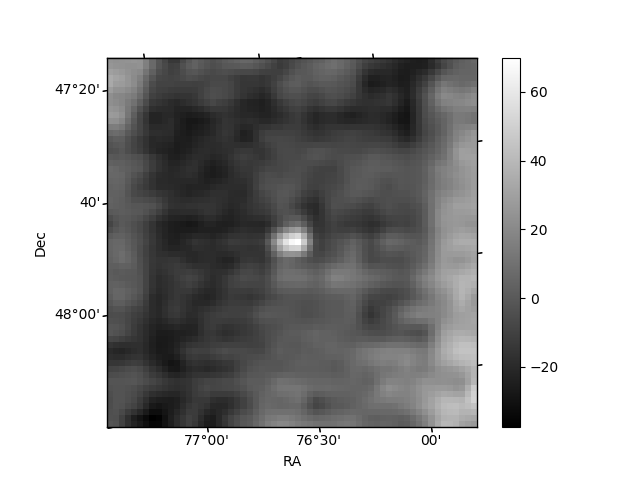
Histogram calculated using DETX and DETY for each event in the final _common_clean file
| Quadrant A | 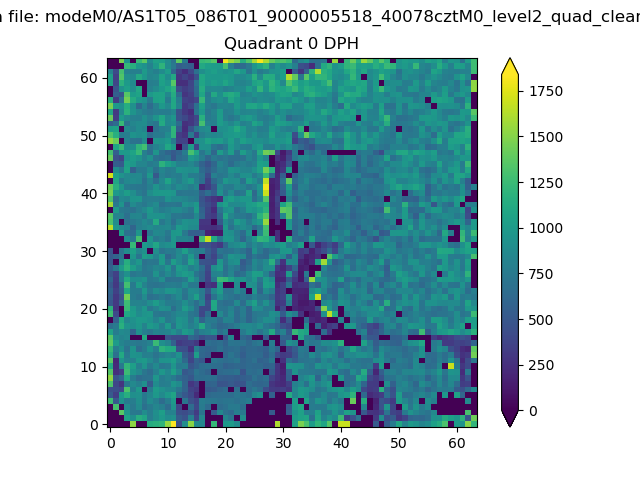 |
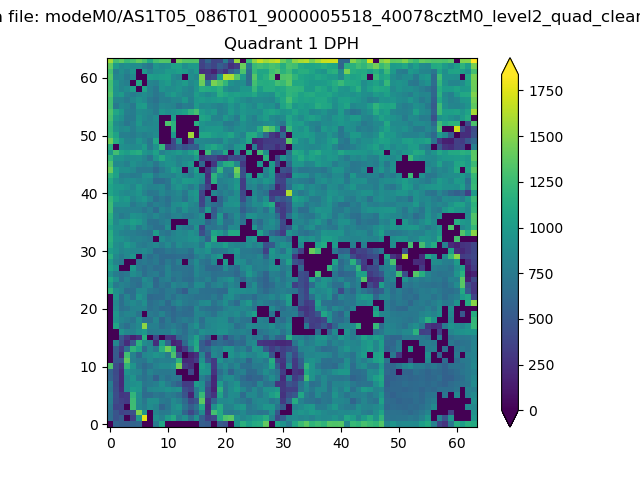 |
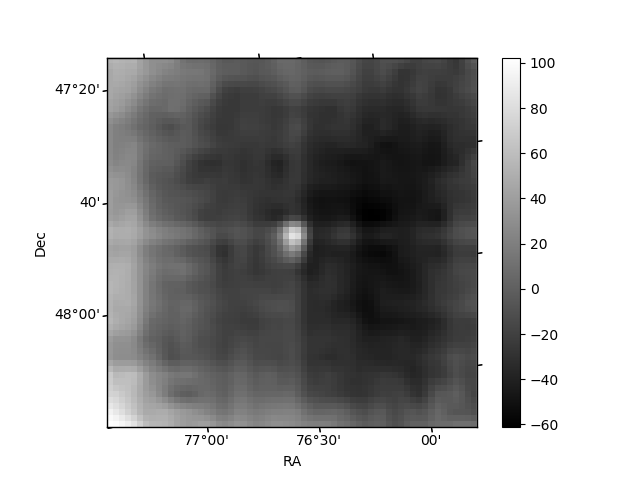
Quadrant B |
|---|---|---|---|
| Quadrant D | 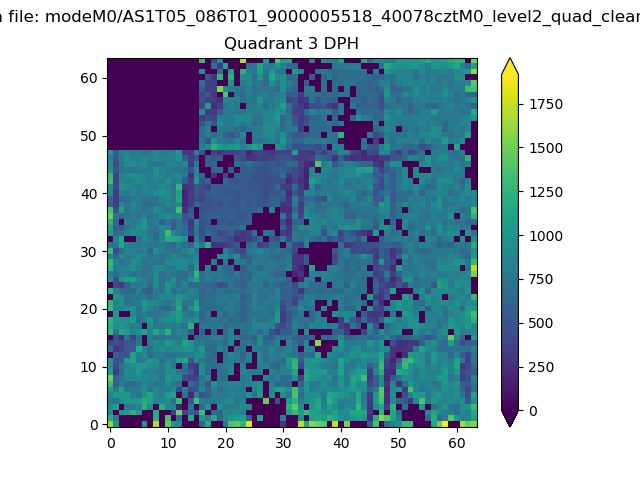 |
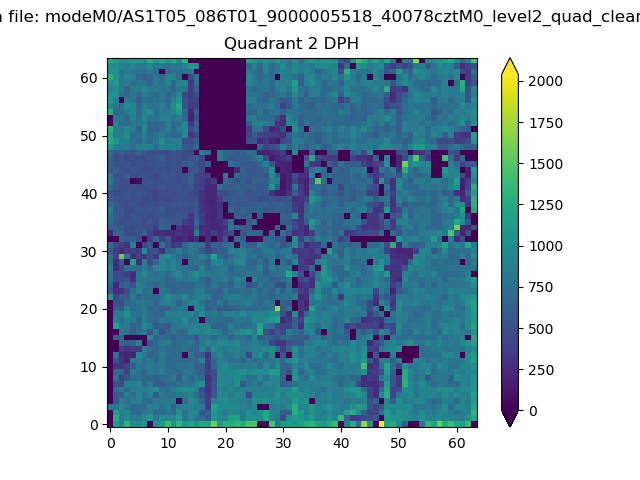 |
Quadrant C |
| Plot type | Count rate plots | Images |
|---|---|---|
| Comparison with Poisson distribution Blue bars denote a histogram of data divided into 1 sec bins. Red curve is a Poisson curve with rate = median count rate of data. |
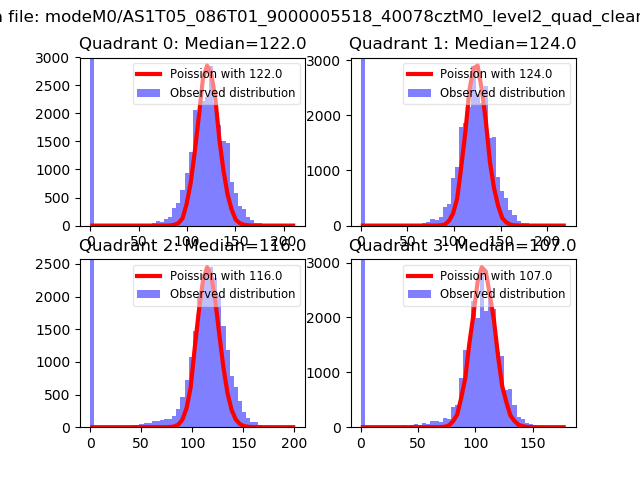 |
 |
| Quadrant-wise count rates Data is divided into 100 sec bins |
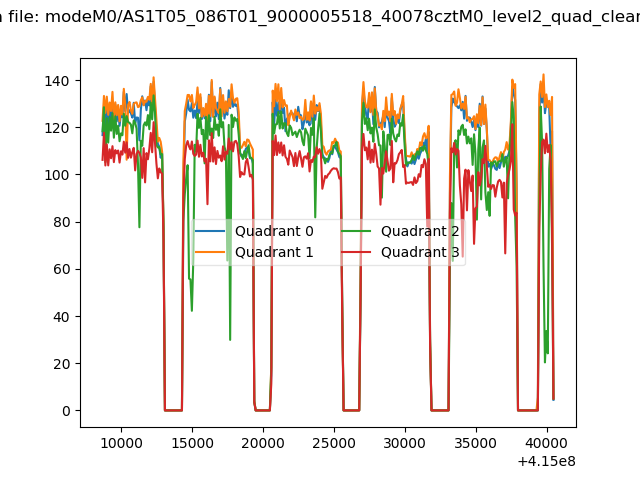 |
|
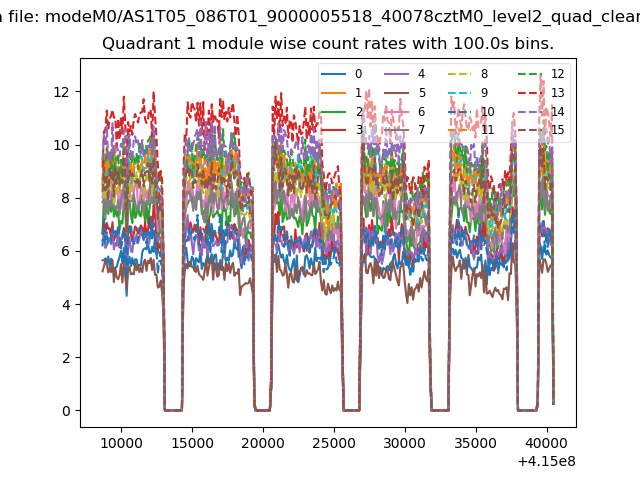
| Module-wise count rates for Quadrant A Data is divided into 100 sec bins |
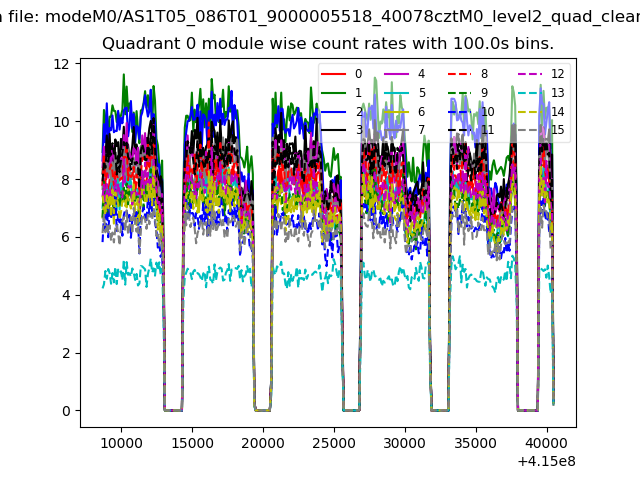 |
 |
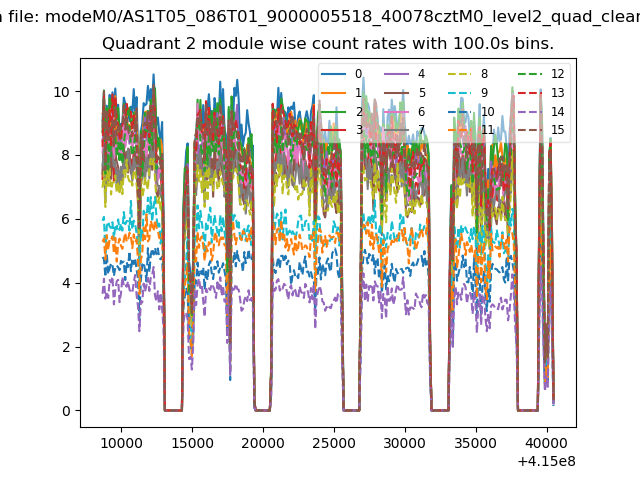
| Module-wise count rates for Quadrant B Data is divided into 100 sec bins |
 |
 |
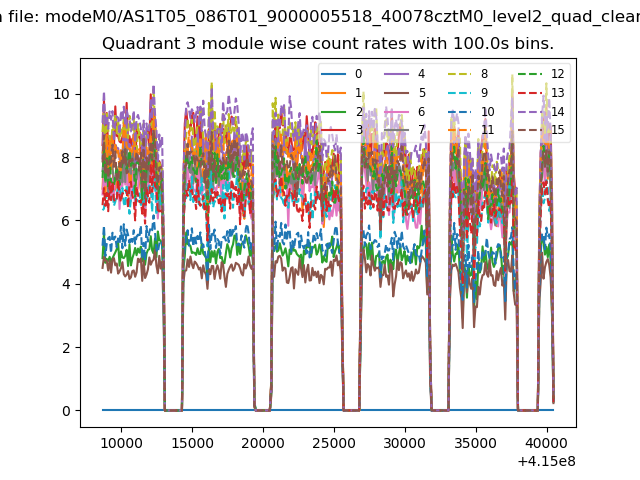
| Module-wise count rates for Quadrant C Data is divided into 100 sec bins |
 |
 |
| Module-wise count rates for Quadrant D Data is divided into 100 sec bins |
 |
 |
| Parameter | Plot |
|---|---|
| CZT HV Monitor | 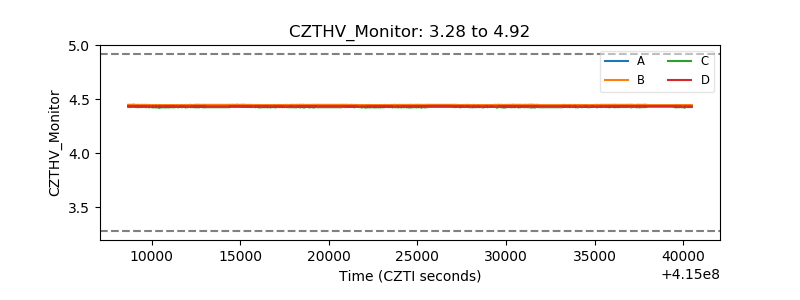 |
| D_VDD | 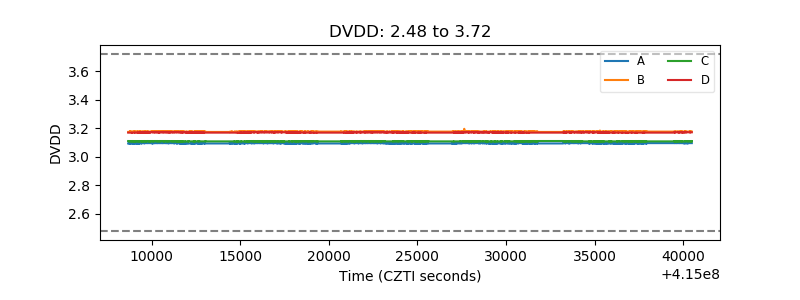 |
| Temperature 1 | 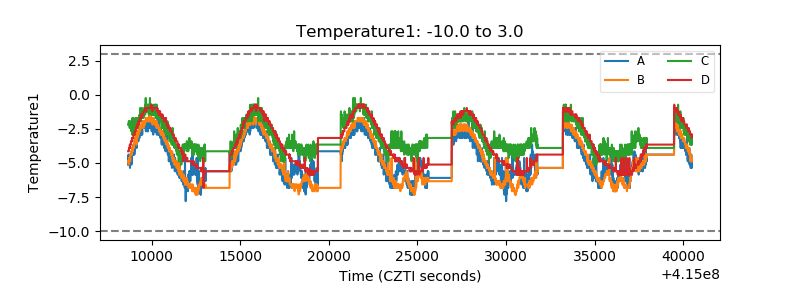 |
| Veto HV Monitor | 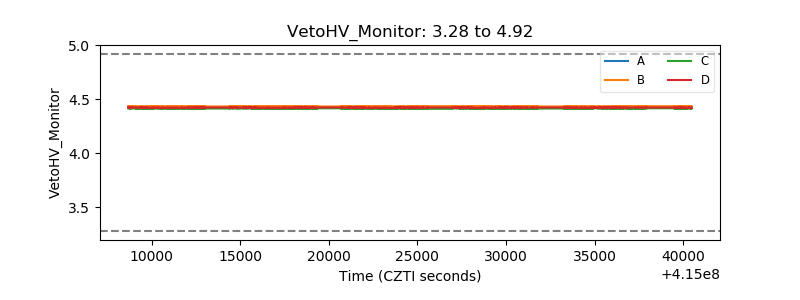 |
| Veto LLD | 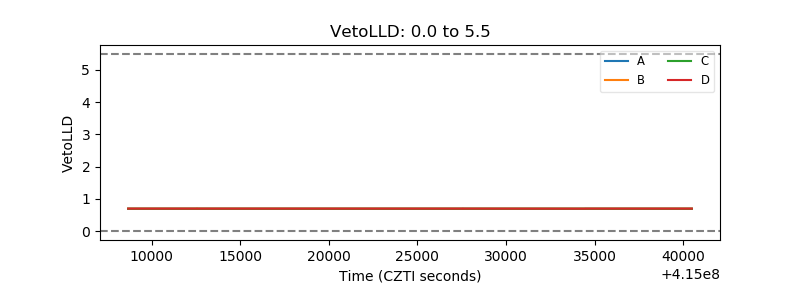 |
| Alpha Counter | 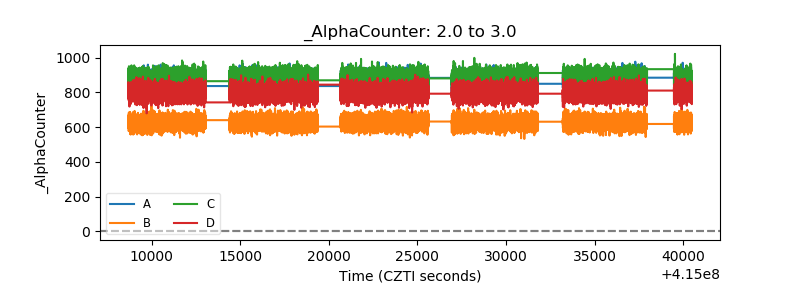 |
| _CPM_Rate | 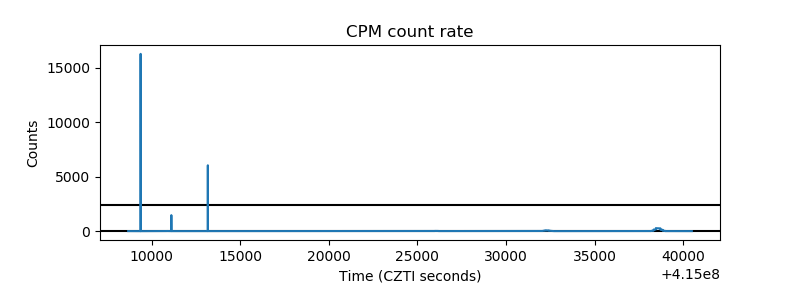 |
| CZT Counter | 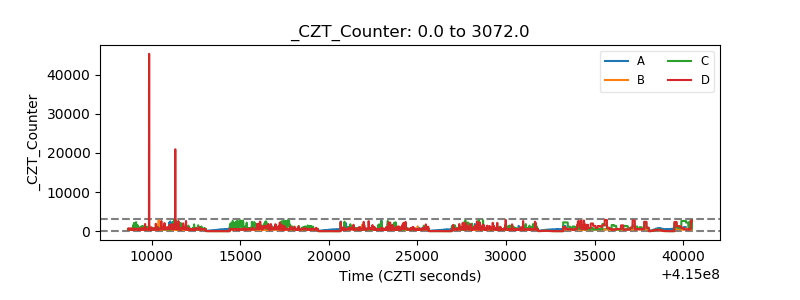 |
| +2.5 Volts monitor | 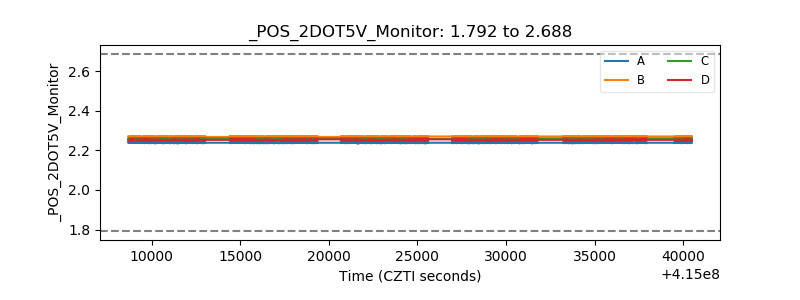 |
| +5 Volts monitor | 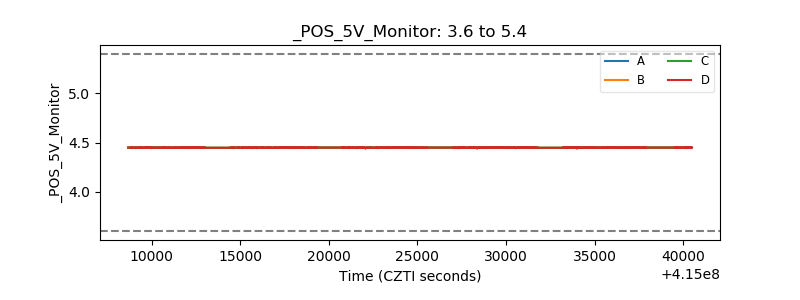 |
| _ROLL_ROT | 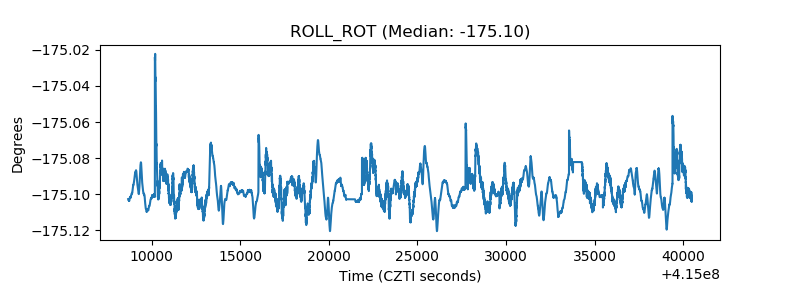 |
| _Roll_DEC | 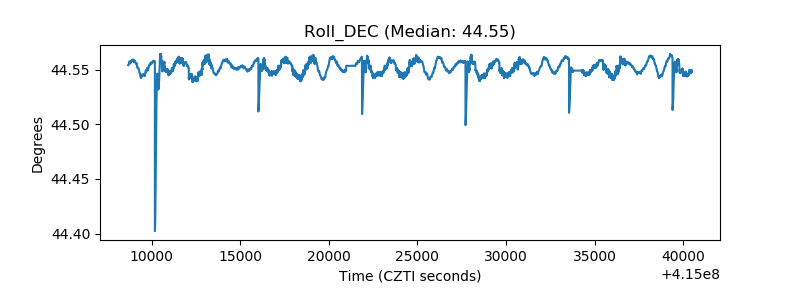 |
| _Roll_RA | 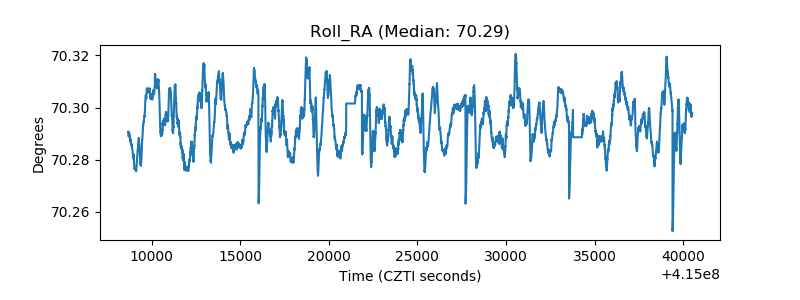 |
| Veto Counter | 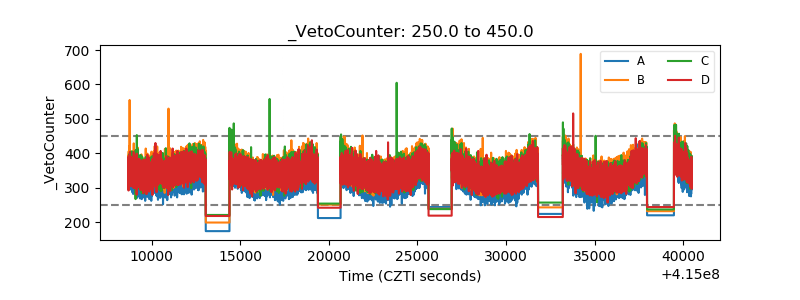 |