| Param | Original file | Final file |
|---|---|---|
| Filename | modeM0/AS1T05_086T01_9000005518_40079cztM0_level2.fits | modeM0/AS1T05_086T01_9000005518_40079cztM0_level2_quad_clean.evt |
| Size (bytes) | 458,141,760 | 92,024,640 |
| Size | 436.9 MB | 87.8 MB |
| Events in quadrant A | 3,258,879 | 654,696 |
| Events in quadrant B | 2,590,901 | 676,832 |
| Events in quadrant C | 5,934,113 | 558,997 |
| Events in quadrant D | 4,749,471 | 512,906 |
| Mode SS | |||
|---|---|---|---|
| Quadrant | BADHDUFLAG | Total packets | Discarded packets |
| A | 0 | 110 | 0 |
| B | 0 | 110 | 0 |
| C | 0 | 110 | 0 |
| D | 0 | 110 | 0 |
| Mode M0 | |||
|---|---|---|---|
| Quadrant | BADHDUFLAG | Total packets | Discarded packets |
| A | 0 | 13235 | 3 |
| B | 0 | 11331 | 2 |
| C | 0 | 21298 | 2 |
| D | 0 | 18036 | 2 |
| Mode M9 | |||
|---|---|---|---|
| Quadrant | BADHDUFLAG | Total packets | Discarded packets |
| A | 0 | 19 | 0 |
| B | 0 | 19 | 0 |
| C | 0 | 19 | 0 |
| D | 0 | 20 | 0 |
| Quadrant | Total seconds | Saturated seconds | Saturation percentage |
|---|---|---|---|
| A | 5475 | 93 | 1.698630% |
| B | 5475 | 6 | 0.109589% |
| C | 5475 | 850 | 15.525114% |
| D | 5475 | 794 | 14.502283% |
Noise dominated data is calculated using 1-second bins in cleaned event files. If a bin has >2000 counts, and if more than 50% of those come from <1% of pixels, then it is considered to be noise-dominated and hence unusable.
| Quadrant | # 1 sec bins | Bins with >0 counts | Bins with >2000 counts | High rate bins dominated by noise | Noise dominated (total time) | Noise dominated (detector-on time) | Marked lightcurve |
|---|---|---|---|---|---|---|---|
| A | 7116 | 5476 | 64 | 64 | 0.90% | 1.17% | 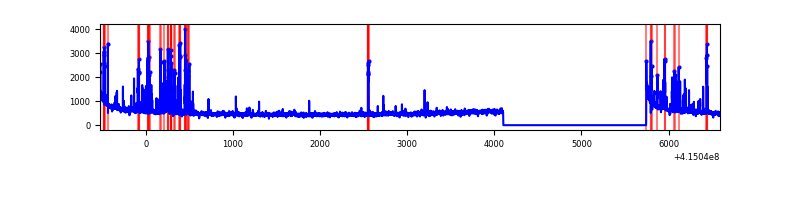 |
| B | 7116 | 5476 | 1 | 1 | 0.01% | 0.02% | 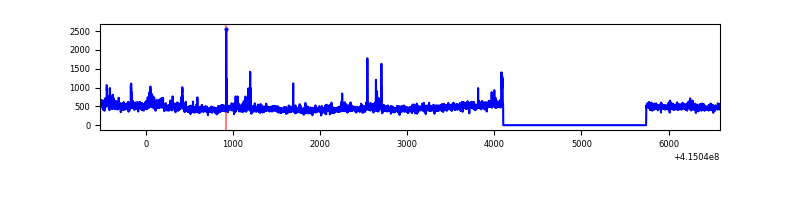 |
| C | 7115 | 5475 | 748 | 748 | 10.51% | 13.66% | 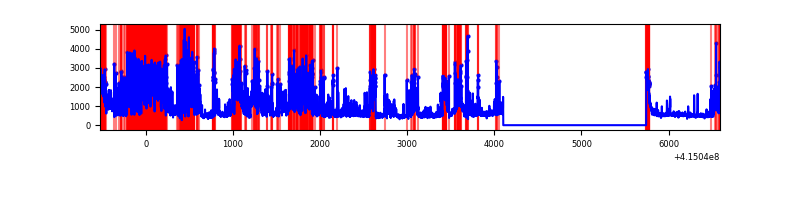 |
| D | 7116 | 5476 | 675 | 675 | 9.49% | 12.33% | 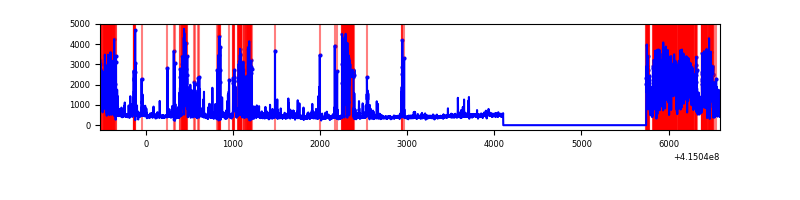 |
Top three noisy pixels from each quadrant. If the there are fewer than three noisy pixels in the level2.evt file, extra rows are filled as -1
| Pixel properties | Quadrant properties | ||||||
|---|---|---|---|---|---|---|---|
| Quadrant | DetID | PixID | Counts | Sigma | Mean | Median | Sigma |
| A | 10 | 83 | 476031 | 3833.07 | 601 | 591 | 124.0 |
| A | 13 | 248 | 349383 | 2812.01 | 601 | 591 | 124.0 |
| A | 2 | 79 | 68532 | 547.75 | 601 | 591 | 124.0 |
| B | 0 | 189 | 174038 | 1463.73 | 605 | 591 | 118.5 |
| B | 10 | 246 | 14165 | 114.55 | 605 | 591 | 118.5 |
| B | 12 | 111 | 13930 | 112.57 | 605 | 591 | 118.5 |
| C | 9 | 187 | 3103137 | 23282.64 | 560 | 565 | 133.3 |
| C | 15 | 214 | 214406 | 1604.73 | 560 | 565 | 133.3 |
| C | 10 | 20 | 208824 | 1562.84 | 560 | 565 | 133.3 |
| D | 1 | 47 | 1035549 | 7676.95 | 549 | 536 | 134.8 |
| D | 12 | 227 | 1005123 | 7451.28 | 549 | 536 | 134.8 |
| D | 2 | 250 | 169976 | 1256.78 | 549 | 536 | 134.8 |
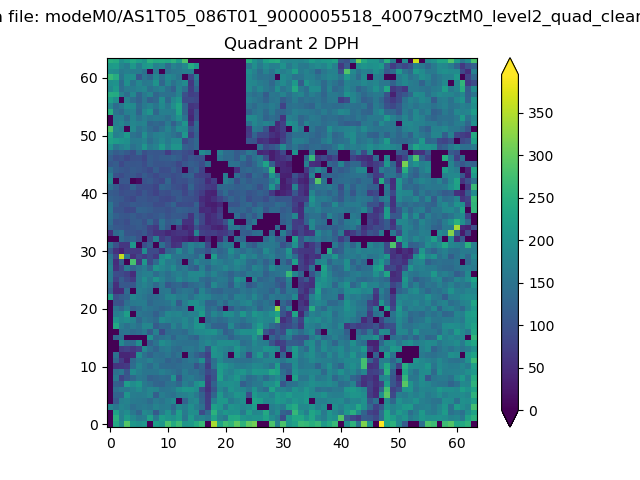
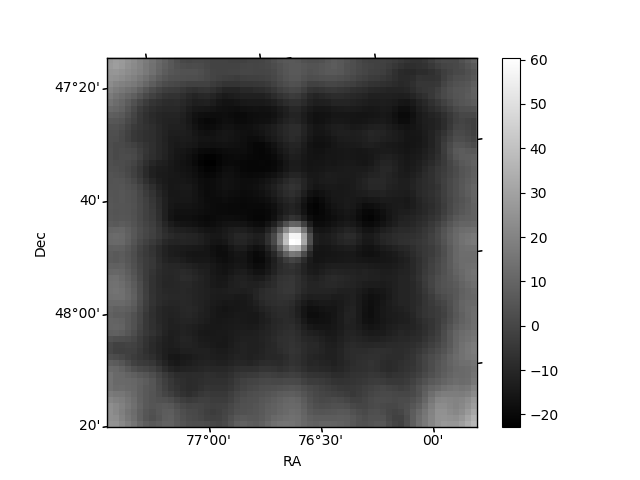
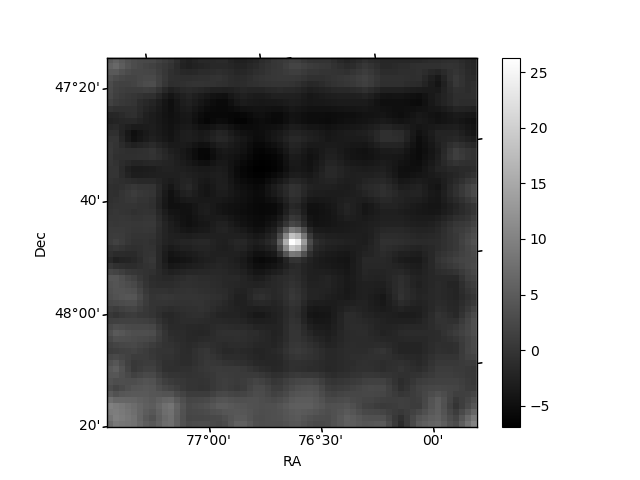
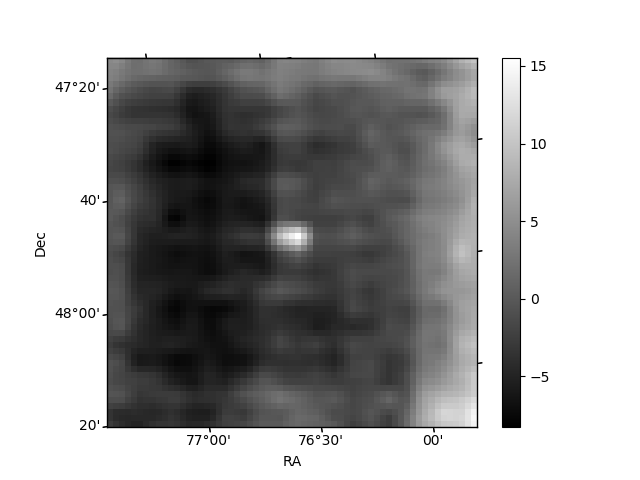
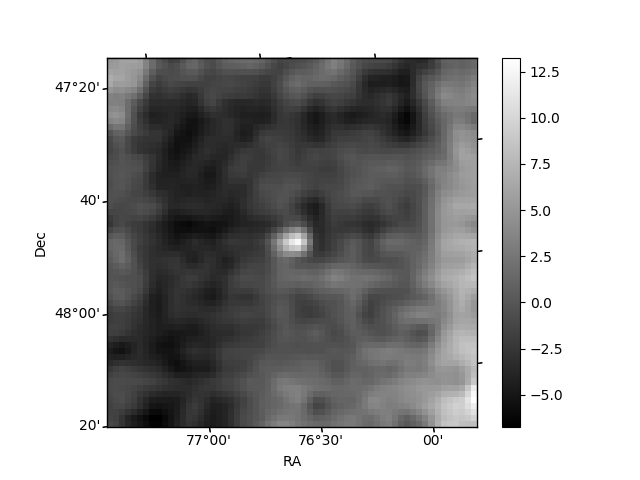
Histogram calculated using DETX and DETY for each event in the final _common_clean file
| Quadrant A | 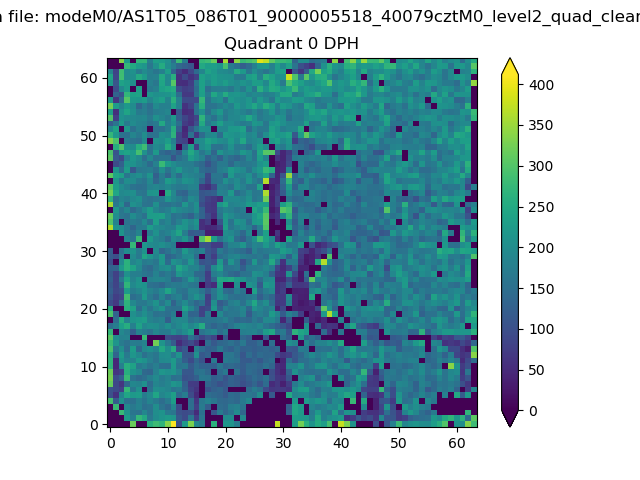 |
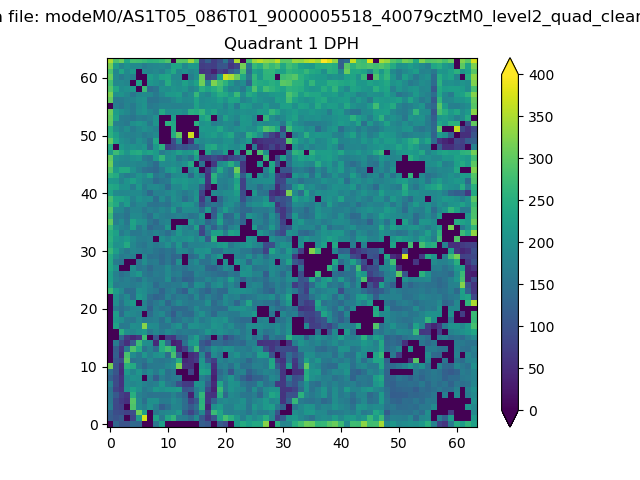 |
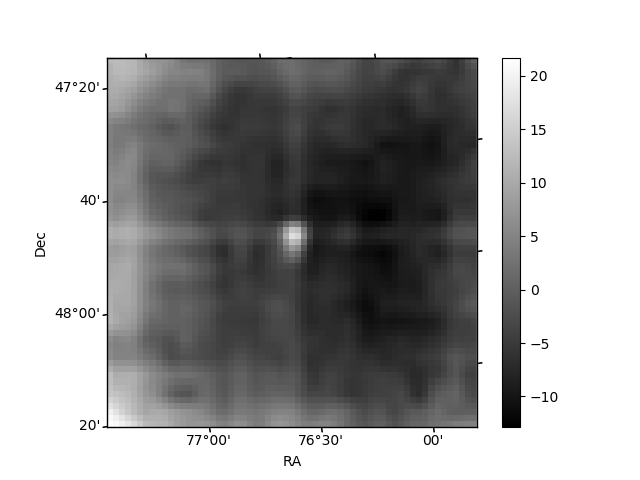
Quadrant B |
|---|---|---|---|
| Quadrant D | 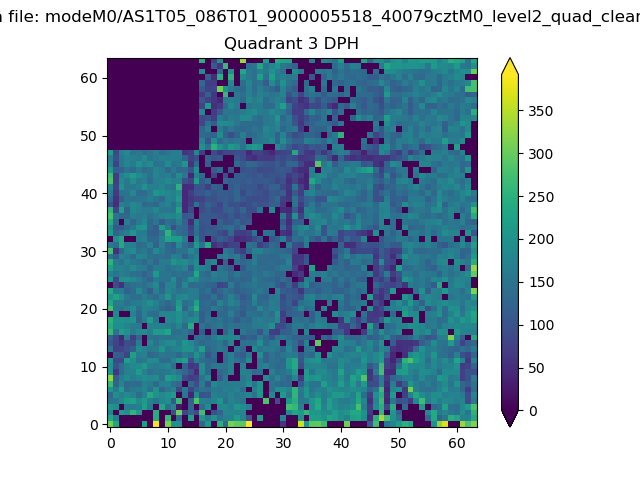 |
 |
Quadrant C |
| Plot type | Count rate plots | Images |
|---|---|---|
| Comparison with Poisson distribution Blue bars denote a histogram of data divided into 1 sec bins. Red curve is a Poisson curve with rate = median count rate of data. |
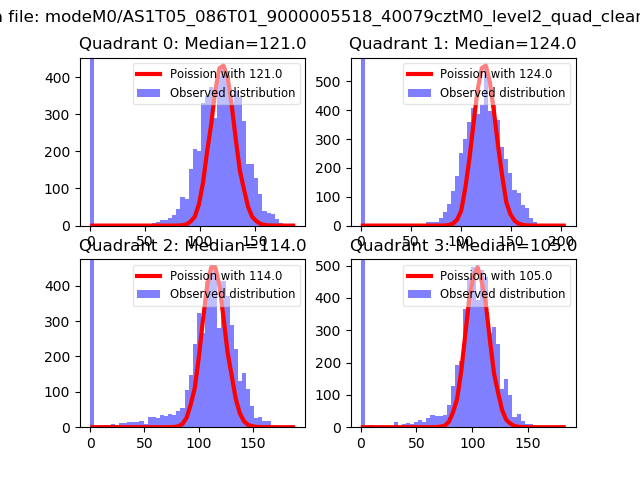 |
 |
| Quadrant-wise count rates Data is divided into 100 sec bins |
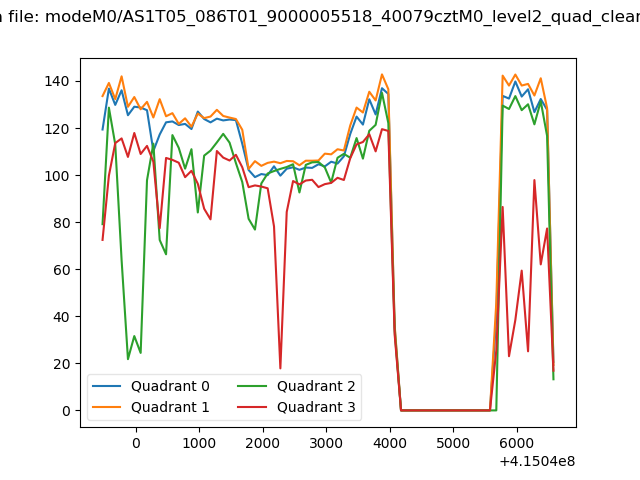 |
|
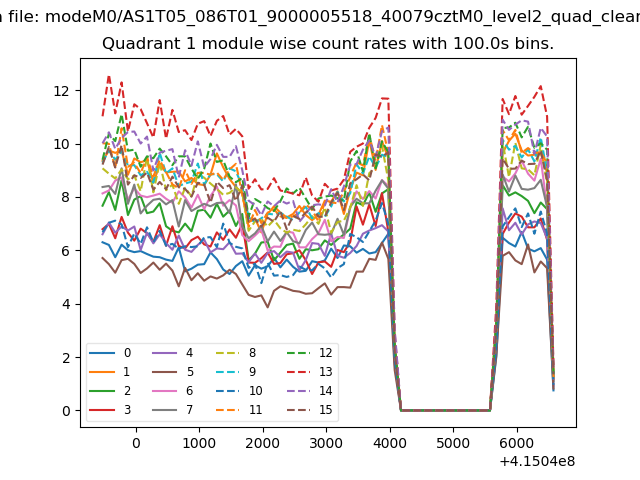
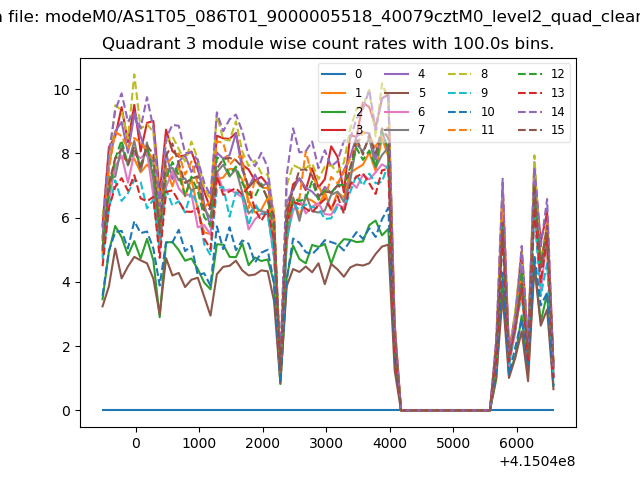
| Module-wise count rates for Quadrant A Data is divided into 100 sec bins |
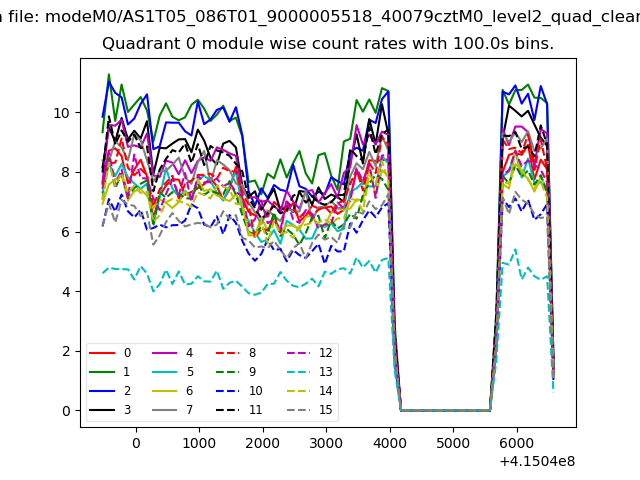 |
 |
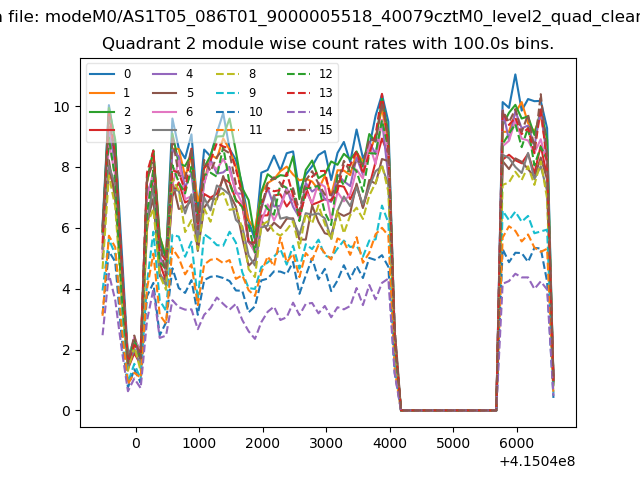
| Module-wise count rates for Quadrant B Data is divided into 100 sec bins |
 |
 |
| Module-wise count rates for Quadrant C Data is divided into 100 sec bins |
 |
 |
| Module-wise count rates for Quadrant D Data is divided into 100 sec bins |
 |
 |
| Parameter | Plot |
|---|---|
| CZT HV Monitor | 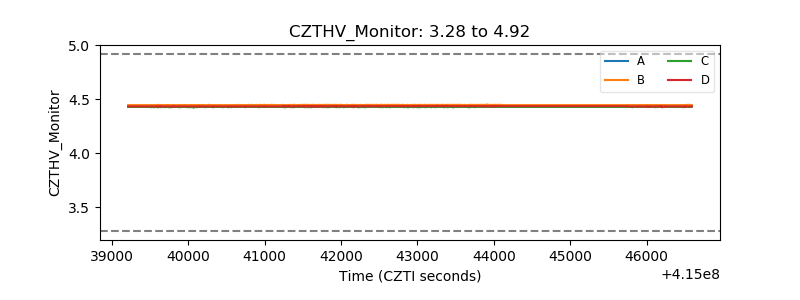 |
| D_VDD | 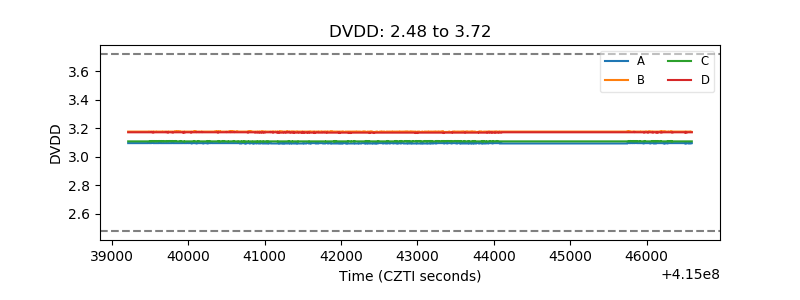 |
| Temperature 1 | 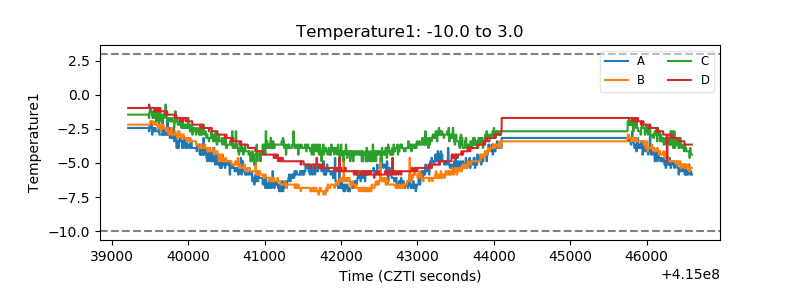 |
| Veto HV Monitor | 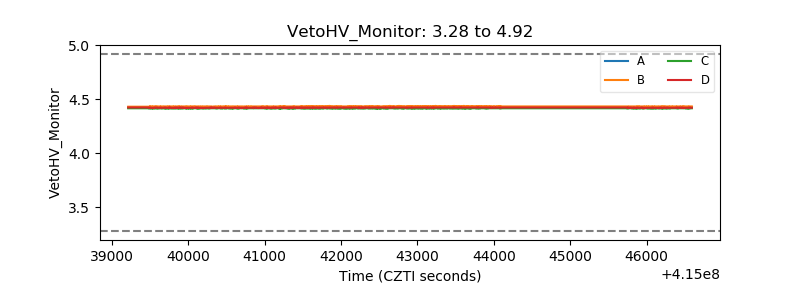 |
| Veto LLD | 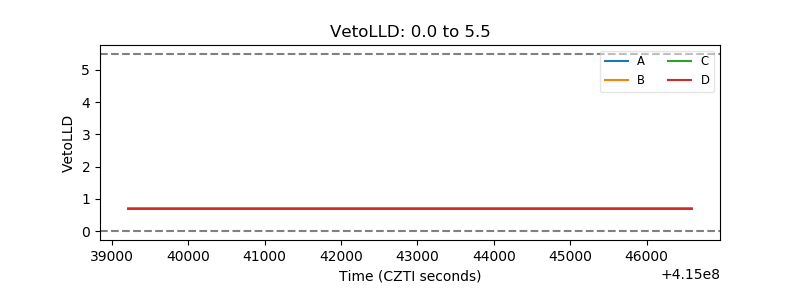 |
| Alpha Counter | 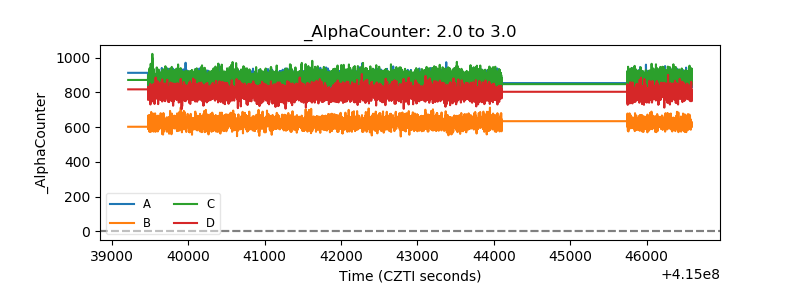 |
| _CPM_Rate | 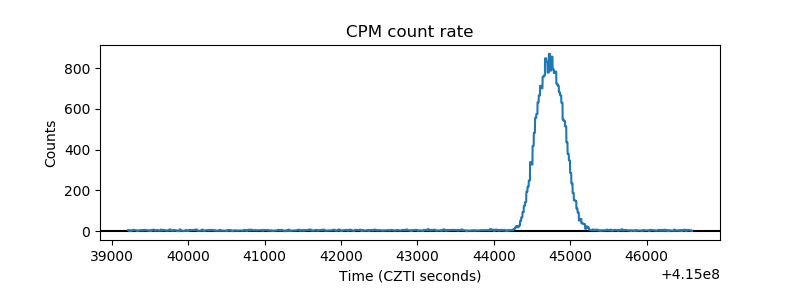 |
| CZT Counter | 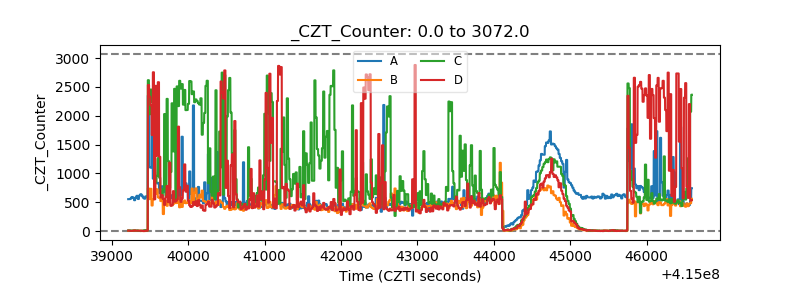 |
| +2.5 Volts monitor | 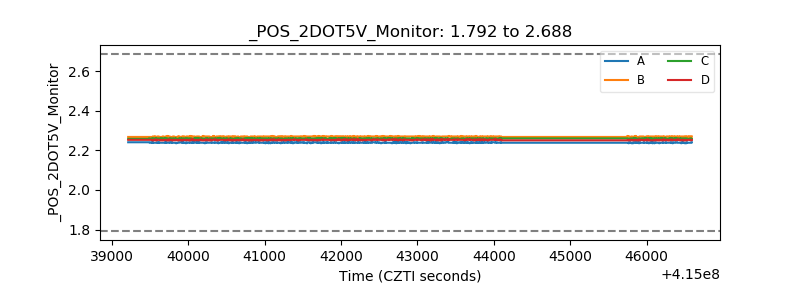 |
| +5 Volts monitor |  |
| _ROLL_ROT | 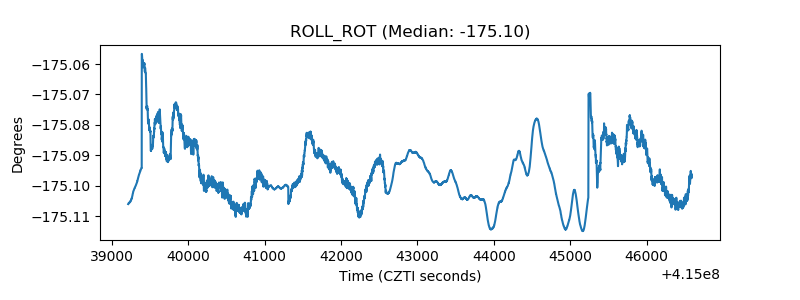 |
| _Roll_DEC | 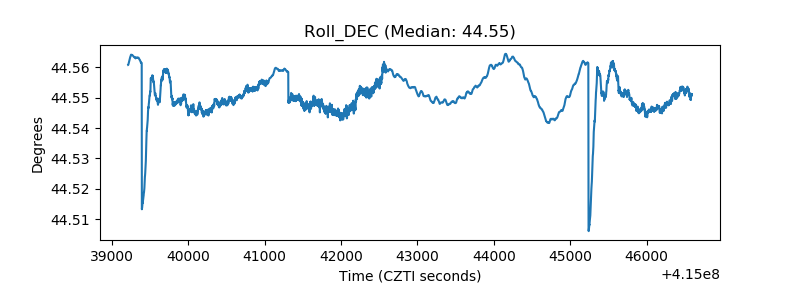 |
| _Roll_RA | 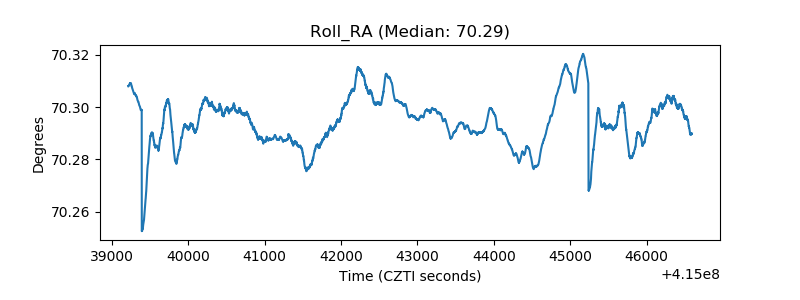 |
| Veto Counter | 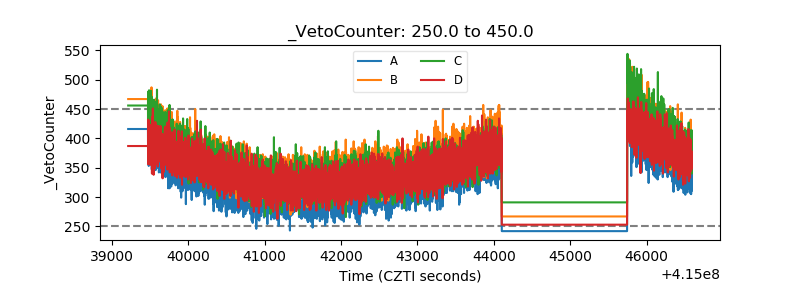 |