| Param | Original file | Final file |
|---|---|---|
| Filename | modeM0/AS1T05_086T01_9000005518_40081cztM0_level2.fits | modeM0/AS1T05_086T01_9000005518_40081cztM0_level2_quad_clean.evt |
| Size (bytes) | 445,006,080 | 93,052,800 |
| Size | 424.4 MB | 88.7 MB |
| Events in quadrant A | 3,019,284 | 666,563 |
| Events in quadrant B | 2,528,089 | 685,958 |
| Events in quadrant C | 5,693,727 | 566,390 |
| Events in quadrant D | 4,816,335 | 525,036 |
| Mode SS | |||
|---|---|---|---|
| Quadrant | BADHDUFLAG | Total packets | Discarded packets |
| A | 0 | 108 | 0 |
| B | 0 | 108 | 0 |
| C | 0 | 108 | 0 |
| D | 0 | 108 | 0 |
| Mode M0 | |||
|---|---|---|---|
| Quadrant | BADHDUFLAG | Total packets | Discarded packets |
| A | 0 | 12342 | 2 |
| B | 0 | 10958 | 1 |
| C | 0 | 20495 | 1 |
| D | 0 | 18111 | 1 |
| Mode M9 | |||
|---|---|---|---|
| Quadrant | BADHDUFLAG | Total packets | Discarded packets |
| A | 0 | 24 | 0 |
| B | 0 | 24 | 0 |
| C | 0 | 24 | 0 |
| D | 0 | 25 | 0 |
| Quadrant | Total seconds | Saturated seconds | Saturation percentage |
|---|---|---|---|
| A | 5341 | 46 | 0.861262% |
| B | 5341 | 6 | 0.112339% |
| C | 5341 | 814 | 15.240592% |
| D | 5341 | 687 | 12.862760% |
Noise dominated data is calculated using 1-second bins in cleaned event files. If a bin has >2000 counts, and if more than 50% of those come from <1% of pixels, then it is considered to be noise-dominated and hence unusable.
| Quadrant | # 1 sec bins | Bins with >0 counts | Bins with >2000 counts | High rate bins dominated by noise | Noise dominated (total time) | Noise dominated (detector-on time) | Marked lightcurve |
|---|---|---|---|---|---|---|---|
| A | 7133 | 5342 | 29 | 29 | 0.41% | 0.54% | 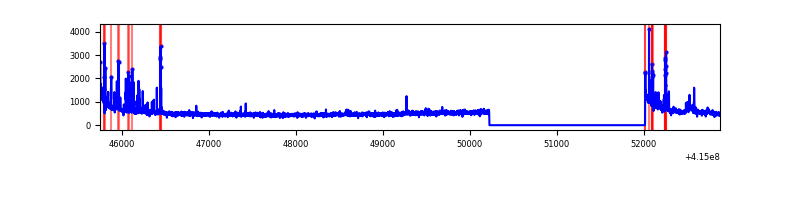 |
| B | 7133 | 5342 | 0 | 0 | 0.00% | 0.00% | 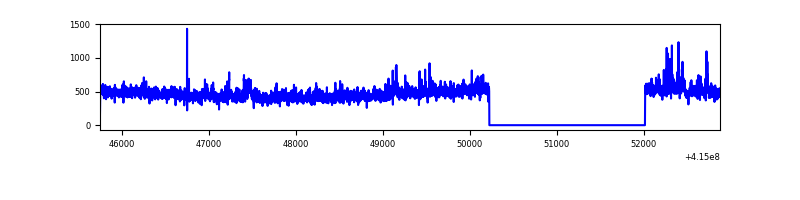 |
| C | 7133 | 5342 | 768 | 768 | 10.77% | 14.38% | 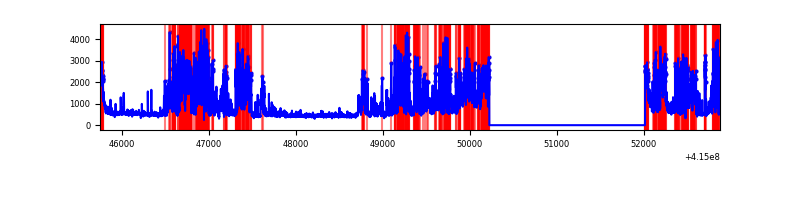 |
| D | 7133 | 5342 | 597 | 597 | 8.37% | 11.18% | 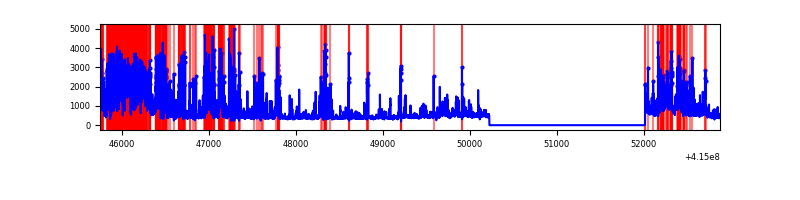 |
Top three noisy pixels from each quadrant. If the there are fewer than three noisy pixels in the level2.evt file, extra rows are filled as -1
| Pixel properties | Quadrant properties | ||||||
|---|---|---|---|---|---|---|---|
| Quadrant | DetID | PixID | Counts | Sigma | Mean | Median | Sigma |
| A | 10 | 83 | 460218 | 3708.22 | 595 | 586 | 123.9 |
| A | 13 | 248 | 166907 | 1341.84 | 595 | 586 | 123.9 |
| A | 2 | 79 | 38064 | 302.36 | 595 | 586 | 123.9 |
| B | 0 | 189 | 156512 | 1337.53 | 599 | 584 | 116.6 |
| B | 0 | 230 | 23113 | 193.25 | 599 | 584 | 116.6 |
| B | 12 | 111 | 13844 | 113.74 | 599 | 584 | 116.6 |
| C | 9 | 187 | 3093834 | 23364.09 | 558 | 563 | 132.4 |
| C | 15 | 214 | 211901 | 1596.28 | 558 | 563 | 132.4 |
| C | 0 | 10 | 160965 | 1211.55 | 558 | 563 | 132.4 |
| D | 1 | 47 | 1243679 | 9161.09 | 549 | 535 | 135.7 |
| D | 12 | 227 | 727578 | 5357.79 | 549 | 535 | 135.7 |
| D | 2 | 250 | 283275 | 2083.59 | 549 | 535 | 135.7 |
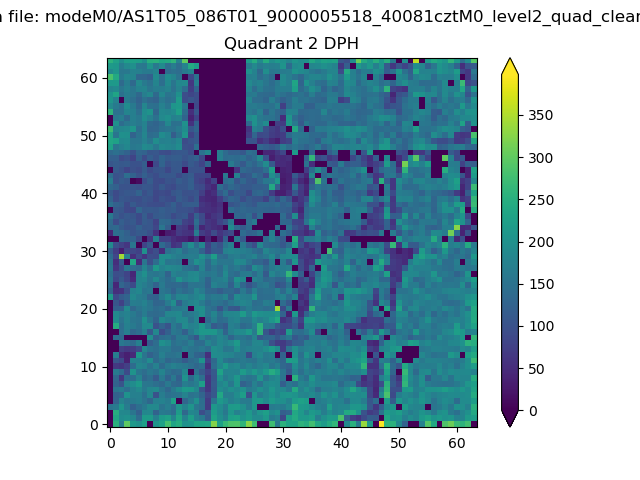
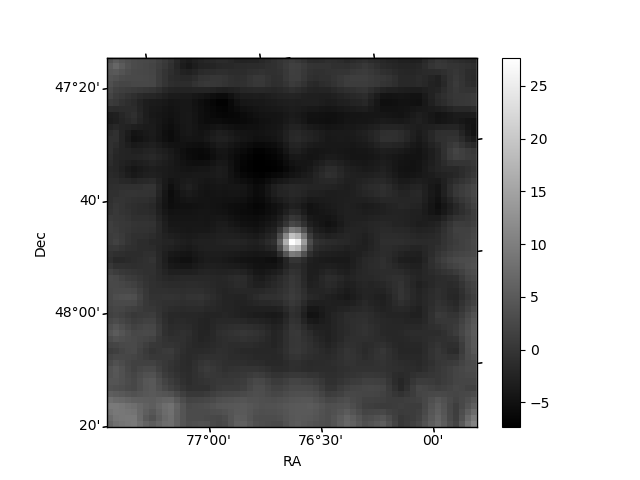
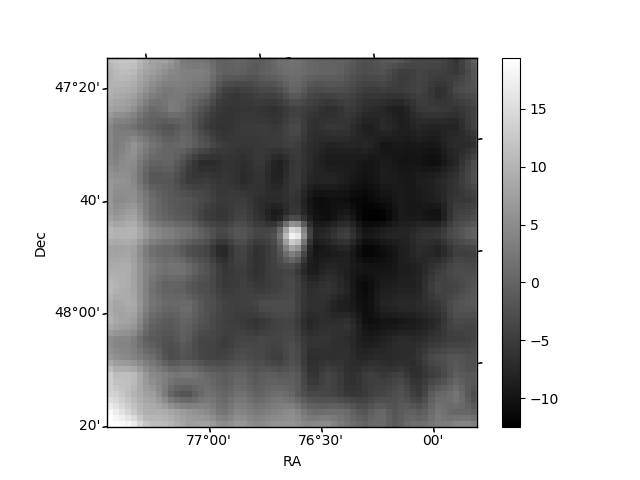
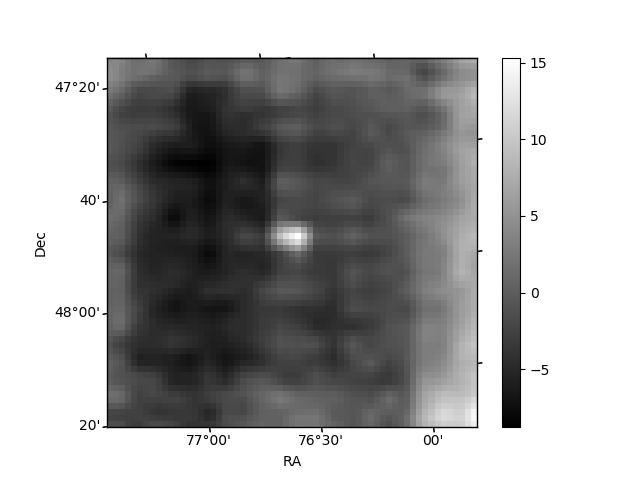
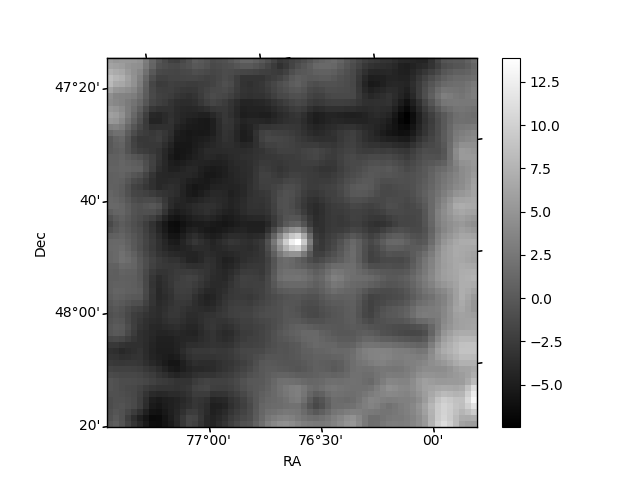
Histogram calculated using DETX and DETY for each event in the final _common_clean file
| Quadrant A | 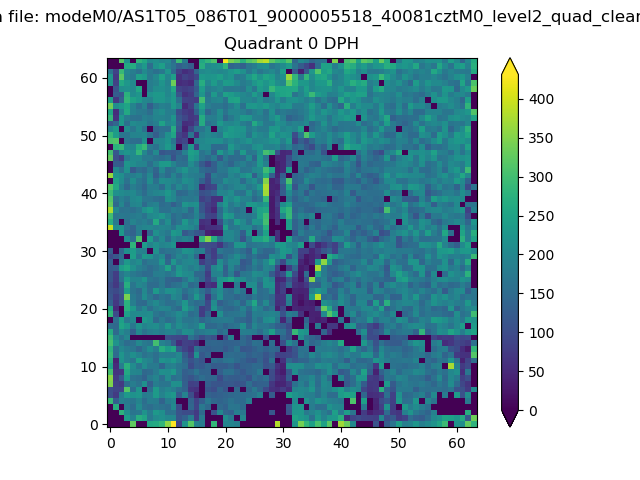 |
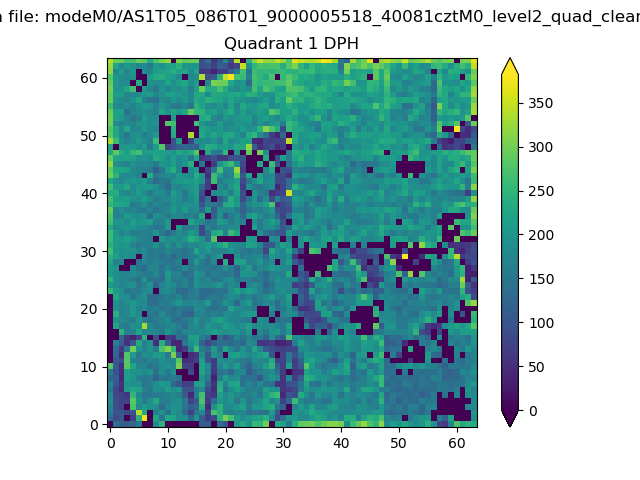 |
Quadrant B |
|---|---|---|---|
| Quadrant D | 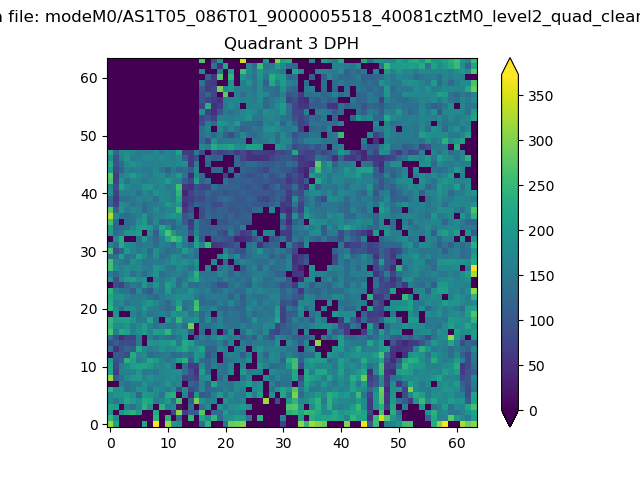 |
 |
Quadrant C |
| Plot type | Count rate plots | Images |
|---|---|---|
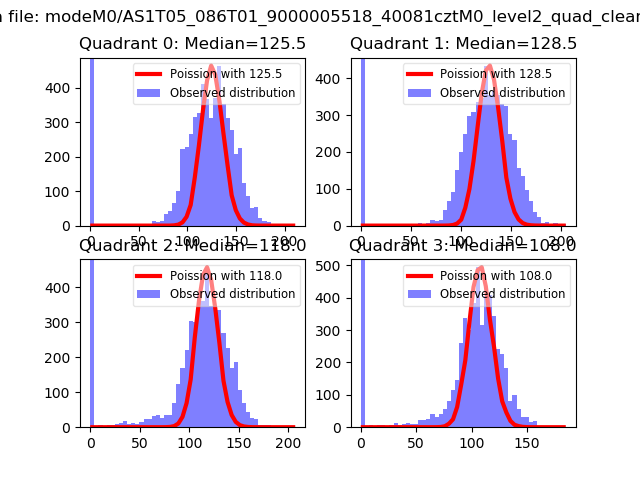
| Comparison with Poisson distribution Blue bars denote a histogram of data divided into 1 sec bins. Red curve is a Poisson curve with rate = median count rate of data. |
 |
 |
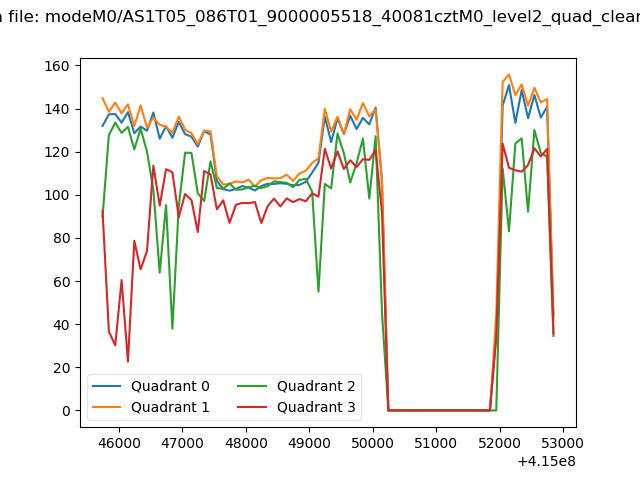
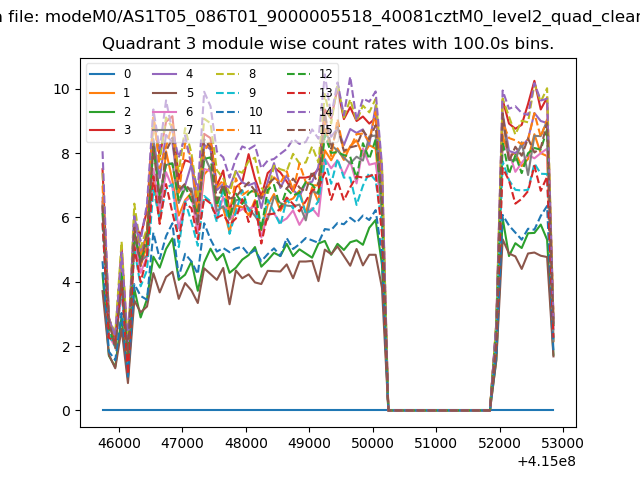
| Quadrant-wise count rates Data is divided into 100 sec bins |
 |
|
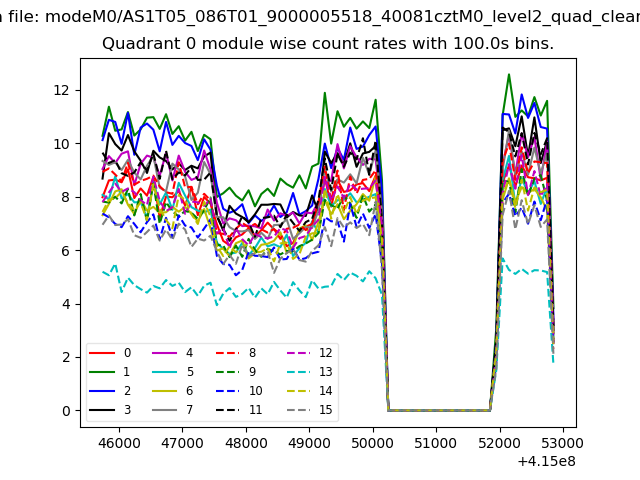
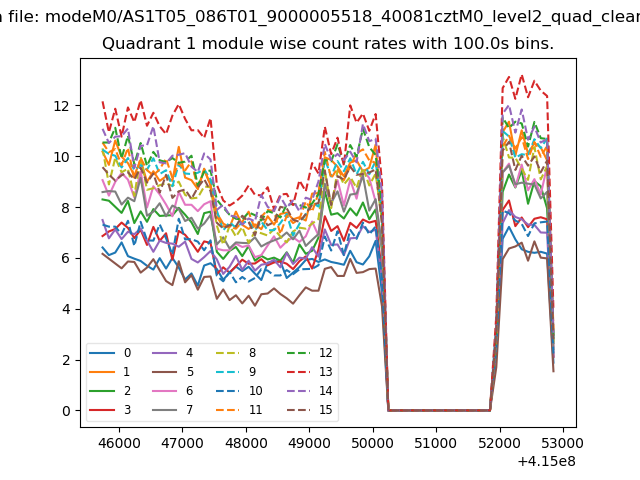
| Module-wise count rates for Quadrant A Data is divided into 100 sec bins |
 |
 |
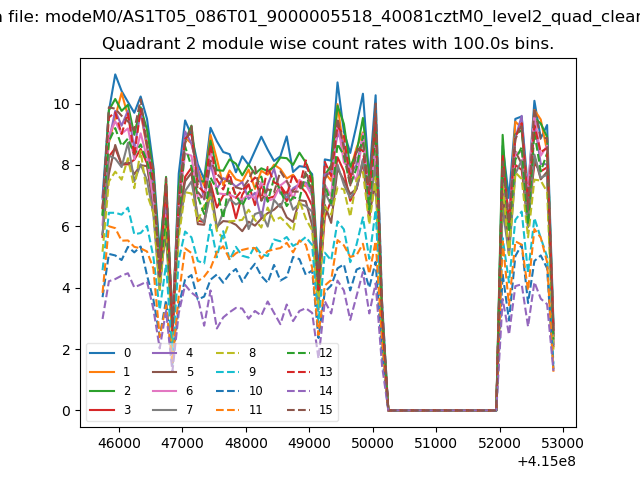
| Module-wise count rates for Quadrant B Data is divided into 100 sec bins |
 |
 |
| Module-wise count rates for Quadrant C Data is divided into 100 sec bins |
 |
 |
| Module-wise count rates for Quadrant D Data is divided into 100 sec bins |
 |
 |
| Parameter | Plot |
|---|---|
| CZT HV Monitor | 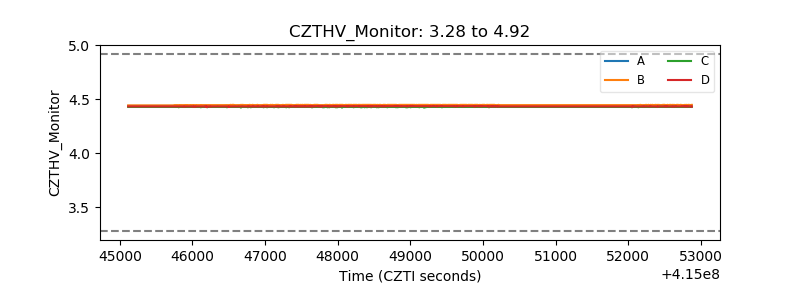 |
| D_VDD | 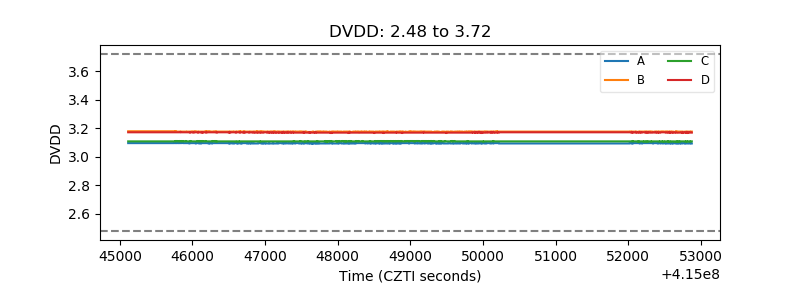 |
| Temperature 1 | 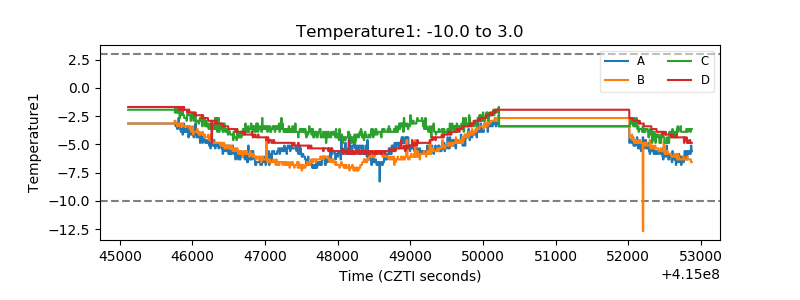 |
| Veto HV Monitor | 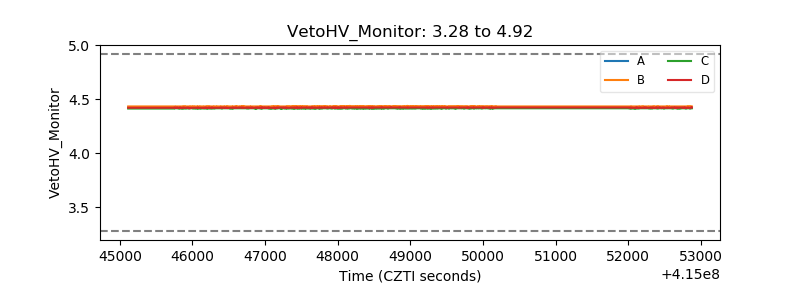 |
| Veto LLD | 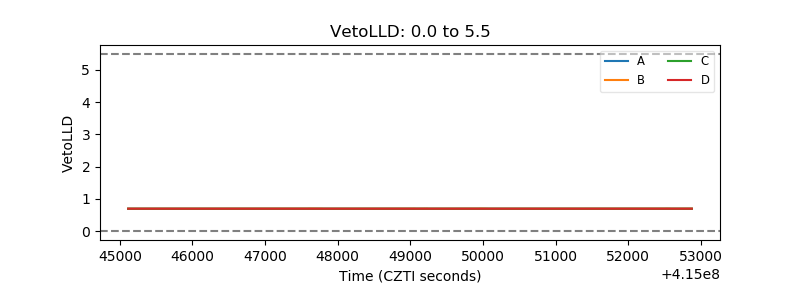 |
| Alpha Counter | 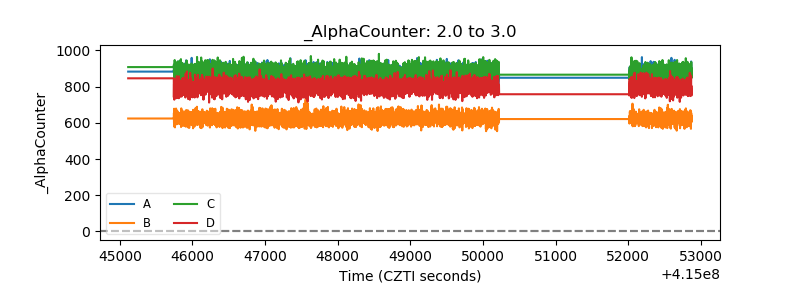 |
| _CPM_Rate | 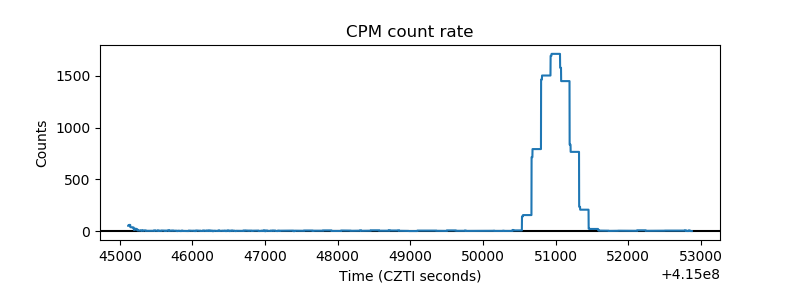 |
| CZT Counter | 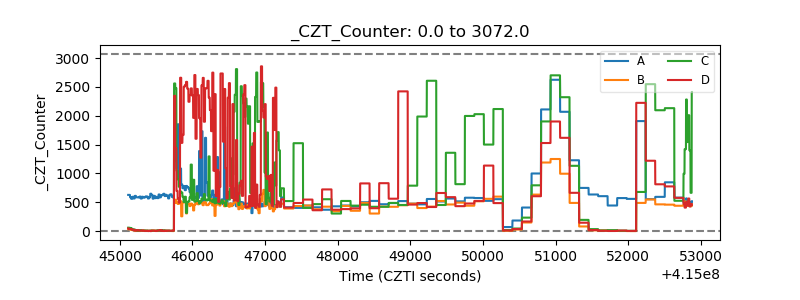 |
| +2.5 Volts monitor | 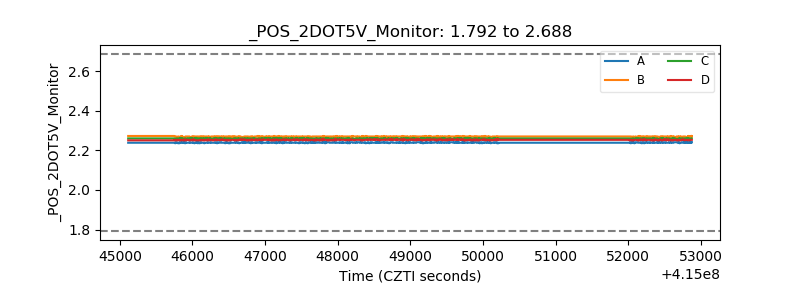 |
| +5 Volts monitor | 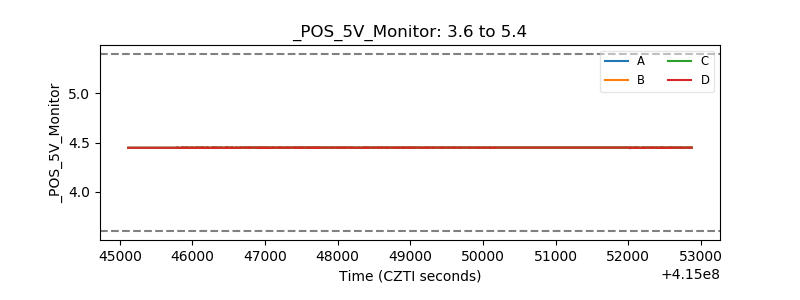 |
| _ROLL_ROT | 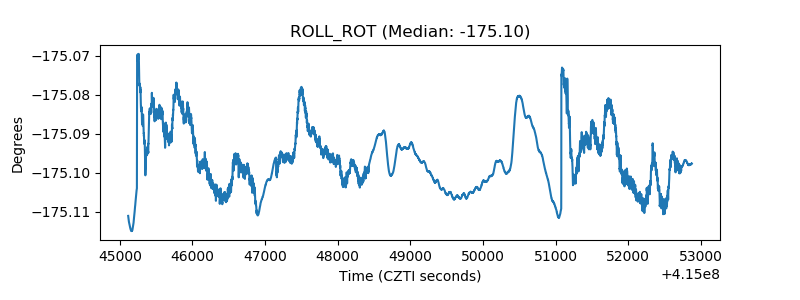 |
| _Roll_DEC | 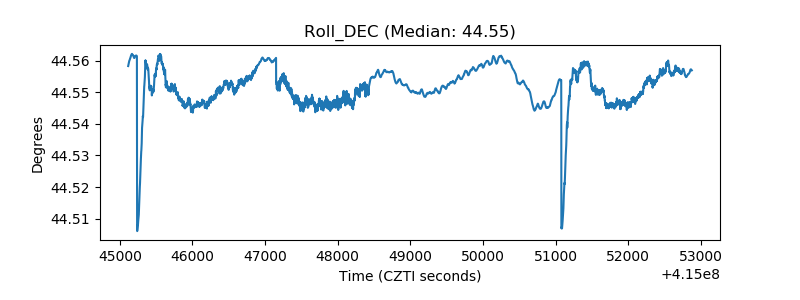 |
| _Roll_RA | 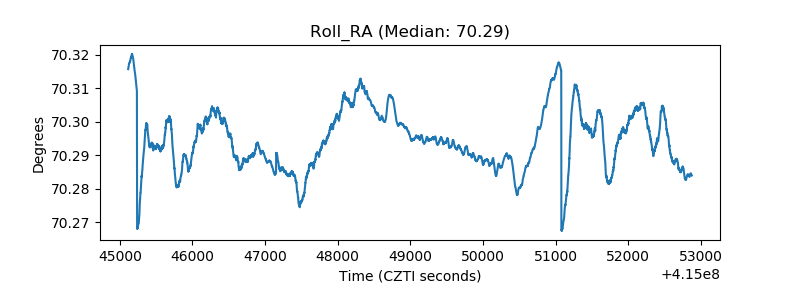 |
| Veto Counter | 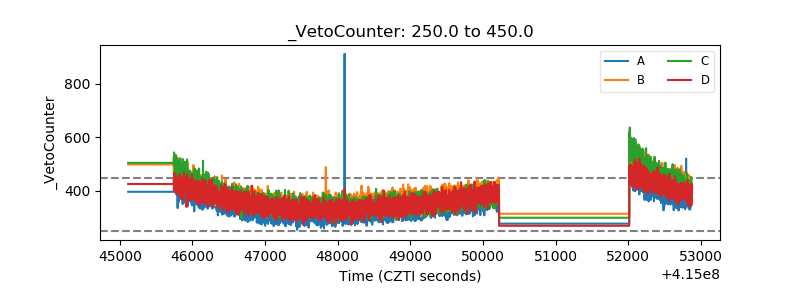 |