| Param | Original file | Final file |
|---|---|---|
| Filename | modeM0/AS1T05_086T01_9000005518_40082cztM0_level2.fits | modeM0/AS1T05_086T01_9000005518_40082cztM0_level2_quad_clean.evt |
| Size (bytes) | 417,067,200 | 93,715,200 |
| Size | 397.7 MB | 89.4 MB |
| Events in quadrant A | 2,844,569 | 662,750 |
| Events in quadrant B | 2,528,050 | 689,668 |
| Events in quadrant C | 5,974,860 | 547,056 |
| Events in quadrant D | 3,687,623 | 574,905 |
| Mode SS | |||
|---|---|---|---|
| Quadrant | BADHDUFLAG | Total packets | Discarded packets |
| A | 0 | 106 | 0 |
| B | 0 | 106 | 0 |
| C | 0 | 106 | 0 |
| D | 0 | 106 | 0 |
| Mode M0 | |||
|---|---|---|---|
| Quadrant | BADHDUFLAG | Total packets | Discarded packets |
| A | 0 | 11679 | 2 |
| B | 0 | 10877 | 1 |
| C | 0 | 21289 | 1 |
| D | 0 | 14569 | 1 |
| Mode M9 | |||
|---|---|---|---|
| Quadrant | BADHDUFLAG | Total packets | Discarded packets |
| A | 0 | 31 | 0 |
| B | 0 | 31 | 0 |
| C | 0 | 31 | 0 |
| D | 0 | 32 | 0 |
| Quadrant | Total seconds | Saturated seconds | Saturation percentage |
|---|---|---|---|
| A | 5188 | 28 | 0.539707% |
| B | 5188 | 9 | 0.173477% |
| C | 5188 | 972 | 18.735544% |
| D | 5188 | 183 | 3.527371% |
Noise dominated data is calculated using 1-second bins in cleaned event files. If a bin has >2000 counts, and if more than 50% of those come from <1% of pixels, then it is considered to be noise-dominated and hence unusable.
| Quadrant | # 1 sec bins | Bins with >0 counts | Bins with >2000 counts | High rate bins dominated by noise | Noise dominated (total time) | Noise dominated (detector-on time) | Marked lightcurve |
|---|---|---|---|---|---|---|---|
| A | 7101 | 5189 | 18 | 18 | 0.25% | 0.35% | 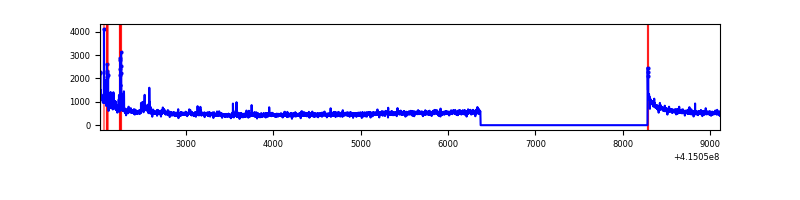 |
| B | 7101 | 5189 | 5 | 5 | 0.07% | 0.10% | 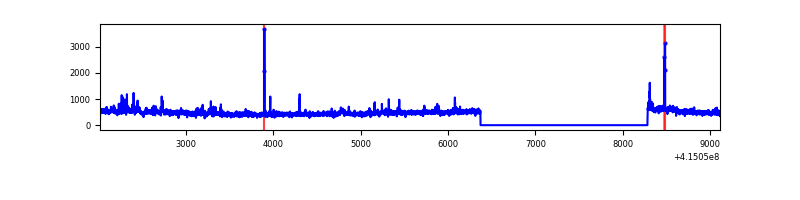 |
| C | 7101 | 5189 | 861 | 861 | 12.13% | 16.59% | 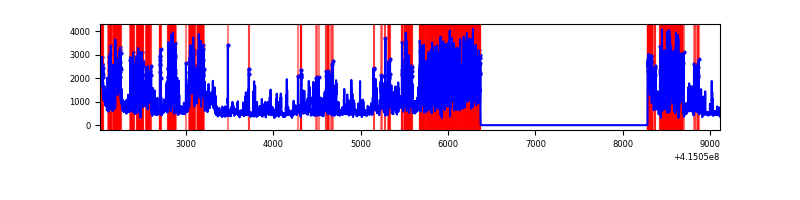 |
| D | 7101 | 5189 | 165 | 165 | 2.32% | 3.18% | 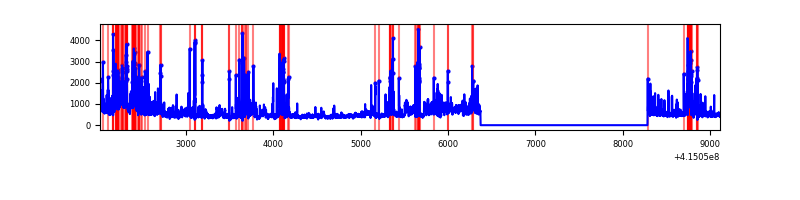 |
Top three noisy pixels from each quadrant. If the there are fewer than three noisy pixels in the level2.evt file, extra rows are filled as -1
| Pixel properties | Quadrant properties | ||||||
|---|---|---|---|---|---|---|---|
| Quadrant | DetID | PixID | Counts | Sigma | Mean | Median | Sigma |
| A | 10 | 83 | 441768 | 3653.84 | 587 | 579 | 120.7 |
| A | 13 | 248 | 65499 | 537.66 | 587 | 579 | 120.7 |
| A | 15 | 223 | 35273 | 287.33 | 587 | 579 | 120.7 |
| B | 0 | 189 | 150161 | 1299.38 | 594 | 579 | 115.1 |
| B | 0 | 230 | 24788 | 210.3 | 594 | 579 | 115.1 |
| B | 4 | 200 | 21541 | 182.09 | 594 | 579 | 115.1 |
| C | 9 | 187 | 3493983 | 27287.51 | 540 | 547 | 128.0 |
| C | 15 | 214 | 202772 | 1579.6 | 540 | 547 | 128.0 |
| C | 0 | 10 | 135386 | 1053.24 | 540 | 547 | 128.0 |
| D | 12 | 227 | 649176 | 4622.23 | 565 | 550 | 140.3 |
| D | 1 | 47 | 336392 | 2393.27 | 565 | 550 | 140.3 |
| D | 2 | 250 | 212831 | 1512.75 | 565 | 550 | 140.3 |
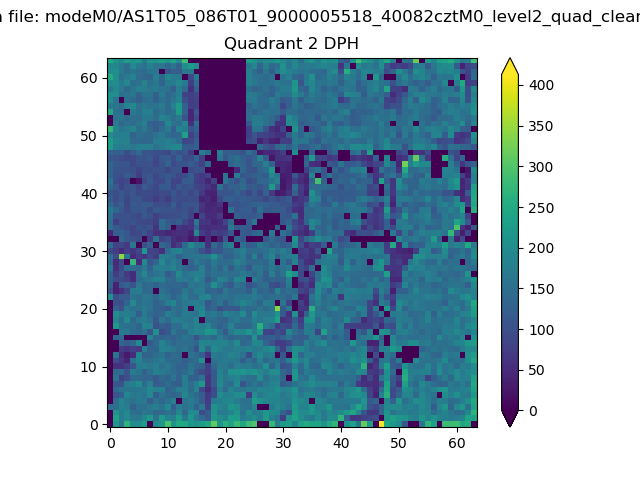
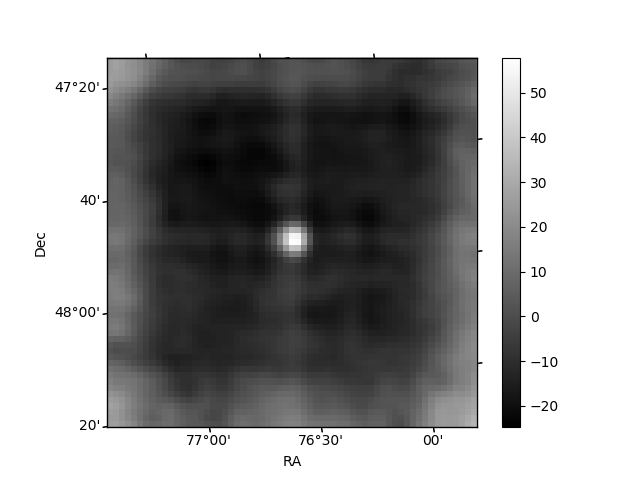
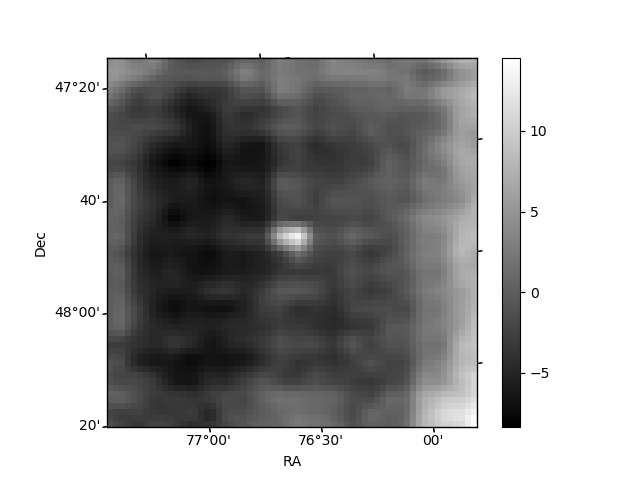
Histogram calculated using DETX and DETY for each event in the final _common_clean file
| Quadrant A | 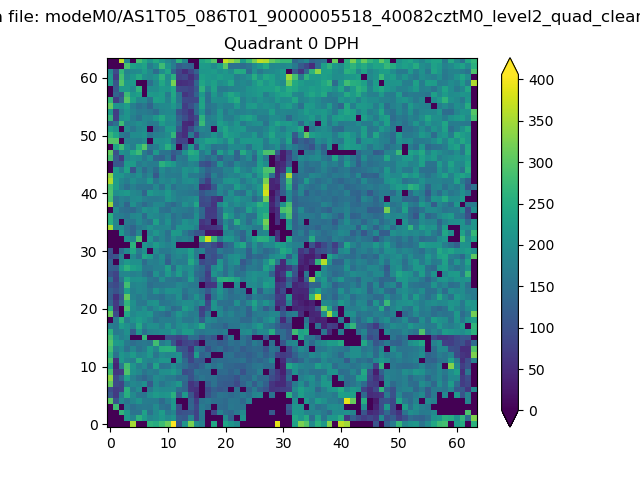 |
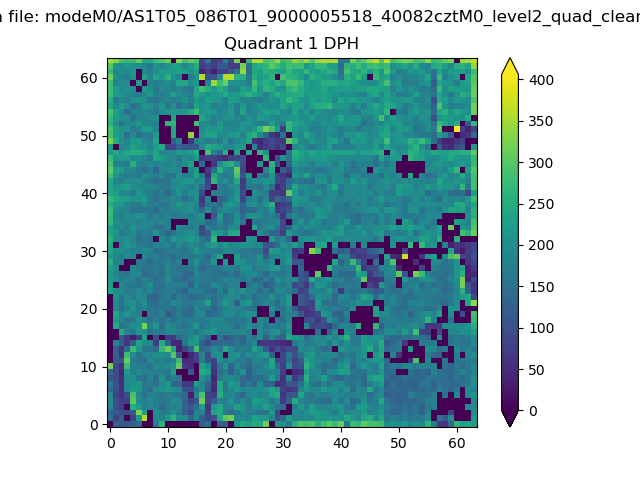 |
Quadrant B |
|---|---|---|---|
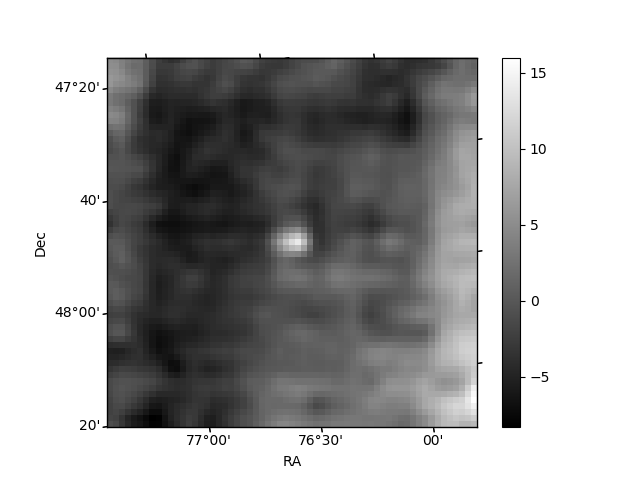
| Quadrant D | 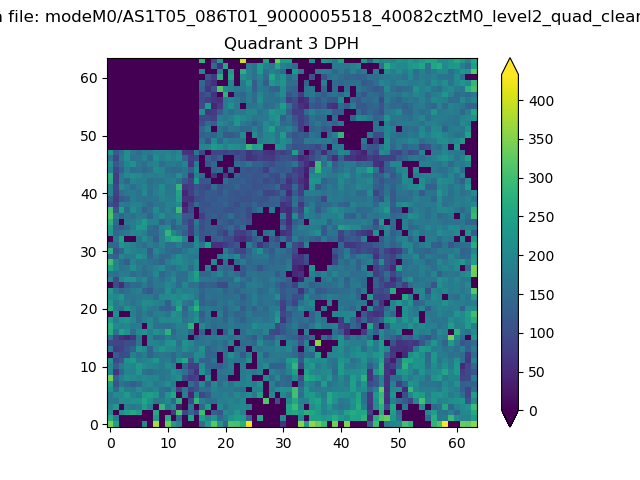 |
 |
Quadrant C |
| Plot type | Count rate plots | Images |
|---|---|---|
| Comparison with Poisson distribution Blue bars denote a histogram of data divided into 1 sec bins. Red curve is a Poisson curve with rate = median count rate of data. |
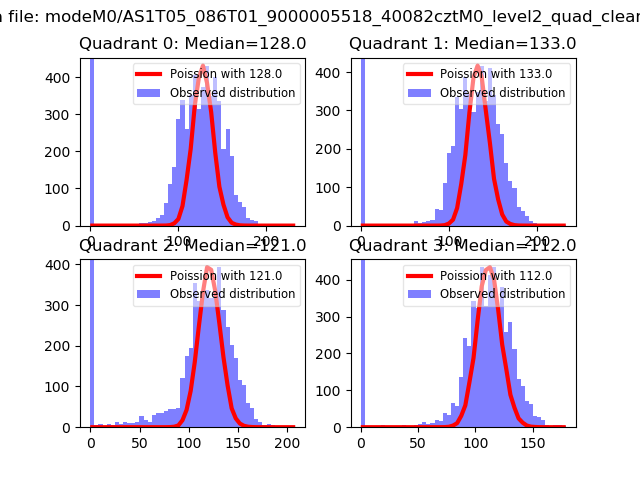 |
 |
| Quadrant-wise count rates Data is divided into 100 sec bins |
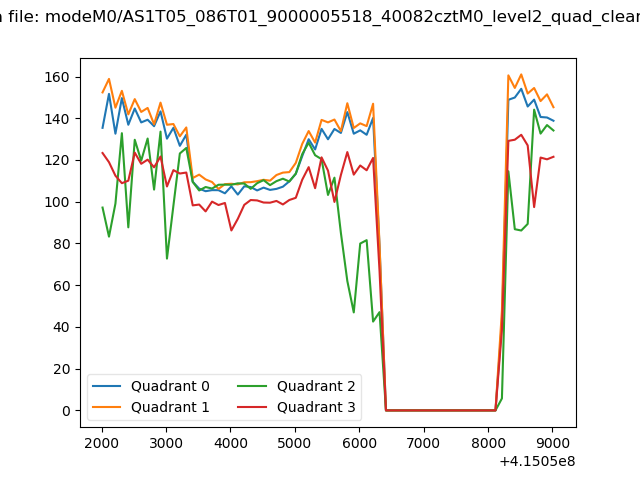 |
|
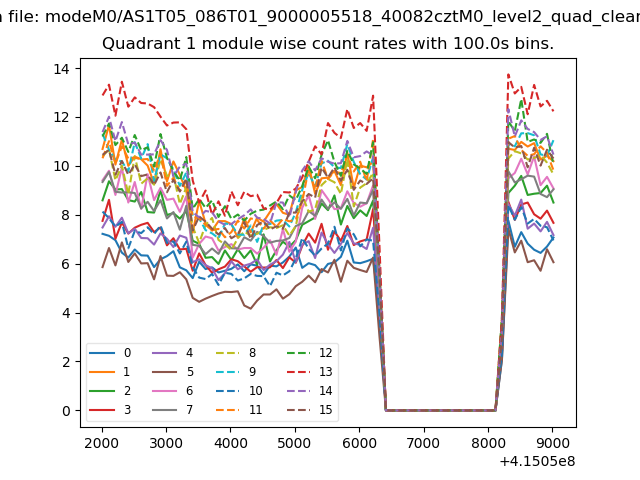
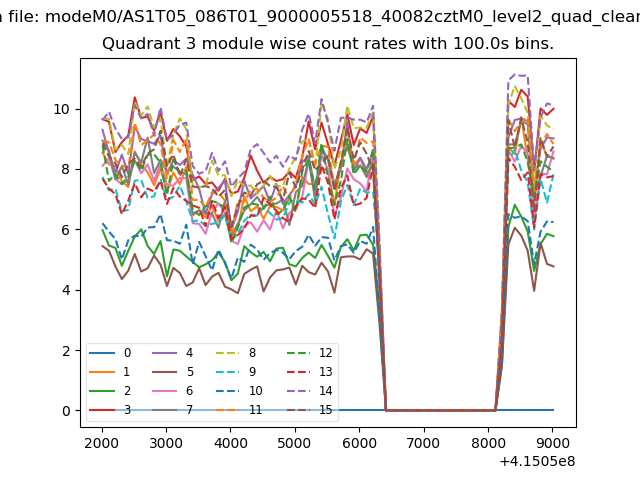
| Module-wise count rates for Quadrant A Data is divided into 100 sec bins |
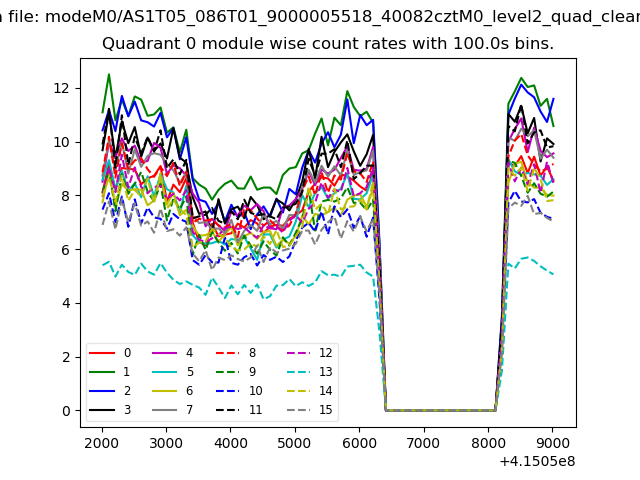 |
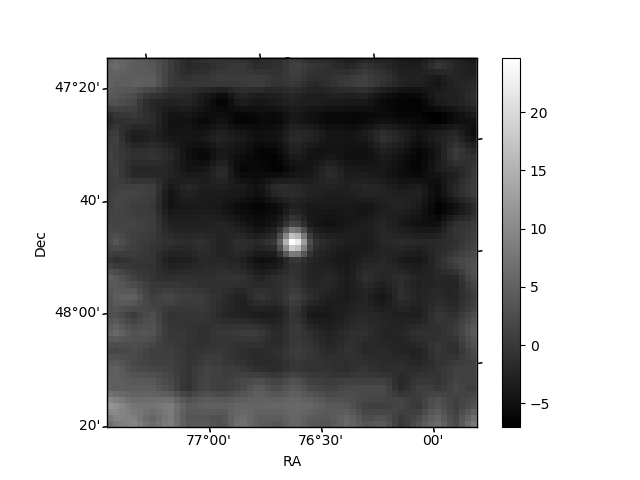 |
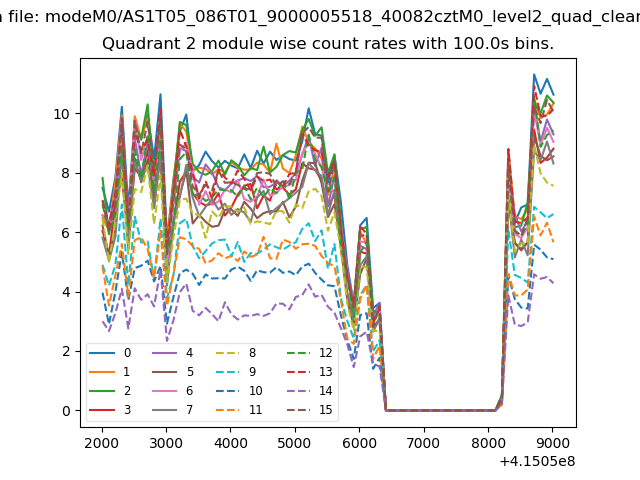
| Module-wise count rates for Quadrant B Data is divided into 100 sec bins |
 |
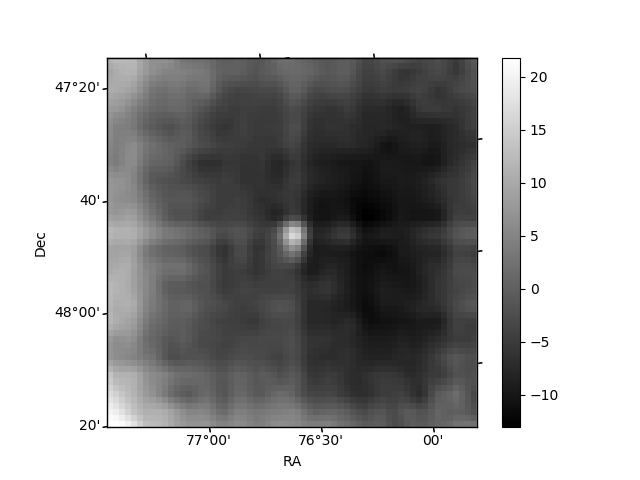 |
| Module-wise count rates for Quadrant C Data is divided into 100 sec bins |
 |
 |
| Module-wise count rates for Quadrant D Data is divided into 100 sec bins |
 |
 |
| Parameter | Plot |
|---|---|
| CZT HV Monitor | 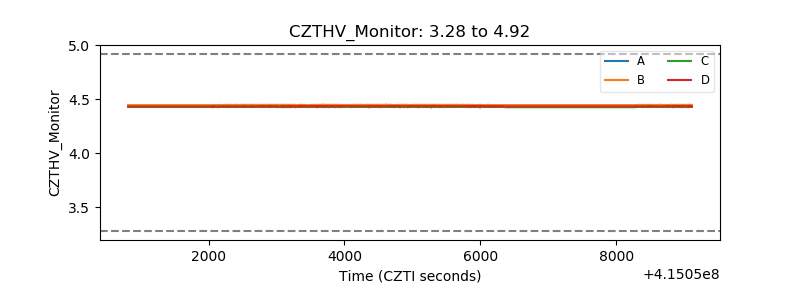 |
| D_VDD | 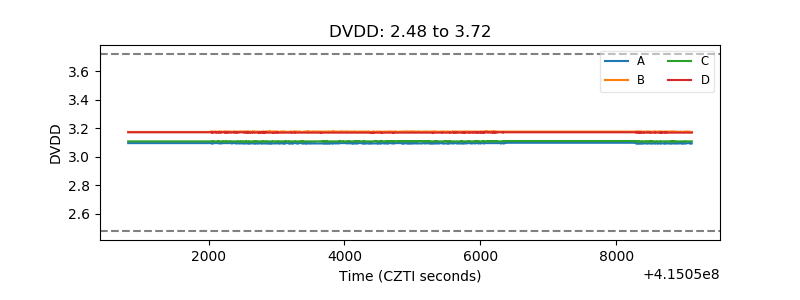 |
| Temperature 1 | 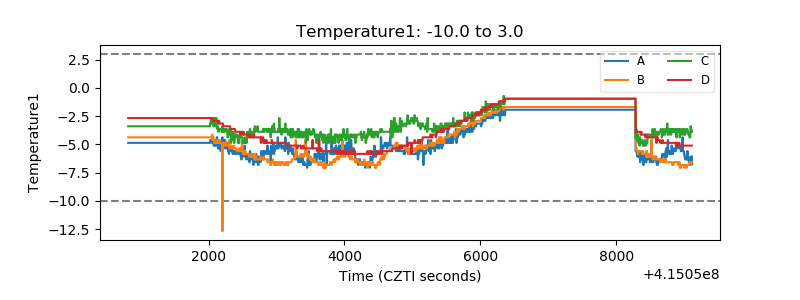 |
| Veto HV Monitor | 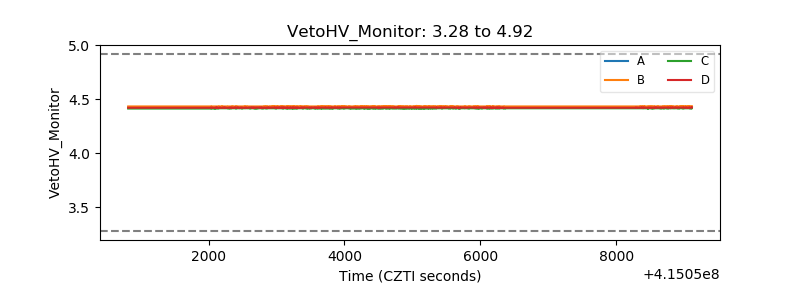 |
| Veto LLD | 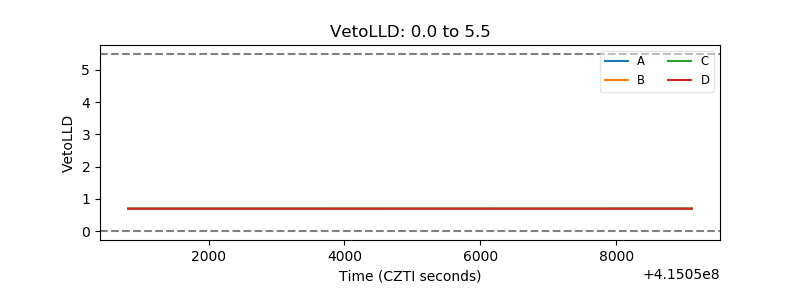 |
| Alpha Counter |  |
| _CPM_Rate | 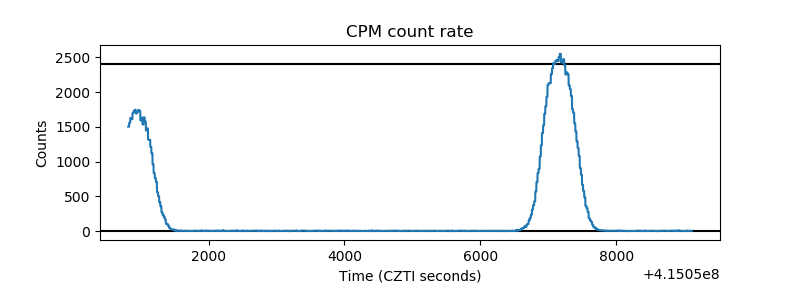 |
| CZT Counter | 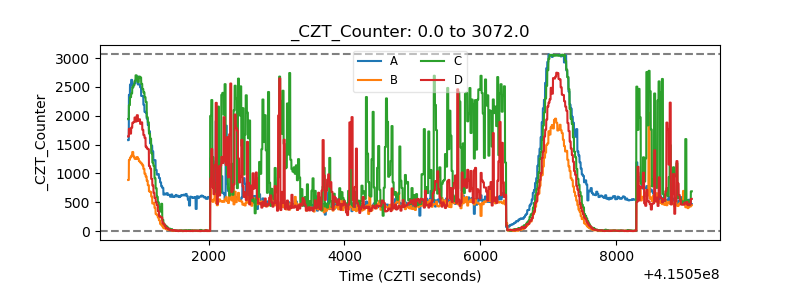 |
| +2.5 Volts monitor | 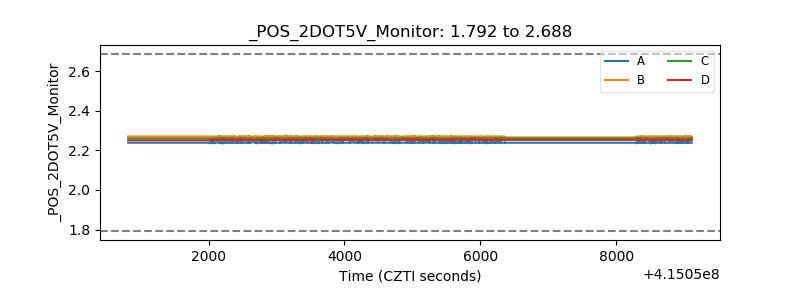 |
| +5 Volts monitor | 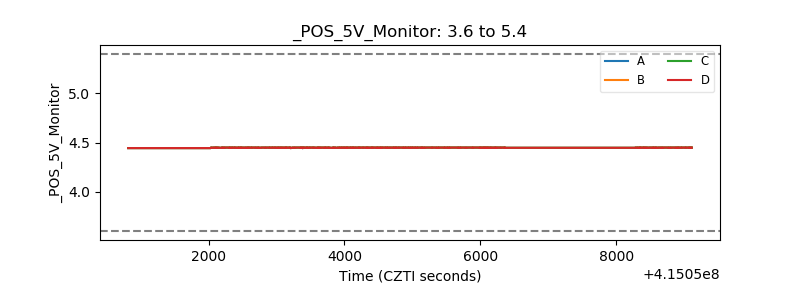 |
| _ROLL_ROT | 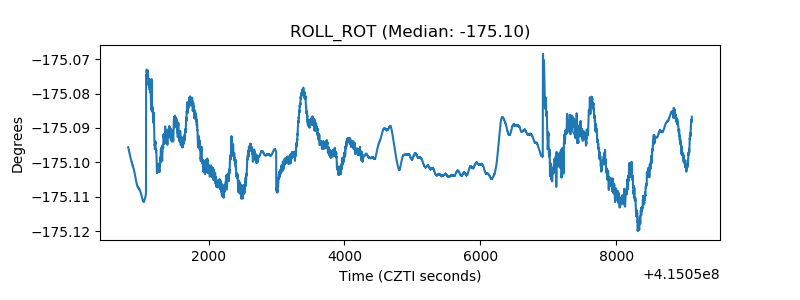 |
| _Roll_DEC | 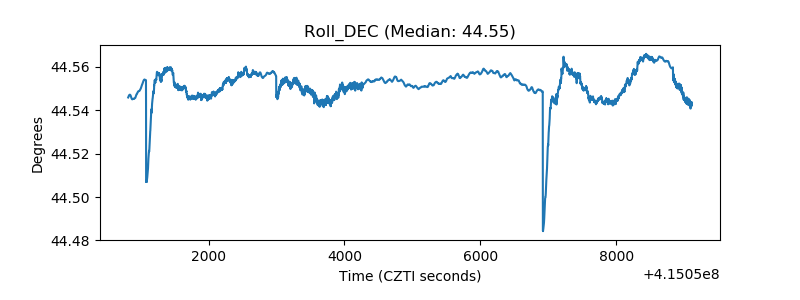 |
| _Roll_RA | 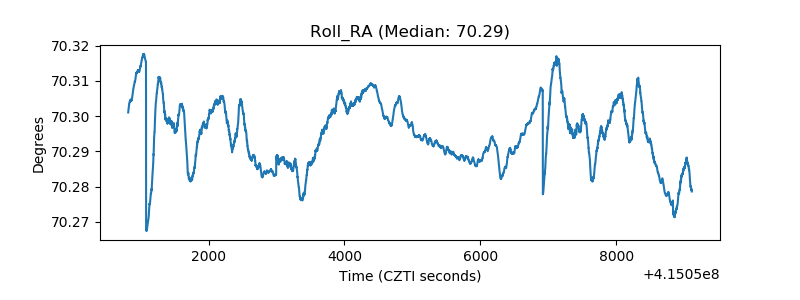 |
| Veto Counter | 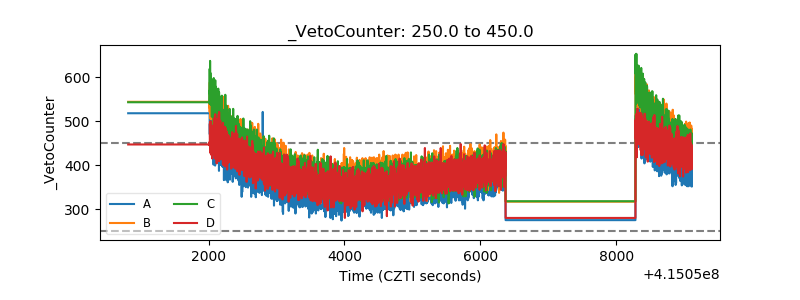 |