| Param | Original file | Final file |
|---|---|---|
| Filename | modeM0/AS1T05_086T01_9000005518_40083cztM0_level2.fits | modeM0/AS1T05_086T01_9000005518_40083cztM0_level2_quad_clean.evt |
| Size (bytes) | 419,817,600 | 90,216,000 |
| Size | 400.4 MB | 86.0 MB |
| Events in quadrant A | 2,691,926 | 646,041 |
| Events in quadrant B | 2,479,294 | 674,057 |
| Events in quadrant C | 5,982,819 | 530,752 |
| Events in quadrant D | 3,999,357 | 532,095 |
| Mode SS | |||
|---|---|---|---|
| Quadrant | BADHDUFLAG | Total packets | Discarded packets |
| A | 0 | 102 | 0 |
| B | 0 | 102 | 0 |
| C | 0 | 102 | 0 |
| D | 0 | 102 | 0 |
| Mode M0 | |||
|---|---|---|---|
| Quadrant | BADHDUFLAG | Total packets | Discarded packets |
| A | 0 | 11051 | 3 |
| B | 0 | 10550 | 2 |
| C | 0 | 21140 | 2 |
| D | 0 | 15144 | 2 |
| Mode M9 | |||
|---|---|---|---|
| Quadrant | BADHDUFLAG | Total packets | Discarded packets |
| A | 0 | 34 | 0 |
| B | 0 | 34 | 0 |
| C | 0 | 34 | 0 |
| D | 0 | 35 | 0 |
| Quadrant | Total seconds | Saturated seconds | Saturation percentage |
|---|---|---|---|
| A | 4975 | 12 | 0.241206% |
| B | 4975 | 8 | 0.160804% |
| C | 4975 | 1050 | 21.105528% |
| D | 4975 | 420 | 8.442211% |
Noise dominated data is calculated using 1-second bins in cleaned event files. If a bin has >2000 counts, and if more than 50% of those come from <1% of pixels, then it is considered to be noise-dominated and hence unusable.
| Quadrant | # 1 sec bins | Bins with >0 counts | Bins with >2000 counts | High rate bins dominated by noise | Noise dominated (total time) | Noise dominated (detector-on time) | Marked lightcurve |
|---|---|---|---|---|---|---|---|
| A | 6977 | 4976 | 5 | 5 | 0.07% | 0.10% | 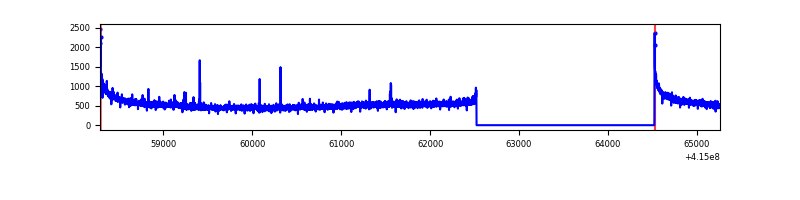 |
| B | 6977 | 4976 | 3 | 3 | 0.04% | 0.06% | 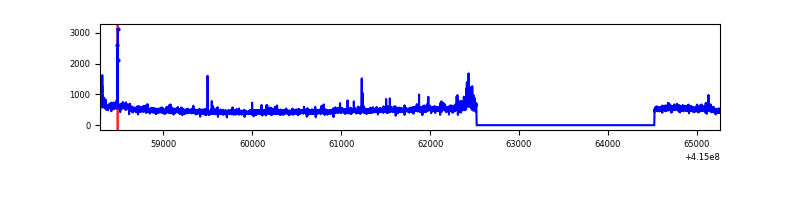 |
| C | 6977 | 4976 | 895 | 895 | 12.83% | 17.99% | 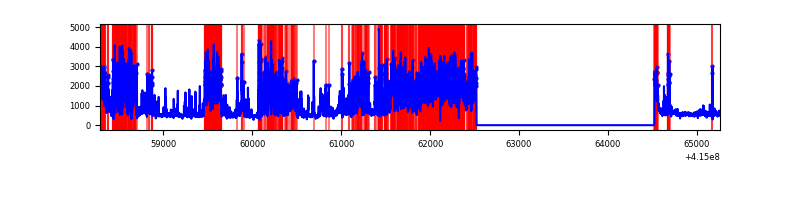 |
| D | 6977 | 4976 | 389 | 389 | 5.58% | 7.82% | 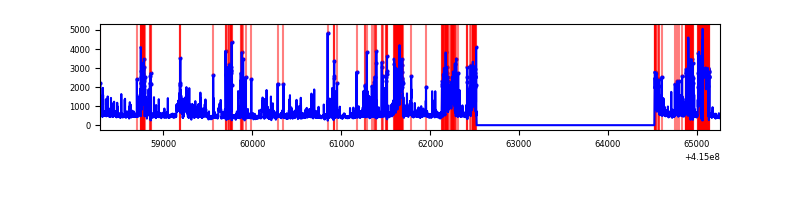 |
Top three noisy pixels from each quadrant. If the there are fewer than three noisy pixels in the level2.evt file, extra rows are filled as -1
| Pixel properties | Quadrant properties | ||||||
|---|---|---|---|---|---|---|---|
| Quadrant | DetID | PixID | Counts | Sigma | Mean | Median | Sigma |
| A | 10 | 83 | 431603 | 3667.4 | 574 | 566 | 117.5 |
| A | 9 | 143 | 19063 | 157.38 | 574 | 566 | 117.5 |
| A | 2 | 79 | 9931 | 79.68 | 574 | 566 | 117.5 |
| B | 0 | 189 | 150866 | 1352.14 | 581 | 568 | 111.2 |
| B | 4 | 200 | 22707 | 199.17 | 581 | 568 | 111.2 |
| B | 0 | 230 | 20237 | 176.95 | 581 | 568 | 111.2 |
| C | 9 | 187 | 3570523 | 28844.3 | 529 | 535 | 123.8 |
| C | 15 | 214 | 195526 | 1575.46 | 529 | 535 | 123.8 |
| C | 0 | 10 | 123778 | 995.76 | 529 | 535 | 123.8 |
| D | 12 | 227 | 1008240 | 7659.23 | 533 | 518 | 131.6 |
| D | 2 | 249 | 375859 | 2852.79 | 533 | 518 | 131.6 |
| D | 2 | 250 | 151019 | 1143.89 | 533 | 518 | 131.6 |
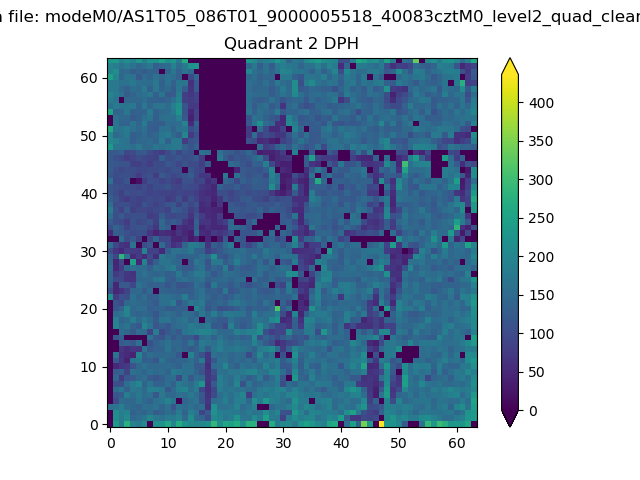
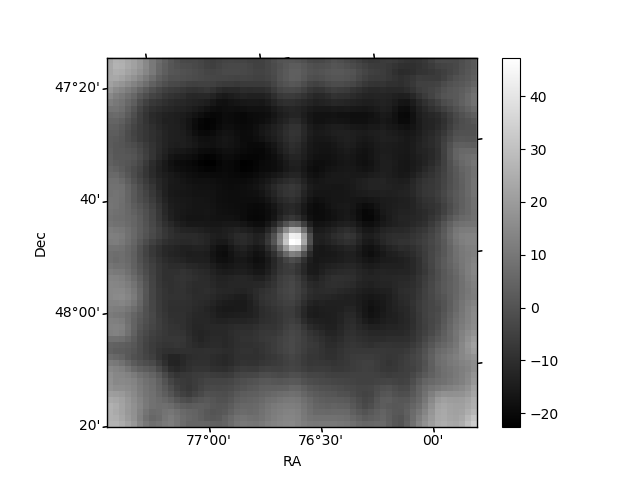
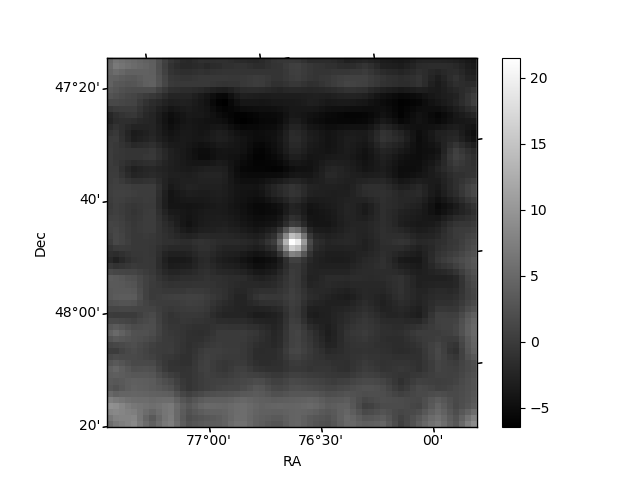
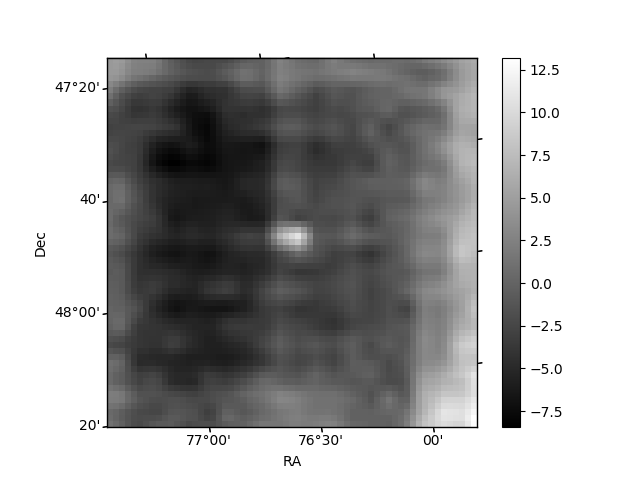
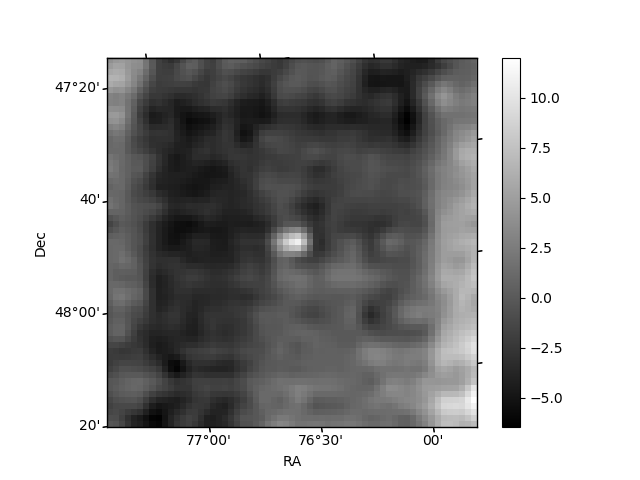
Histogram calculated using DETX and DETY for each event in the final _common_clean file
| Quadrant A | 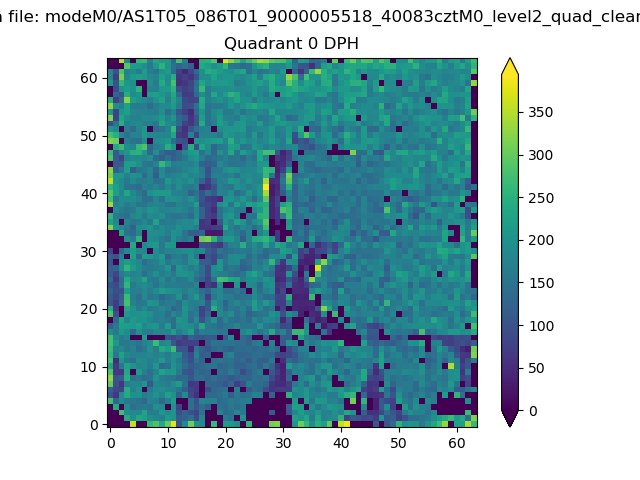 |
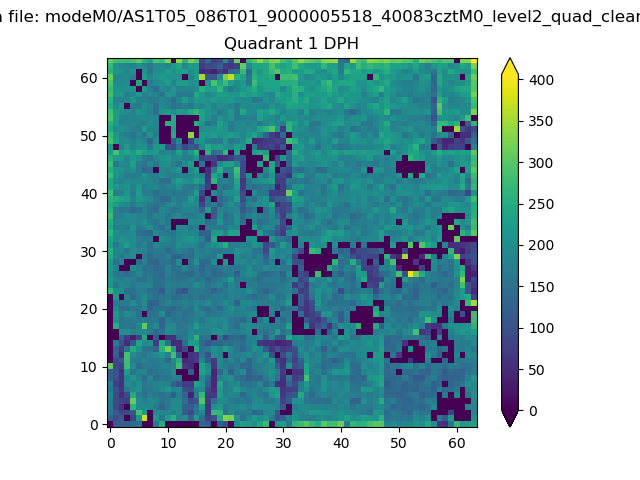 |
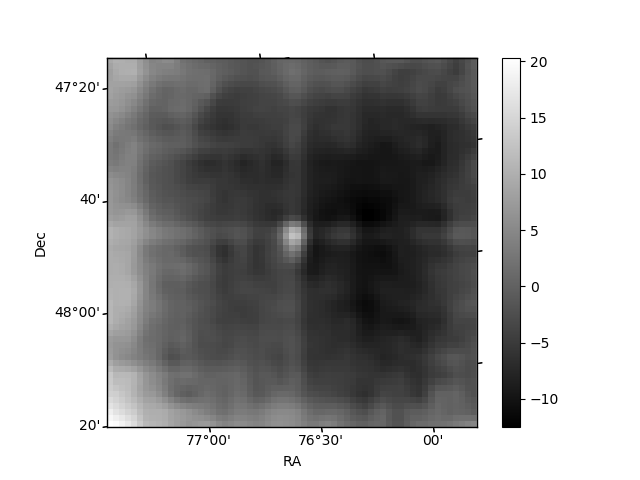
Quadrant B |
|---|---|---|---|
| Quadrant D | 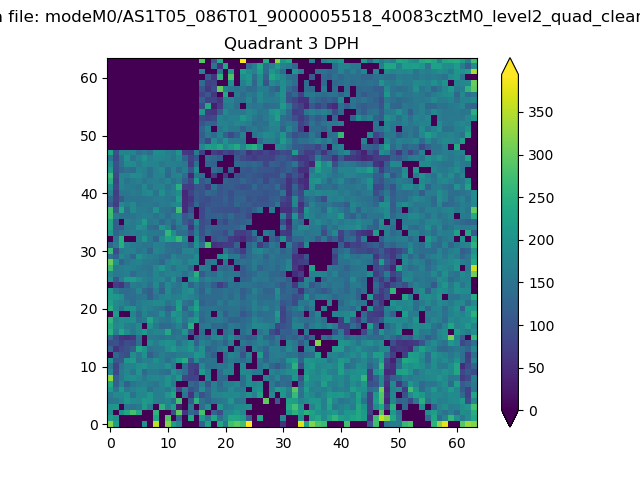 |
 |
Quadrant C |
| Plot type | Count rate plots | Images |
|---|---|---|
| Comparison with Poisson distribution Blue bars denote a histogram of data divided into 1 sec bins. Red curve is a Poisson curve with rate = median count rate of data. |
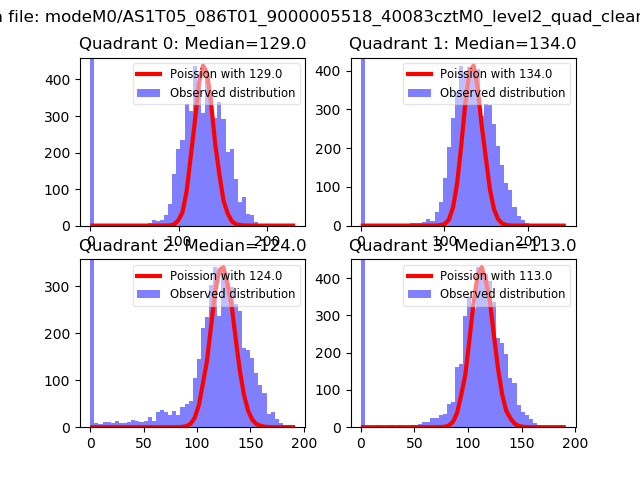 |
 |
| Quadrant-wise count rates Data is divided into 100 sec bins |
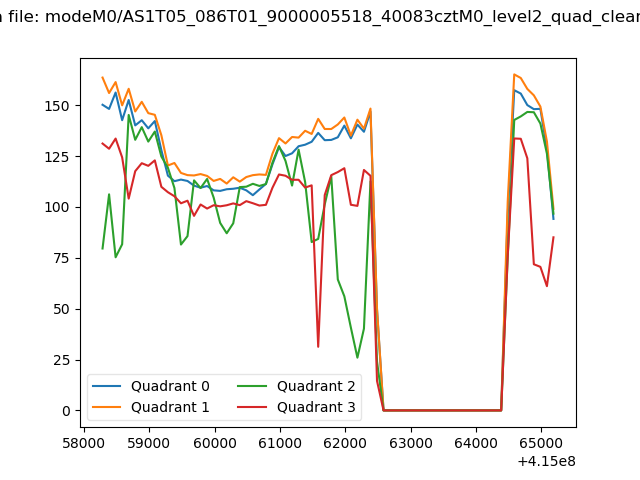 |
|
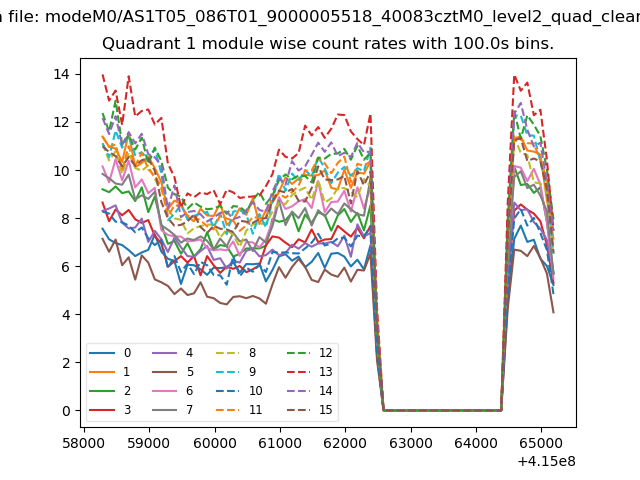
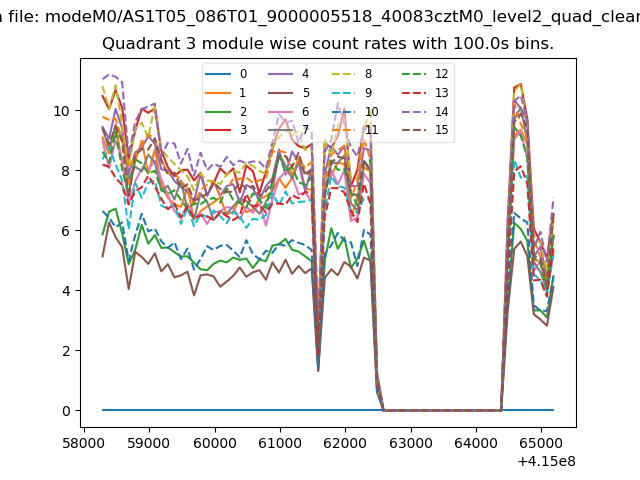
| Module-wise count rates for Quadrant A Data is divided into 100 sec bins |
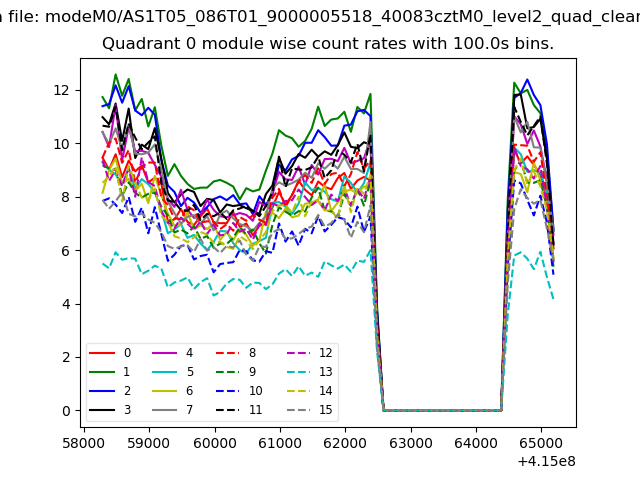 |
 |
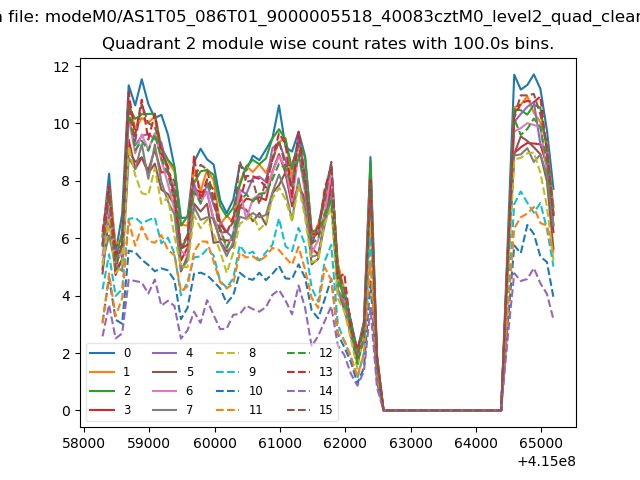
| Module-wise count rates for Quadrant B Data is divided into 100 sec bins |
 |
 |
| Module-wise count rates for Quadrant C Data is divided into 100 sec bins |
 |
 |
| Module-wise count rates for Quadrant D Data is divided into 100 sec bins |
 |
 |
| Parameter | Plot |
|---|---|
| CZT HV Monitor | 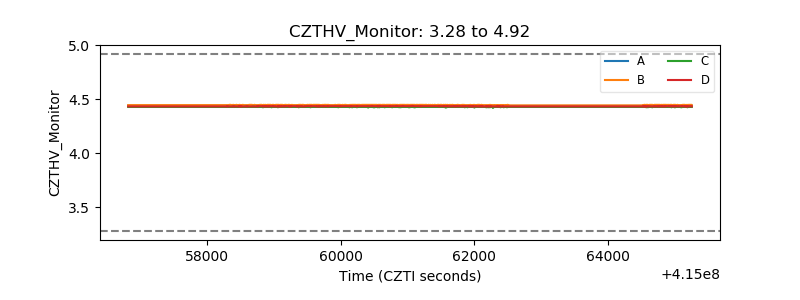 |
| D_VDD | 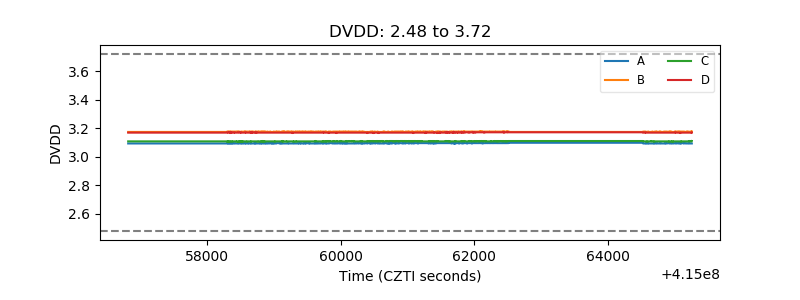 |
| Temperature 1 | 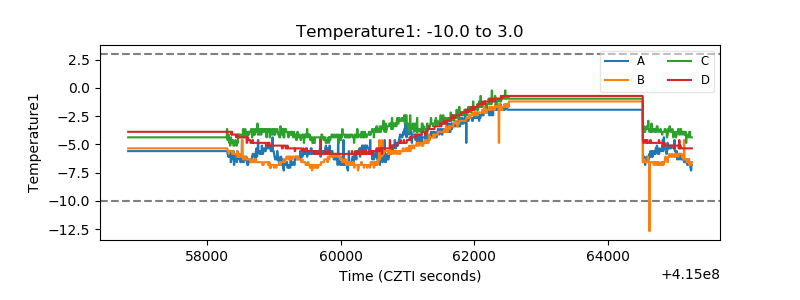 |
| Veto HV Monitor | 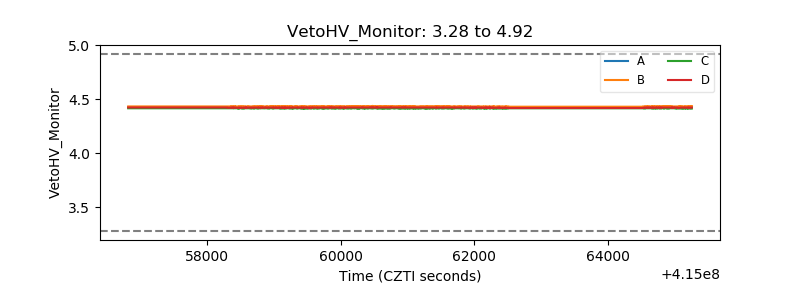 |
| Veto LLD | 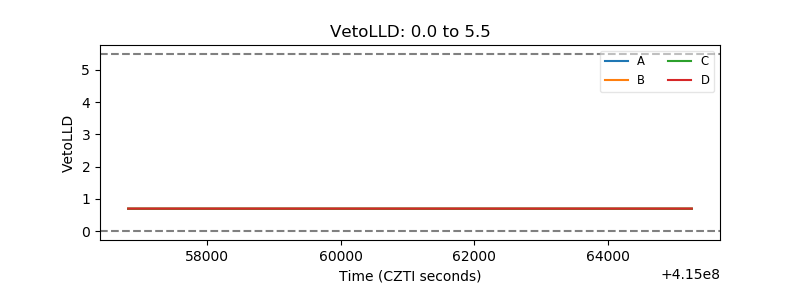 |
| Alpha Counter | 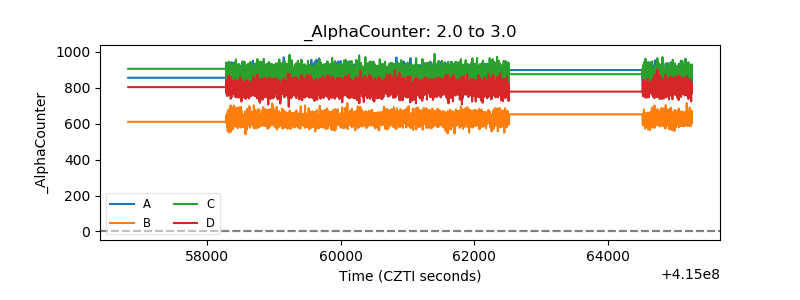 |
| _CPM_Rate | 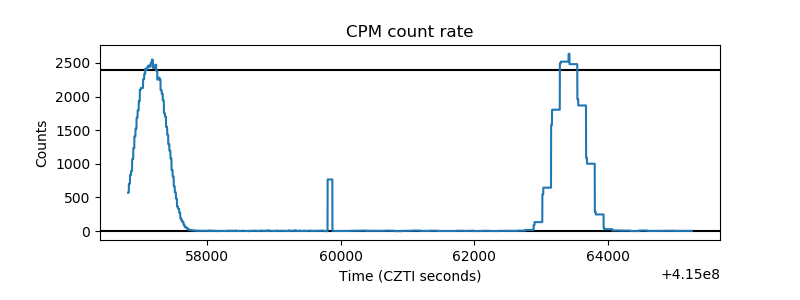 |
| CZT Counter | 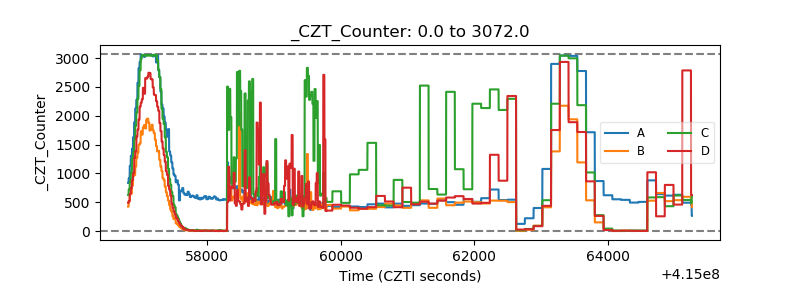 |
| +2.5 Volts monitor | 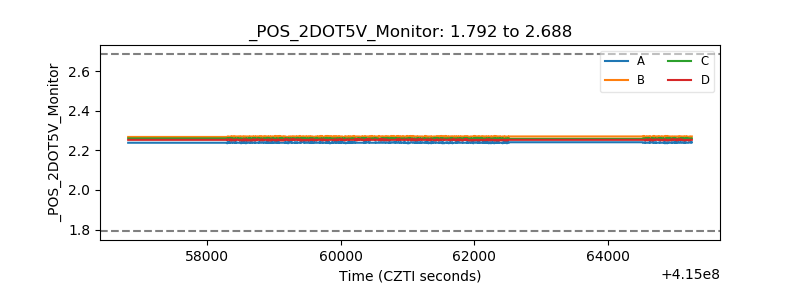 |
| +5 Volts monitor |  |
| _ROLL_ROT | 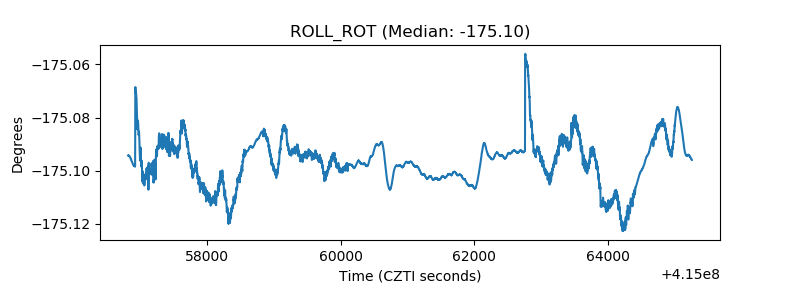 |
| _Roll_DEC | 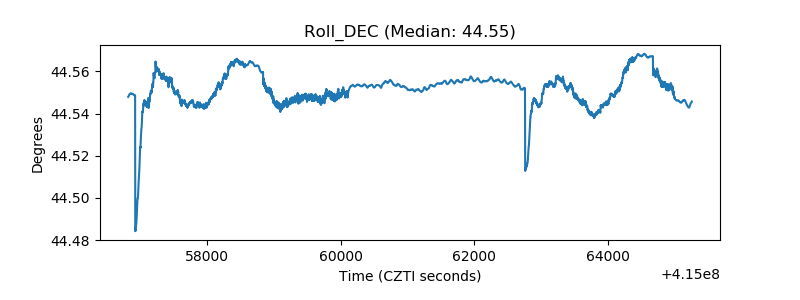 |
| _Roll_RA | 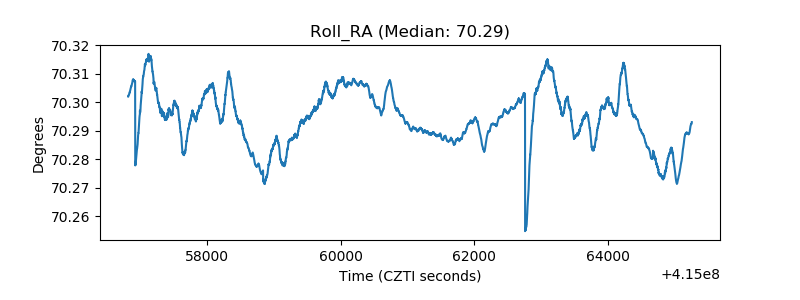 |
| Veto Counter | 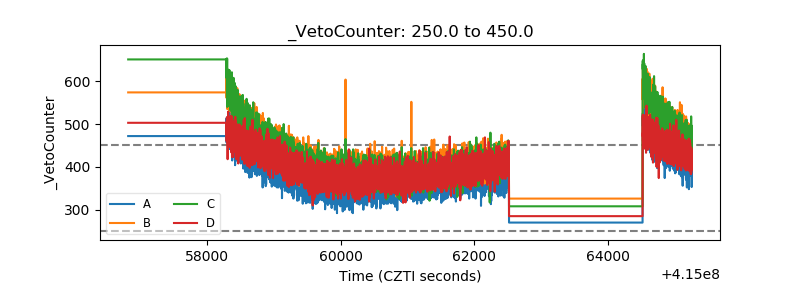 |