| Param | Original file | Final file |
|---|---|---|
| Filename | modeM0/AS1T05_086T01_9000005518_40084cztM0_level2.fits | modeM0/AS1T05_086T01_9000005518_40084cztM0_level2_quad_clean.evt |
| Size (bytes) | 396,722,880 | 98,023,680 |
| Size | 378.3 MB | 93.5 MB |
| Events in quadrant A | 2,854,562 | 682,507 |
| Events in quadrant B | 2,668,022 | 708,765 |
| Events in quadrant C | 5,170,487 | 638,600 |
| Events in quadrant D | 3,584,842 | 571,637 |
| Mode SS | |||
|---|---|---|---|
| Quadrant | BADHDUFLAG | Total packets | Discarded packets |
| A | 0 | 106 | 0 |
| B | 0 | 106 | 0 |
| C | 0 | 106 | 0 |
| D | 0 | 106 | 0 |
| Mode M0 | |||
|---|---|---|---|
| Quadrant | BADHDUFLAG | Total packets | Discarded packets |
| A | 0 | 11660 | 3 |
| B | 0 | 11047 | 2 |
| C | 0 | 18883 | 2 |
| D | 0 | 14232 | 2 |
| Mode M9 | |||
|---|---|---|---|
| Quadrant | BADHDUFLAG | Total packets | Discarded packets |
| A | 0 | 38 | 0 |
| B | 0 | 38 | 0 |
| C | 0 | 38 | 0 |
| D | 0 | 39 | 0 |
| Quadrant | Total seconds | Saturated seconds | Saturation percentage |
|---|---|---|---|
| A | 5241 | 9 | 0.171723% |
| B | 5241 | 9 | 0.171723% |
| C | 5241 | 413 | 7.880176% |
| D | 5241 | 317 | 6.048464% |
Noise dominated data is calculated using 1-second bins in cleaned event files. If a bin has >2000 counts, and if more than 50% of those come from <1% of pixels, then it is considered to be noise-dominated and hence unusable.
| Quadrant | # 1 sec bins | Bins with >0 counts | Bins with >2000 counts | High rate bins dominated by noise | Noise dominated (total time) | Noise dominated (detector-on time) | Marked lightcurve |
|---|---|---|---|---|---|---|---|
| A | 7333 | 5242 | 7 | 7 | 0.10% | 0.13% | 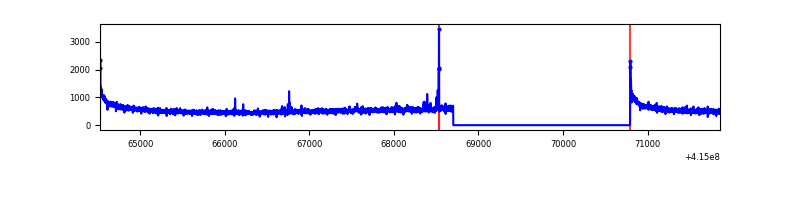 |
| B | 7333 | 5242 | 1 | 1 | 0.01% | 0.02% | 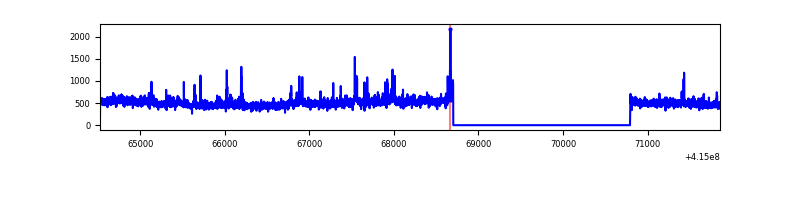 |
| C | 7333 | 5242 | 416 | 416 | 5.67% | 7.94% | 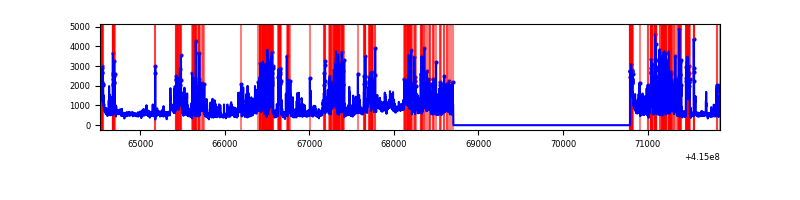 |
| D | 7333 | 5242 | 305 | 305 | 4.16% | 5.82% | 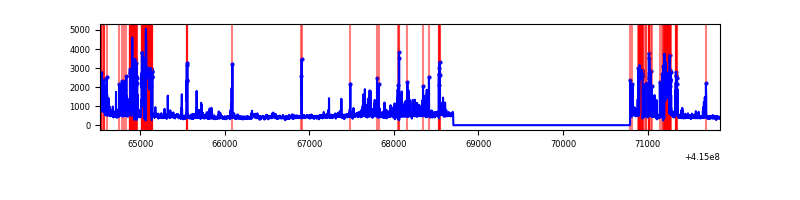 |
Top three noisy pixels from each quadrant. If the there are fewer than three noisy pixels in the level2.evt file, extra rows are filled as -1
| Pixel properties | Quadrant properties | ||||||
|---|---|---|---|---|---|---|---|
| Quadrant | DetID | PixID | Counts | Sigma | Mean | Median | Sigma |
| A | 10 | 83 | 448307 | 3574.49 | 608 | 599 | 125.3 |
| A | 9 | 191 | 32513 | 254.8 | 608 | 599 | 125.3 |
| A | 13 | 6 | 10349 | 77.84 | 608 | 599 | 125.3 |
| B | 0 | 189 | 198767 | 1681.42 | 613 | 597 | 117.9 |
| B | 5 | 63 | 28589 | 237.5 | 613 | 597 | 117.9 |
| B | 0 | 230 | 22448 | 185.4 | 613 | 597 | 117.9 |
| C | 9 | 187 | 2214000 | 16301.19 | 583 | 589 | 135.8 |
| C | 15 | 214 | 215565 | 1583.24 | 583 | 589 | 135.8 |
| C | 3 | 233 | 209727 | 1540.25 | 583 | 589 | 135.8 |
| D | 12 | 227 | 699877 | 4979.55 | 565 | 549 | 140.4 |
| D | 13 | 249 | 497625 | 3539.42 | 565 | 549 | 140.4 |
| D | 2 | 250 | 80832 | 571.65 | 565 | 549 | 140.4 |
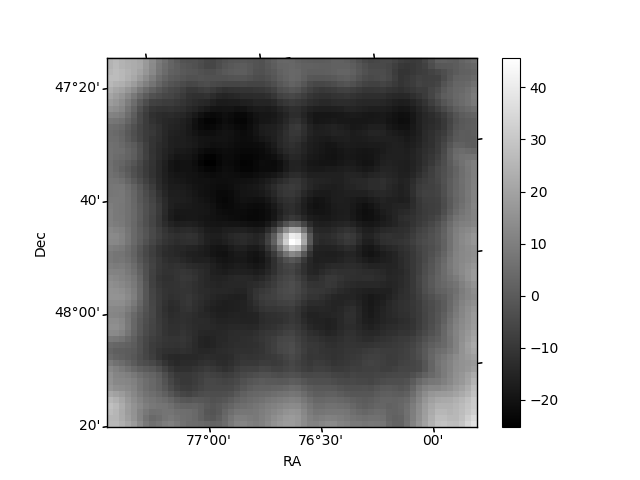
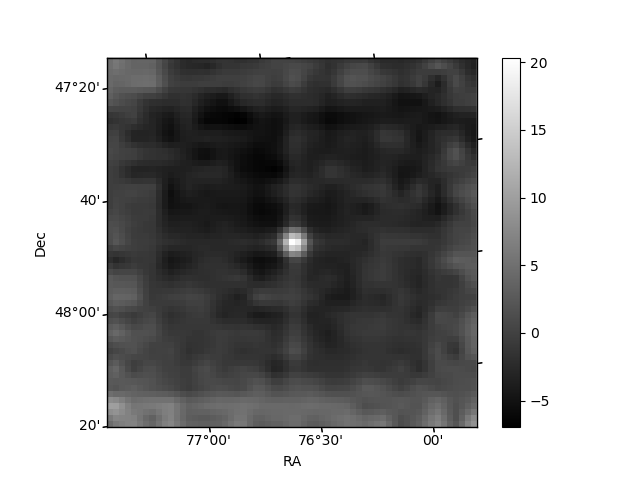
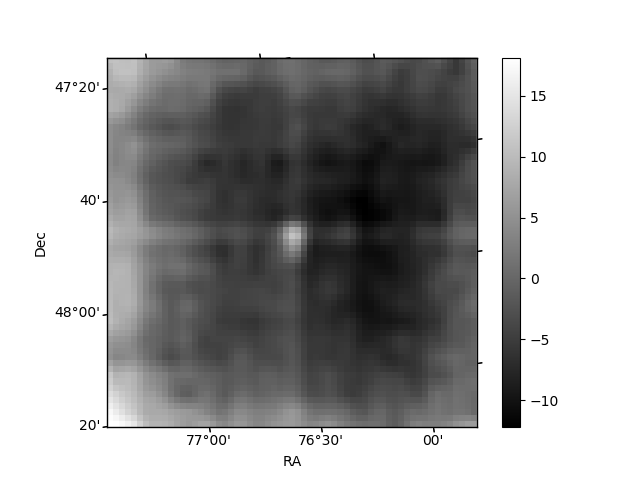
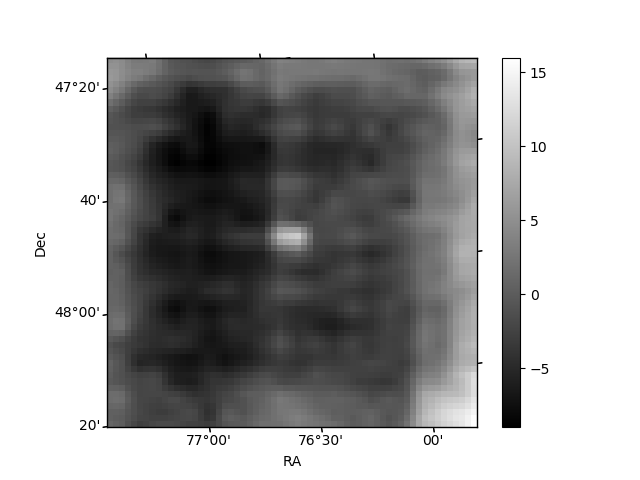
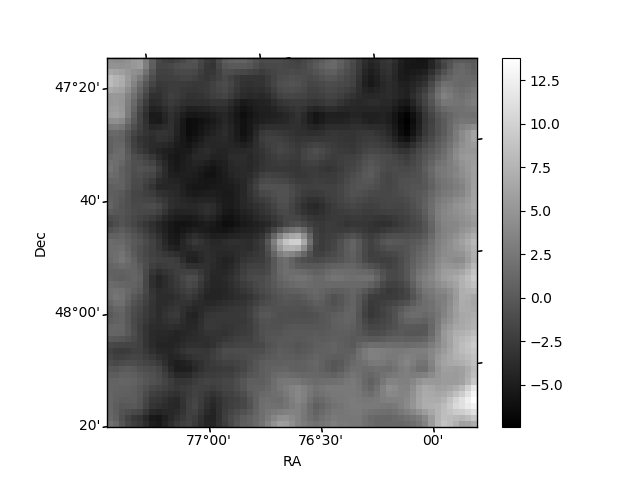
Histogram calculated using DETX and DETY for each event in the final _common_clean file
| Quadrant A | 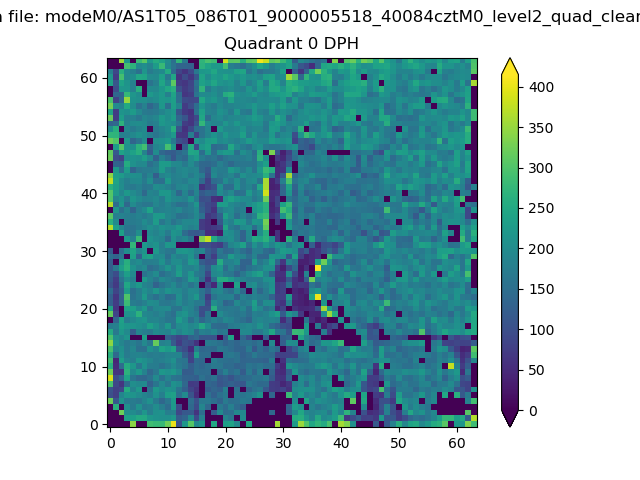 |
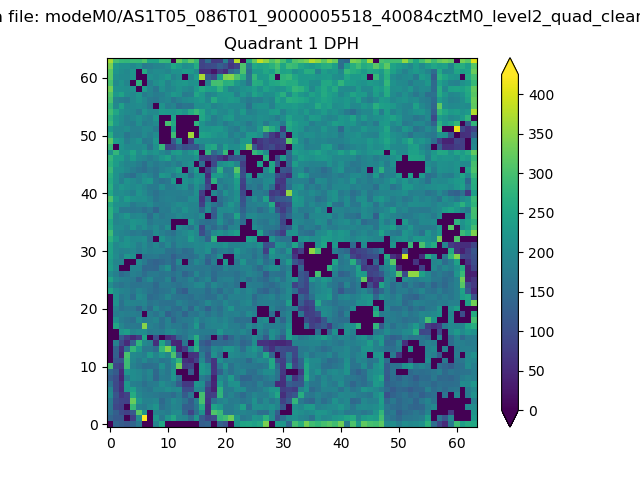 |
Quadrant B |
|---|---|---|---|
| Quadrant D | 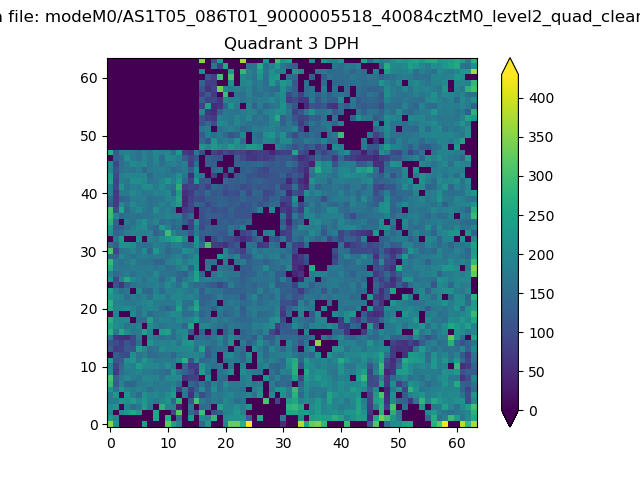 |
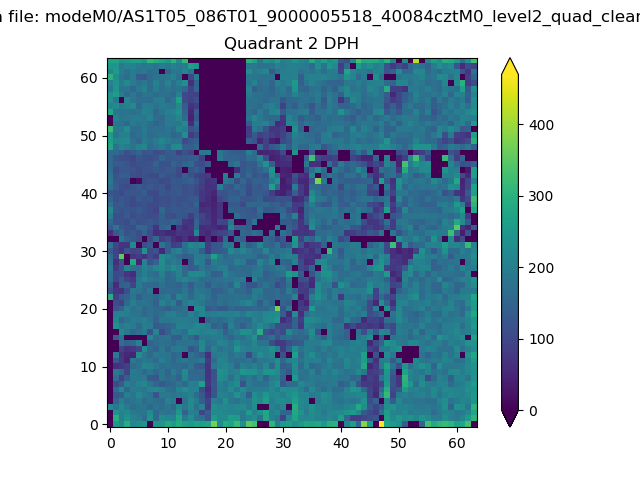 |
Quadrant C |
| Plot type | Count rate plots | Images |
|---|---|---|
| Comparison with Poisson distribution Blue bars denote a histogram of data divided into 1 sec bins. Red curve is a Poisson curve with rate = median count rate of data. |
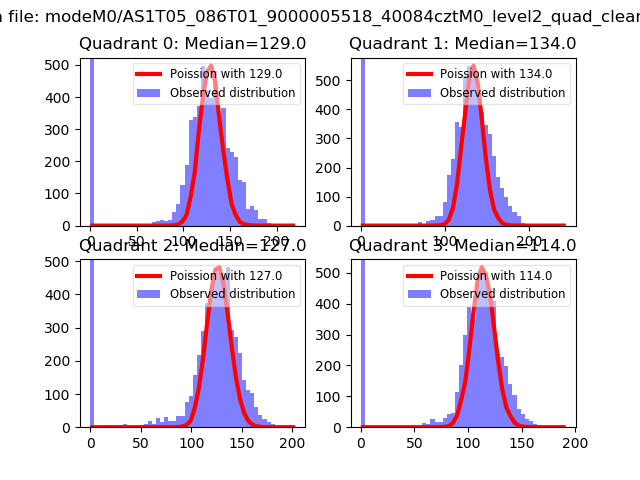 |
 |
| Quadrant-wise count rates Data is divided into 100 sec bins |
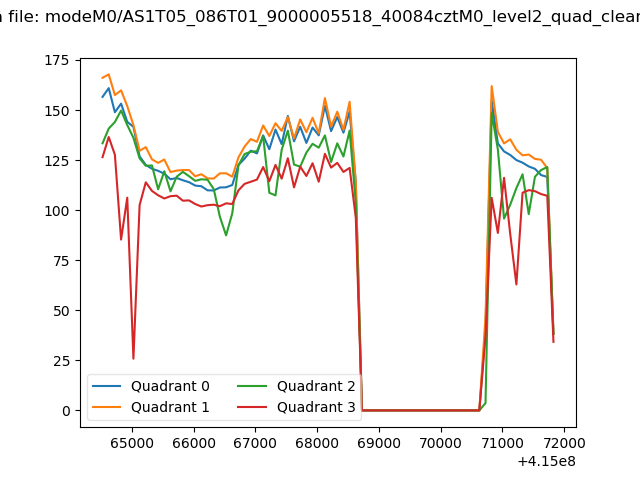 |
|
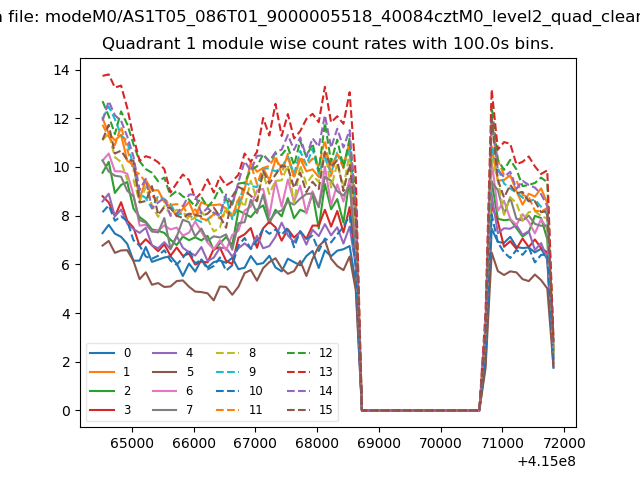
| Module-wise count rates for Quadrant A Data is divided into 100 sec bins |
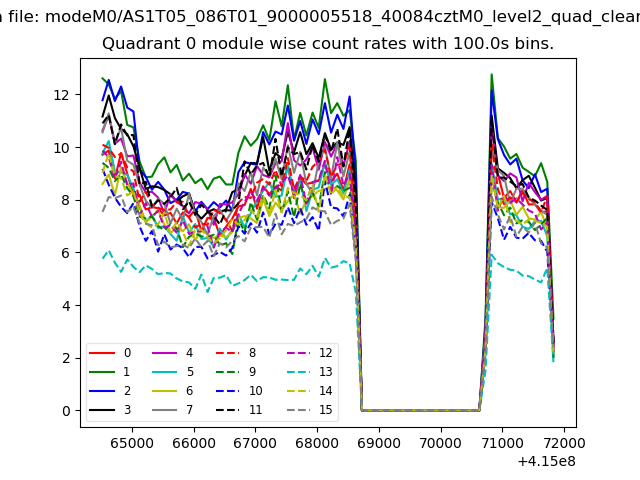 |
 |
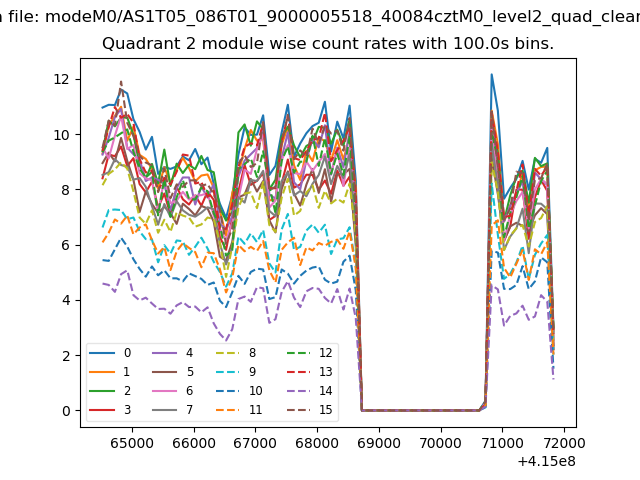
| Module-wise count rates for Quadrant B Data is divided into 100 sec bins |
 |
 |
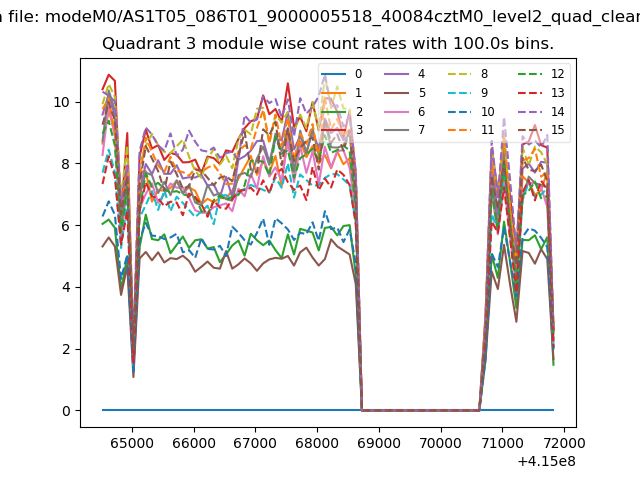
| Module-wise count rates for Quadrant C Data is divided into 100 sec bins |
 |
 |
| Module-wise count rates for Quadrant D Data is divided into 100 sec bins |
 |
 |
| Parameter | Plot |
|---|---|
| CZT HV Monitor | 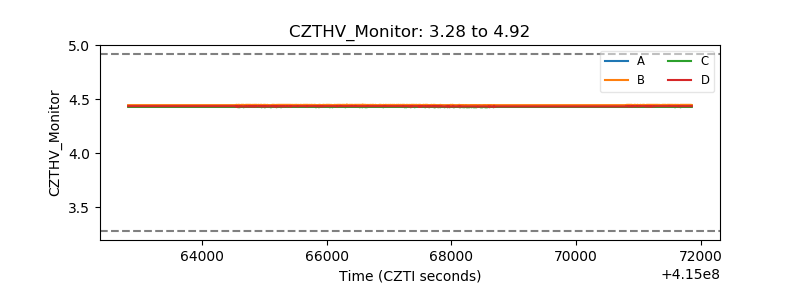 |
| D_VDD | 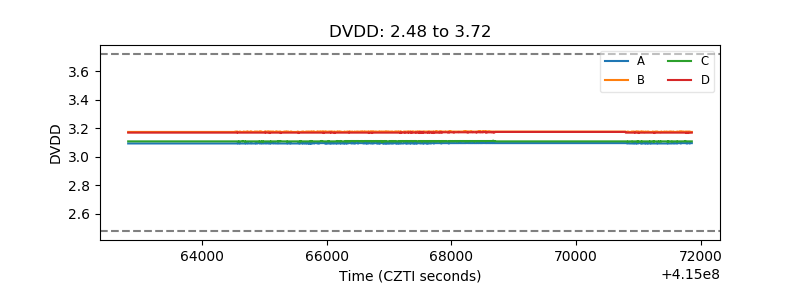 |
| Temperature 1 | 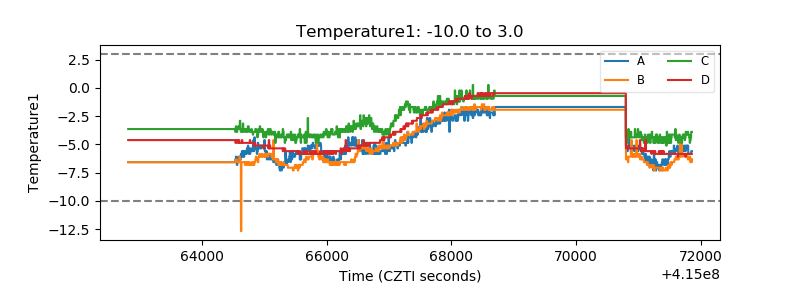 |
| Veto HV Monitor | 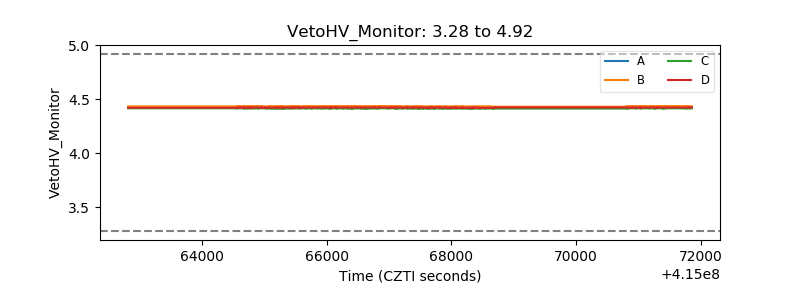 |
| Veto LLD | 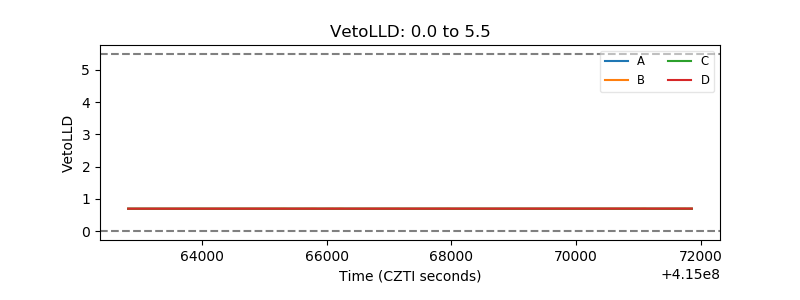 |
| Alpha Counter | 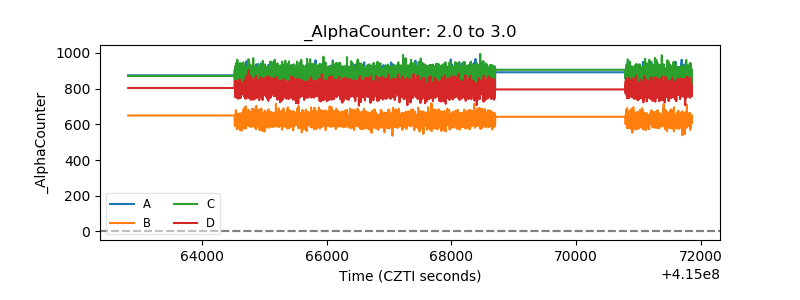 |
| _CPM_Rate | 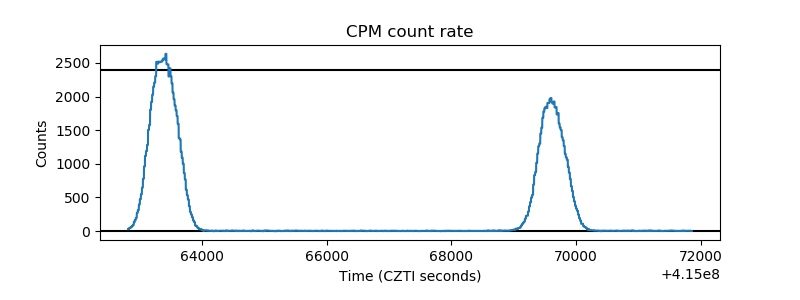 |
| CZT Counter | 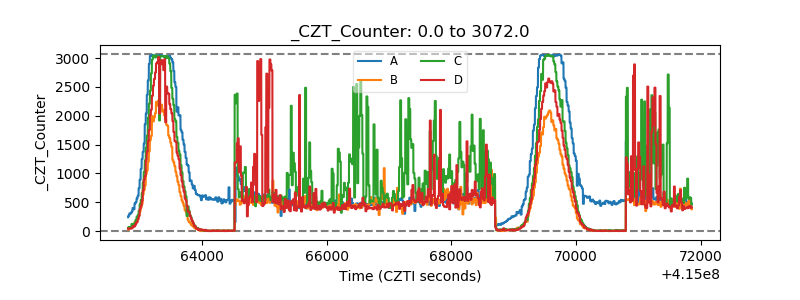 |
| +2.5 Volts monitor | 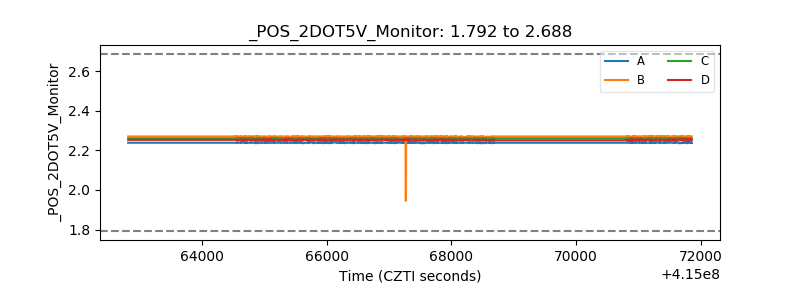 |
| +5 Volts monitor | 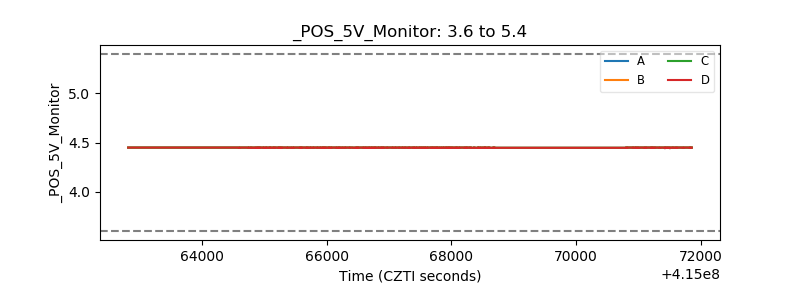 |
| _ROLL_ROT | 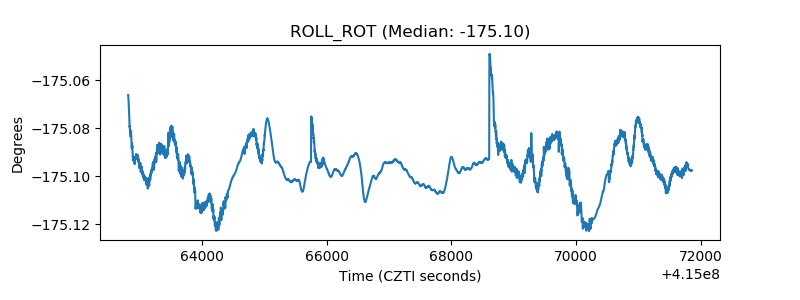 |
| _Roll_DEC | 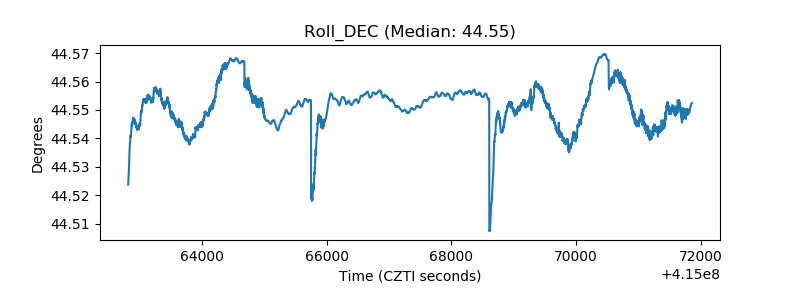 |
| _Roll_RA | 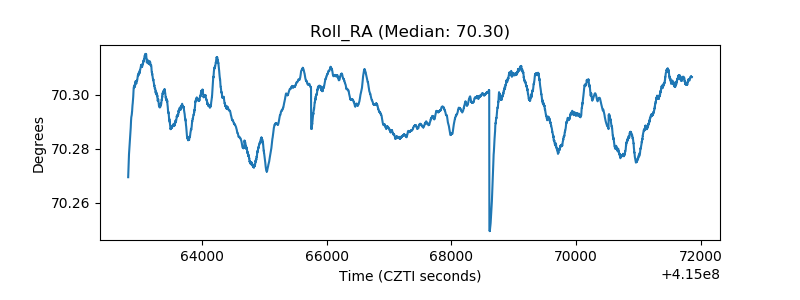 |
| Veto Counter | 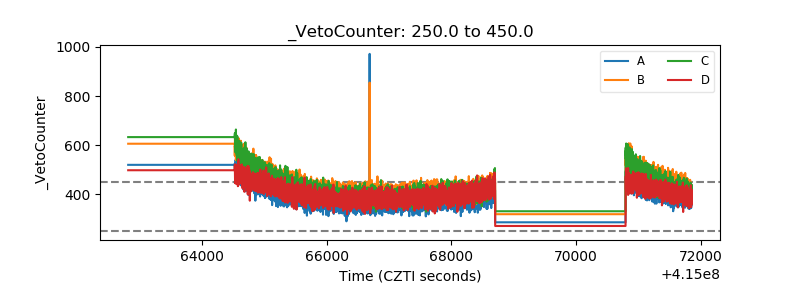 |