| Param | Original file | Final file |
|---|---|---|
| Filename | modeM0/AS1T05_086T01_9000005518_40085cztM0_level2.fits | modeM0/AS1T05_086T01_9000005518_40085cztM0_level2_quad_clean.evt |
| Size (bytes) | 382,740,480 | 94,285,440 |
| Size | 365.0 MB | 89.9 MB |
| Events in quadrant A | 2,869,441 | 653,456 |
| Events in quadrant B | 2,628,390 | 680,535 |
| Events in quadrant C | 3,979,919 | 620,906 |
| Events in quadrant D | 4,286,965 | 537,356 |
| Mode SS | |||
|---|---|---|---|
| Quadrant | BADHDUFLAG | Total packets | Discarded packets |
| A | 0 | 106 | 0 |
| B | 0 | 106 | 0 |
| C | 0 | 106 | 0 |
| D | 0 | 106 | 0 |
| Mode M0 | |||
|---|---|---|---|
| Quadrant | BADHDUFLAG | Total packets | Discarded packets |
| A | 0 | 11552 | 3 |
| B | 0 | 10990 | 2 |
| C | 0 | 15053 | 2 |
| D | 0 | 16381 | 2 |
| Mode M9 | |||
|---|---|---|---|
| Quadrant | BADHDUFLAG | Total packets | Discarded packets |
| A | 0 | 28 | 0 |
| B | 0 | 28 | 0 |
| C | 0 | 28 | 0 |
| D | 0 | 29 | 0 |
| Quadrant | Total seconds | Saturated seconds | Saturation percentage |
|---|---|---|---|
| A | 5180 | 47 | 0.907336% |
| B | 5180 | 12 | 0.231660% |
| C | 5180 | 272 | 5.250965% |
| D | 5180 | 550 | 10.617761% |
Noise dominated data is calculated using 1-second bins in cleaned event files. If a bin has >2000 counts, and if more than 50% of those come from <1% of pixels, then it is considered to be noise-dominated and hence unusable.
| Quadrant | # 1 sec bins | Bins with >0 counts | Bins with >2000 counts | High rate bins dominated by noise | Noise dominated (total time) | Noise dominated (detector-on time) | Marked lightcurve |
|---|---|---|---|---|---|---|---|
| A | 7301 | 5181 | 27 | 27 | 0.37% | 0.52% | 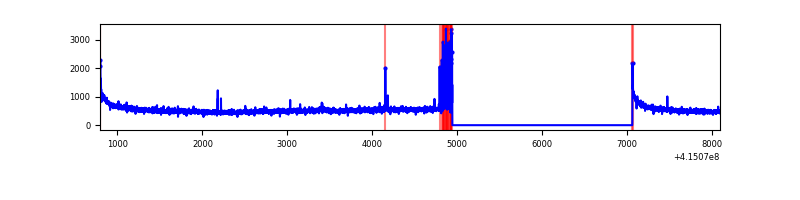 |
| B | 7301 | 5181 | 6 | 6 | 0.08% | 0.12% | 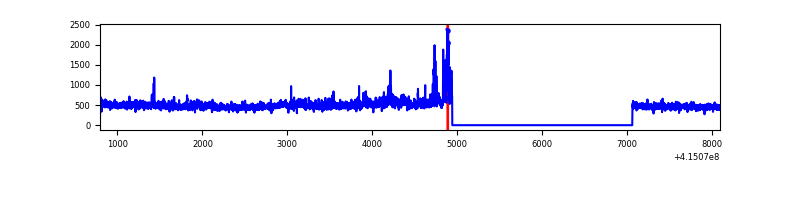 |
| C | 7301 | 5181 | 279 | 279 | 3.82% | 5.39% | 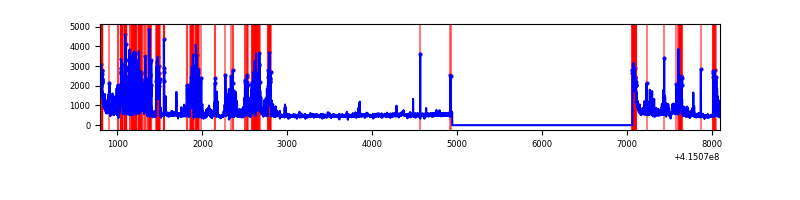 |
| D | 7301 | 5181 | 476 | 476 | 6.52% | 9.19% | 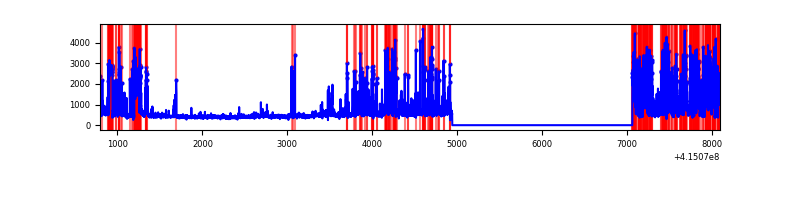 |
Top three noisy pixels from each quadrant. If the there are fewer than three noisy pixels in the level2.evt file, extra rows are filled as -1
| Pixel properties | Quadrant properties | ||||||
|---|---|---|---|---|---|---|---|
| Quadrant | DetID | PixID | Counts | Sigma | Mean | Median | Sigma |
| A | 10 | 83 | 449964 | 3735.2 | 592 | 582 | 120.3 |
| A | 13 | 248 | 87146 | 719.51 | 592 | 582 | 120.3 |
| A | 9 | 191 | 10564 | 82.97 | 592 | 582 | 120.3 |
| B | 0 | 189 | 223794 | 1961.87 | 594 | 580 | 113.8 |
| B | 0 | 230 | 38849 | 336.35 | 594 | 580 | 113.8 |
| B | 5 | 63 | 29811 | 256.92 | 594 | 580 | 113.8 |
| C | 9 | 187 | 1315679 | 9902.92 | 570 | 578 | 132.8 |
| C | 15 | 214 | 214756 | 1612.79 | 570 | 578 | 132.8 |
| C | 0 | 10 | 182174 | 1367.45 | 570 | 578 | 132.8 |
| D | 12 | 0 | 674688 | 4985.12 | 544 | 529 | 135.2 |
| D | 13 | 249 | 608401 | 4494.96 | 544 | 529 | 135.2 |
| D | 1 | 47 | 417050 | 3080.0 | 544 | 529 | 135.2 |
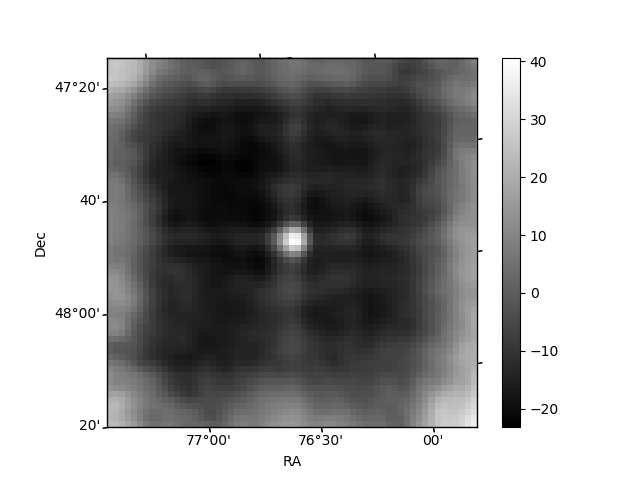
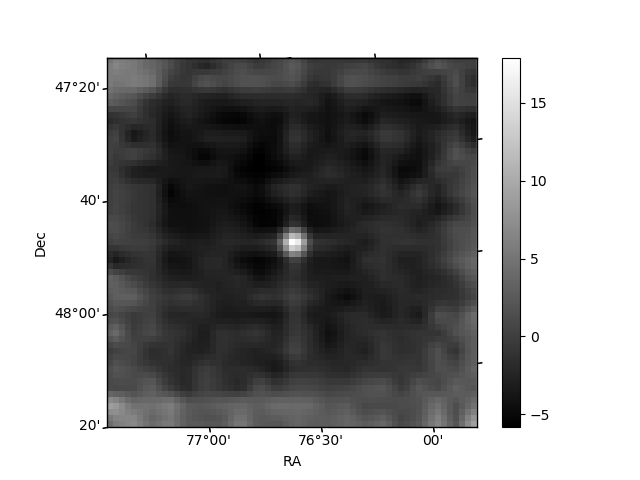
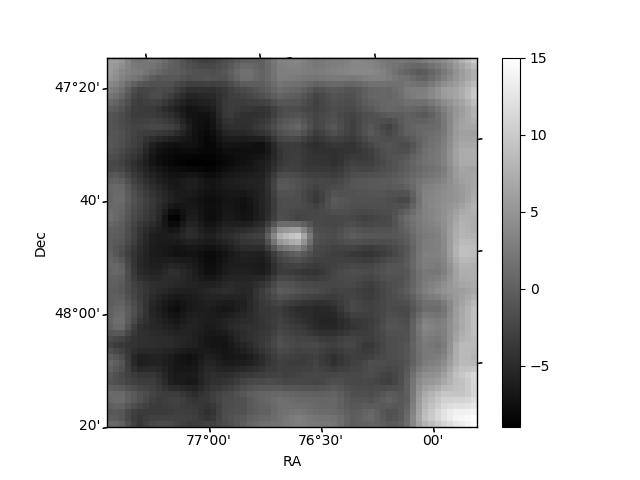
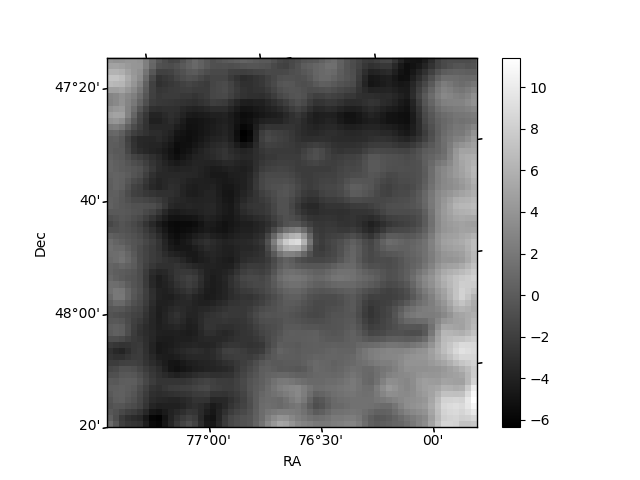
Histogram calculated using DETX and DETY for each event in the final _common_clean file
| Quadrant A | 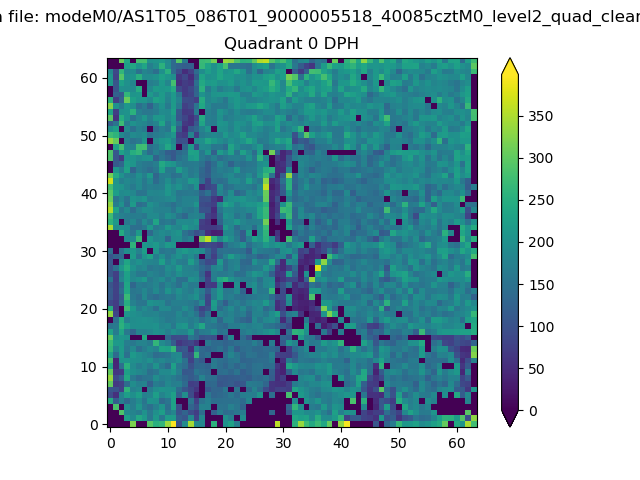 |
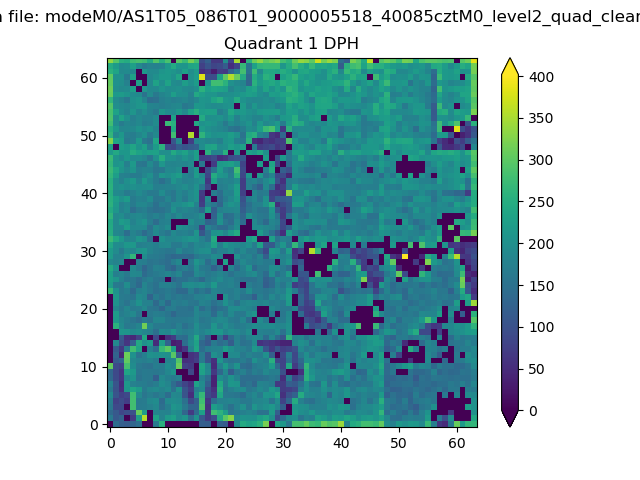 |
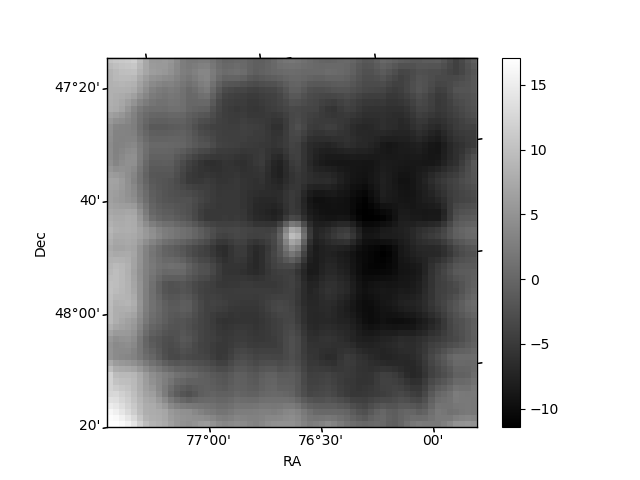
Quadrant B |
|---|---|---|---|
| Quadrant D | 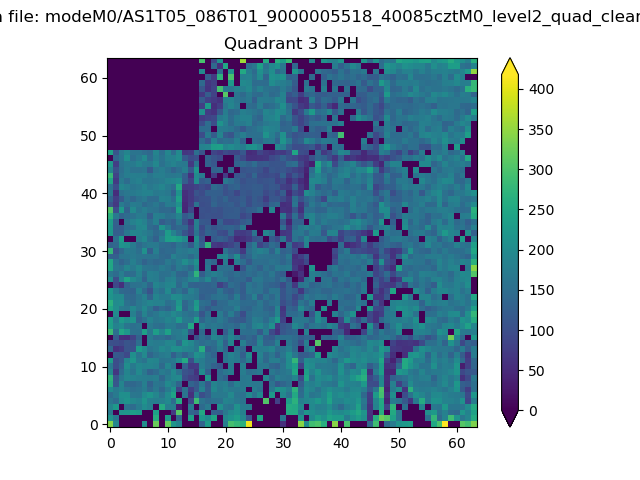 |
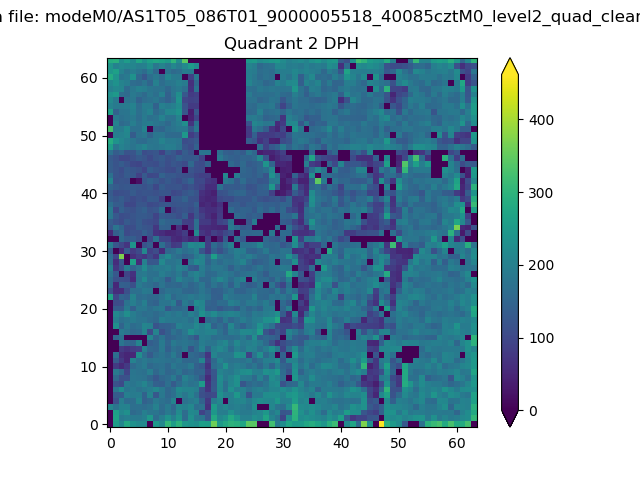 |
Quadrant C |
| Plot type | Count rate plots | Images |
|---|---|---|
| Comparison with Poisson distribution Blue bars denote a histogram of data divided into 1 sec bins. Red curve is a Poisson curve with rate = median count rate of data. |
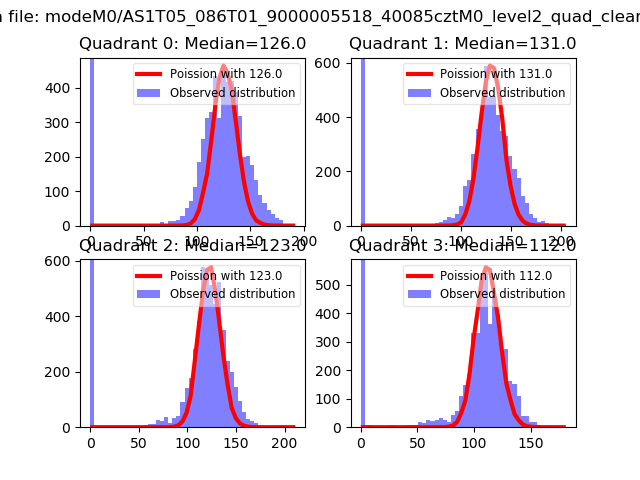 |
 |
| Quadrant-wise count rates Data is divided into 100 sec bins |
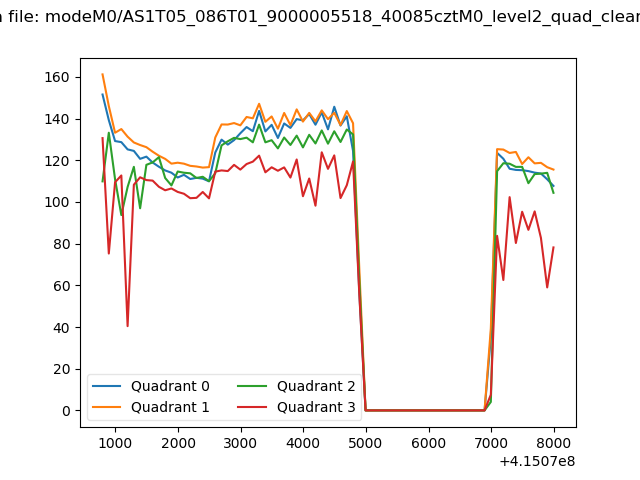 |
|
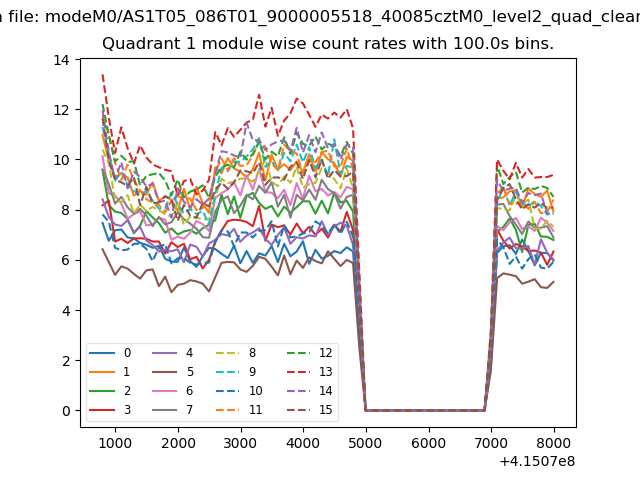
| Module-wise count rates for Quadrant A Data is divided into 100 sec bins |
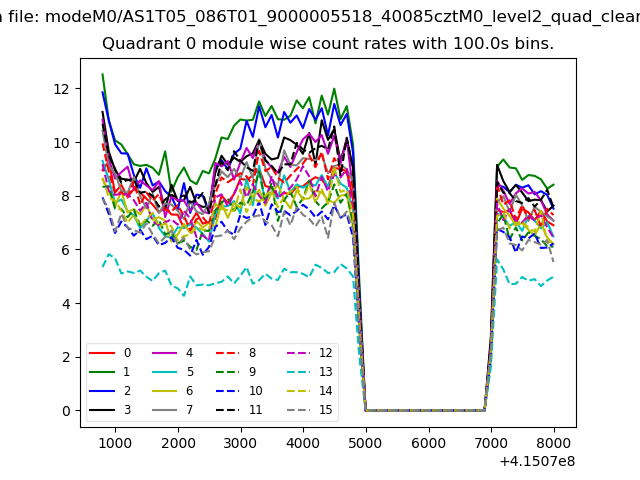 |
 |
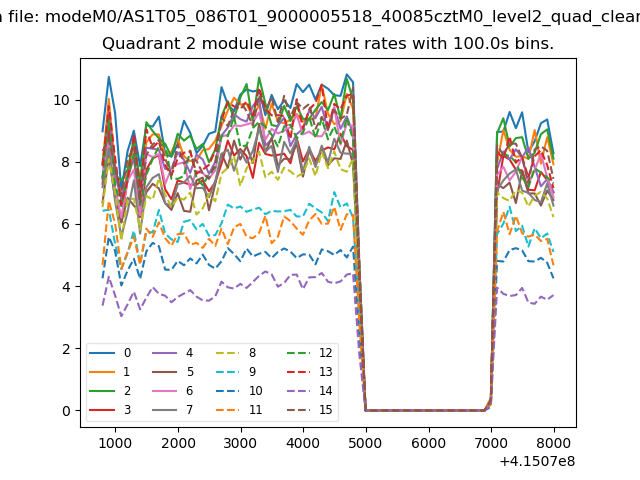
| Module-wise count rates for Quadrant B Data is divided into 100 sec bins |
 |
 |
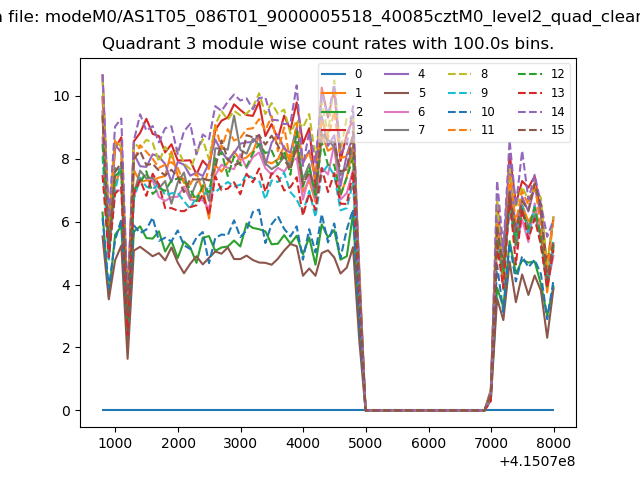
| Module-wise count rates for Quadrant C Data is divided into 100 sec bins |
 |
 |
| Module-wise count rates for Quadrant D Data is divided into 100 sec bins |
 |
 |
| Parameter | Plot |
|---|---|
| CZT HV Monitor | 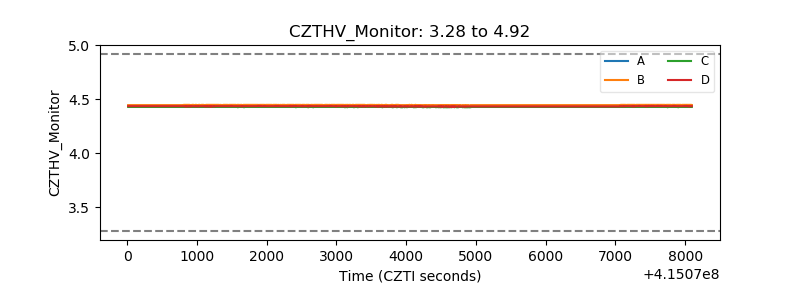 |
| D_VDD | 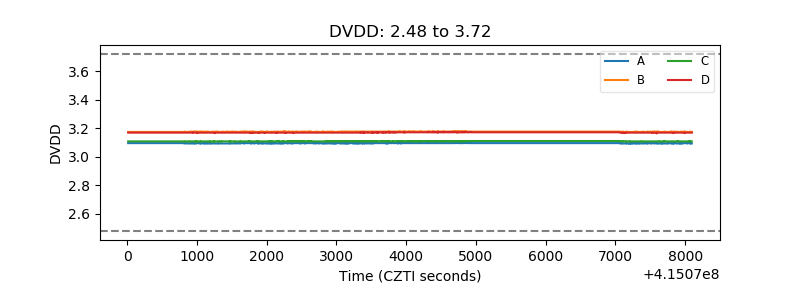 |
| Temperature 1 | 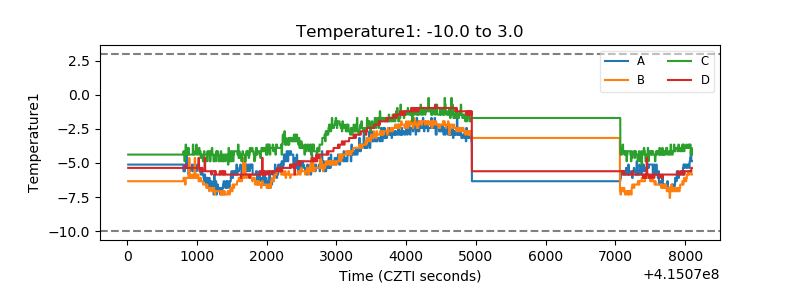 |
| Veto HV Monitor | 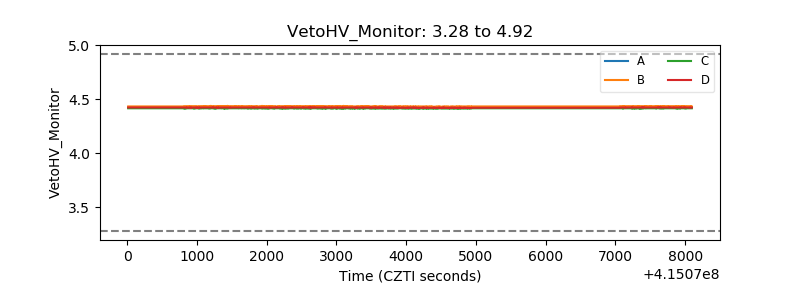 |
| Veto LLD | 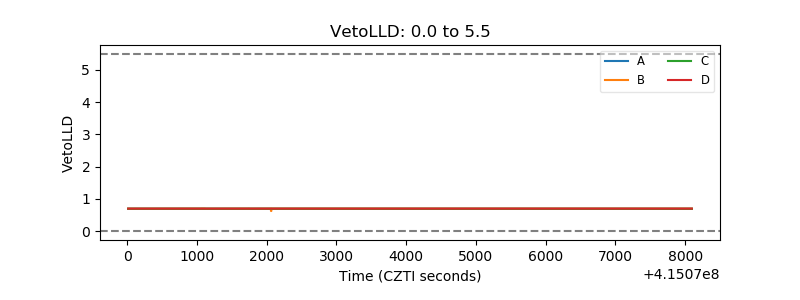 |
| Alpha Counter | 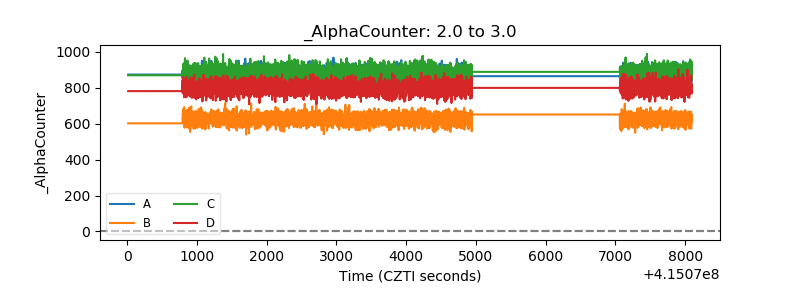 |
| _CPM_Rate | 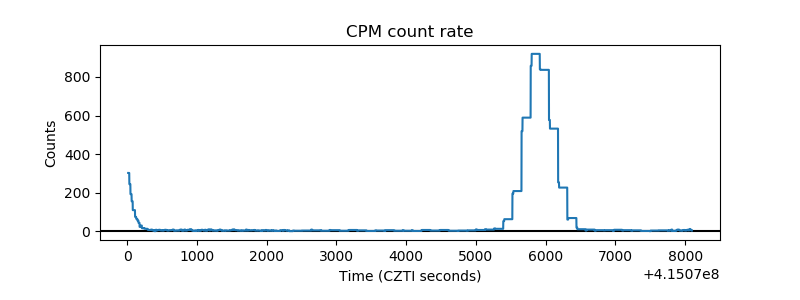 |
| CZT Counter | 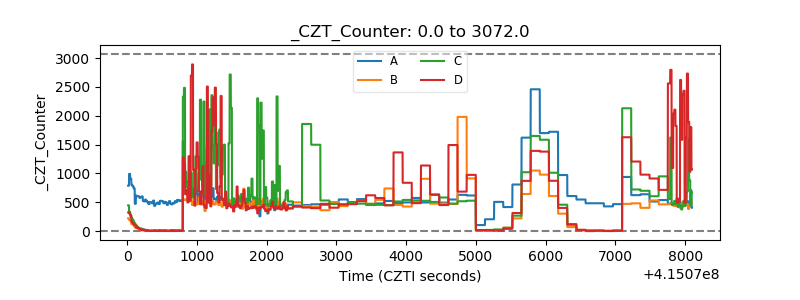 |
| +2.5 Volts monitor | 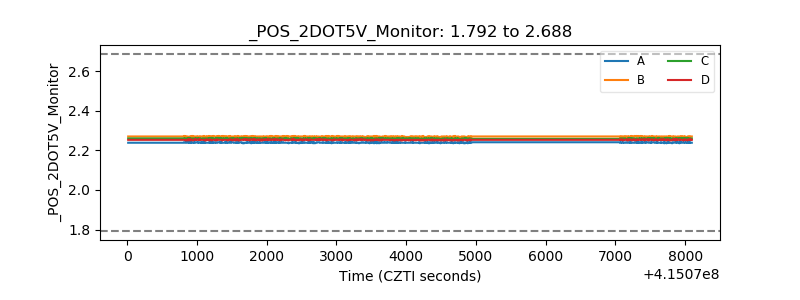 |
| +5 Volts monitor | 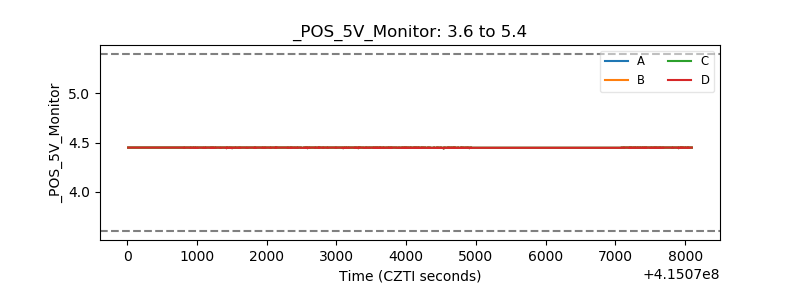 |
| _ROLL_ROT | 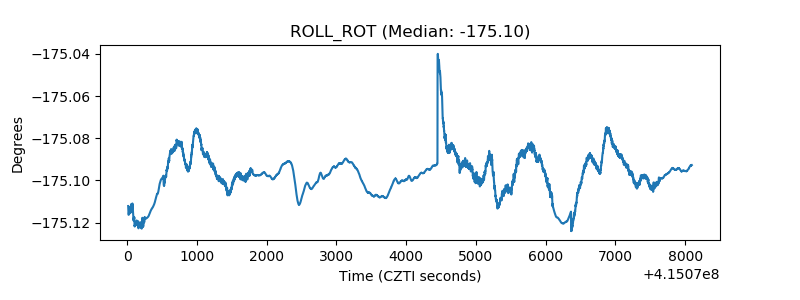 |
| _Roll_DEC | 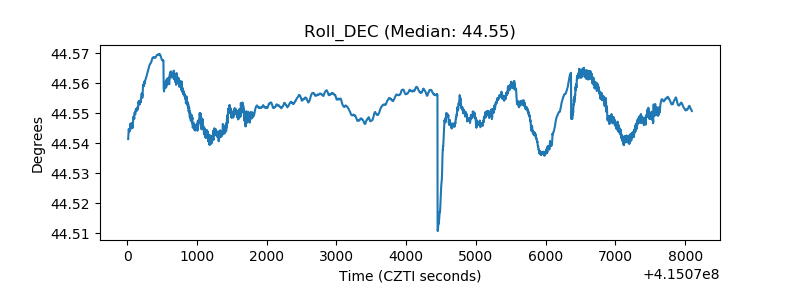 |
| _Roll_RA | 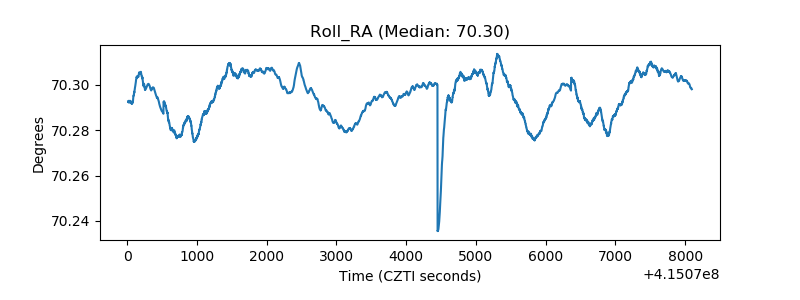 |
| Veto Counter | 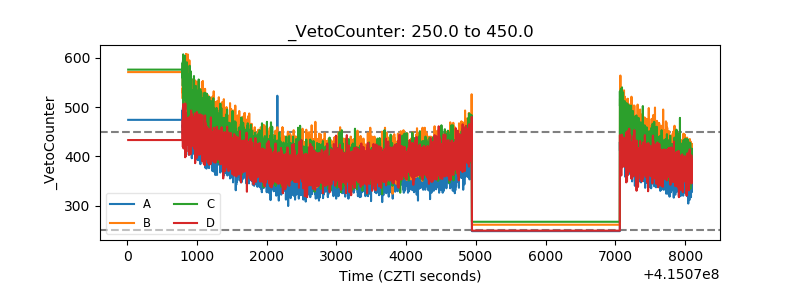 |