| Param | Original file | Final file |
|---|---|---|
| Filename | modeM0/AS1T05_086T01_9000005518_40086cztM0_level2.fits | modeM0/AS1T05_086T01_9000005518_40086cztM0_level2_quad_clean.evt |
| Size (bytes) | 425,540,160 | 87,027,840 |
| Size | 405.8 MB | 83.0 MB |
| Events in quadrant A | 2,676,447 | 612,625 |
| Events in quadrant B | 2,508,955 | 635,703 |
| Events in quadrant C | 5,402,447 | 542,989 |
| Events in quadrant D | 4,777,212 | 495,145 |
| Mode SS | |||
|---|---|---|---|
| Quadrant | BADHDUFLAG | Total packets | Discarded packets |
| A | 0 | 100 | 0 |
| B | 0 | 100 | 0 |
| C | 0 | 100 | 0 |
| D | 0 | 100 | 0 |
| Mode M0 | |||
|---|---|---|---|
| Quadrant | BADHDUFLAG | Total packets | Discarded packets |
| A | 0 | 10853 | 3 |
| B | 0 | 10711 | 2 |
| C | 0 | 19502 | 2 |
| D | 0 | 17601 | 2 |
| Mode M9 | |||
|---|---|---|---|
| Quadrant | BADHDUFLAG | Total packets | Discarded packets |
| A | 0 | 24 | 0 |
| B | 0 | 24 | 0 |
| C | 0 | 24 | 0 |
| D | 0 | 25 | 0 |
| Quadrant | Total seconds | Saturated seconds | Saturation percentage |
|---|---|---|---|
| A | 4980 | 16 | 0.321285% |
| B | 4980 | 5 | 0.100402% |
| C | 4980 | 681 | 13.674699% |
| D | 4980 | 619 | 12.429719% |
Noise dominated data is calculated using 1-second bins in cleaned event files. If a bin has >2000 counts, and if more than 50% of those come from <1% of pixels, then it is considered to be noise-dominated and hence unusable.
| Quadrant | # 1 sec bins | Bins with >0 counts | Bins with >2000 counts | High rate bins dominated by noise | Noise dominated (total time) | Noise dominated (detector-on time) | Marked lightcurve |
|---|---|---|---|---|---|---|---|
| A | 7042 | 4981 | 11 | 11 | 0.16% | 0.22% | 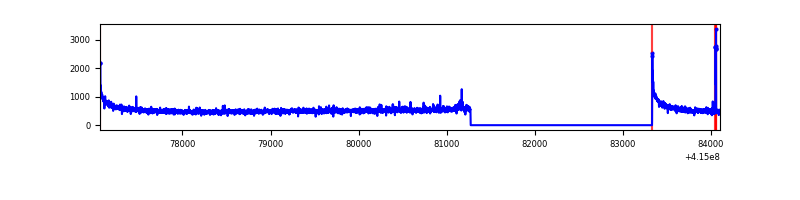 |
| B | 7042 | 4981 | 2 | 2 | 0.03% | 0.04% | 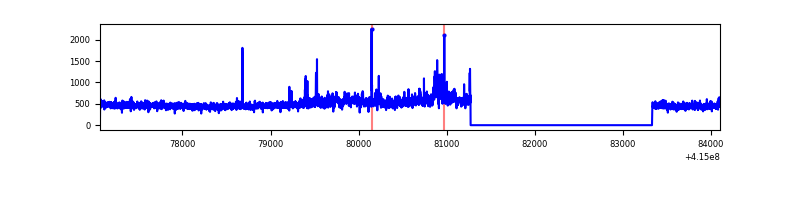 |
| C | 7042 | 4981 | 627 | 627 | 8.90% | 12.59% | 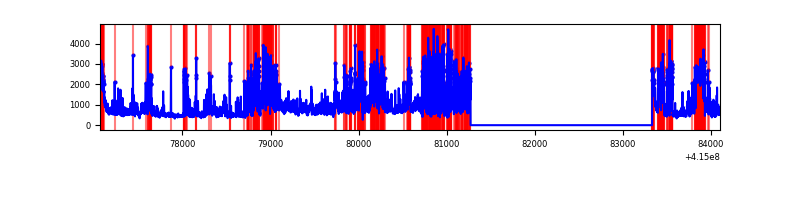 |
| D | 7042 | 4981 | 550 | 550 | 7.81% | 11.04% | 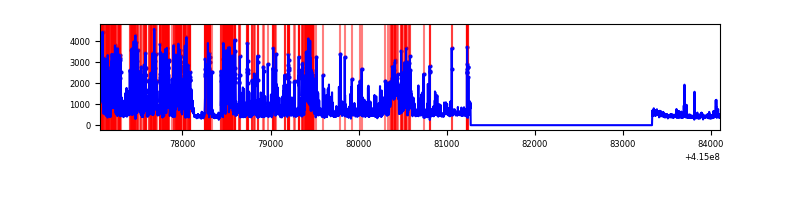 |
Top three noisy pixels from each quadrant. If the there are fewer than three noisy pixels in the level2.evt file, extra rows are filled as -1
| Pixel properties | Quadrant properties | ||||||
|---|---|---|---|---|---|---|---|
| Quadrant | DetID | PixID | Counts | Sigma | Mean | Median | Sigma |
| A | 10 | 83 | 441144 | 3823.28 | 561 | 552 | 115.2 |
| A | 2 | 79 | 23652 | 200.45 | 561 | 552 | 115.2 |
| A | 6 | 10 | 20500 | 173.1 | 561 | 552 | 115.2 |
| B | 0 | 189 | 226707 | 2084.38 | 561 | 548 | 108.5 |
| B | 5 | 63 | 56916 | 519.51 | 561 | 548 | 108.5 |
| B | 12 | 111 | 12899 | 113.83 | 561 | 548 | 108.5 |
| C | 9 | 187 | 2884613 | 23529.19 | 520 | 525 | 122.6 |
| C | 15 | 214 | 201630 | 1640.67 | 520 | 525 | 122.6 |
| C | 0 | 10 | 170835 | 1389.44 | 520 | 525 | 122.6 |
| D | 12 | 0 | 1555824 | 12051.94 | 515 | 501 | 129.1 |
| D | 1 | 47 | 501895 | 3885.22 | 515 | 501 | 129.1 |
| D | 12 | 227 | 321561 | 2487.84 | 515 | 501 | 129.1 |
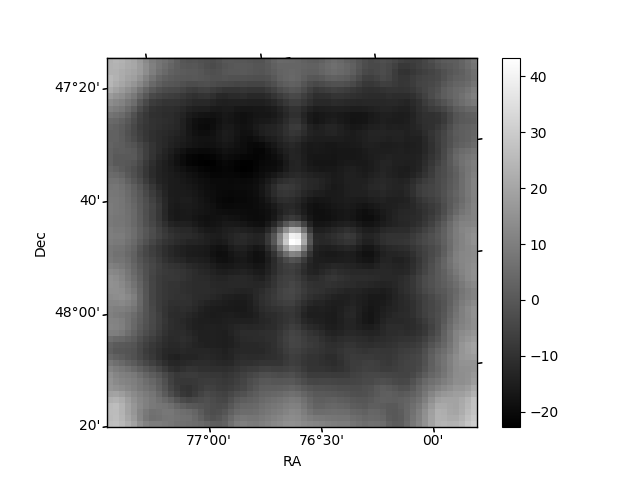
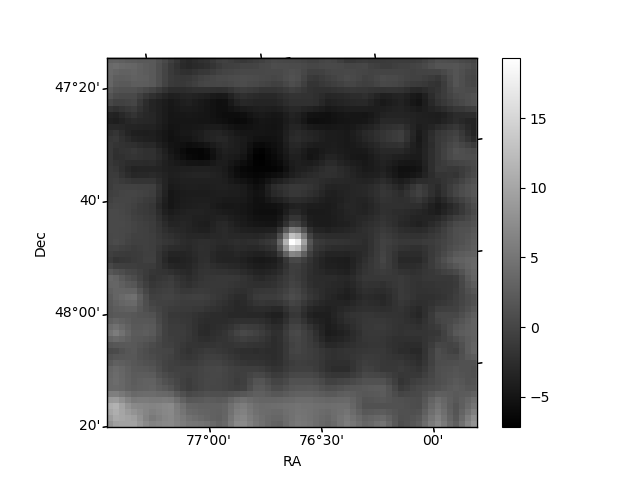
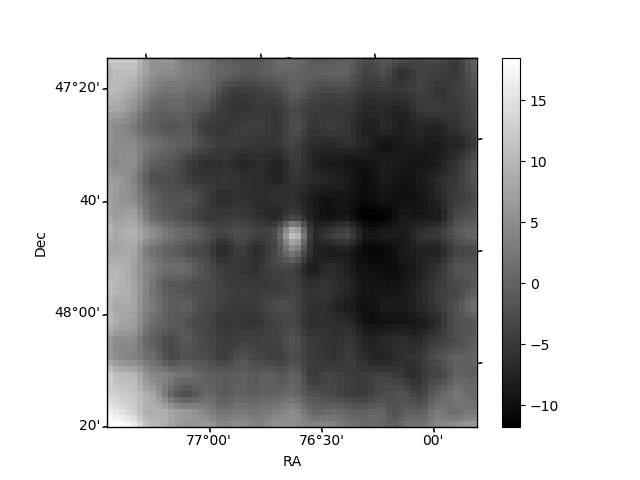
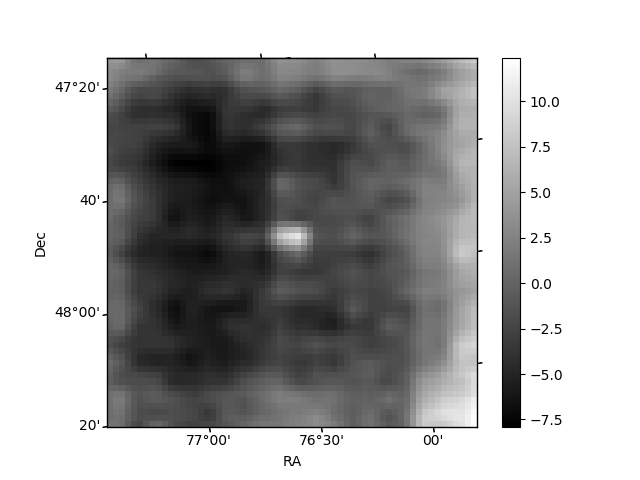
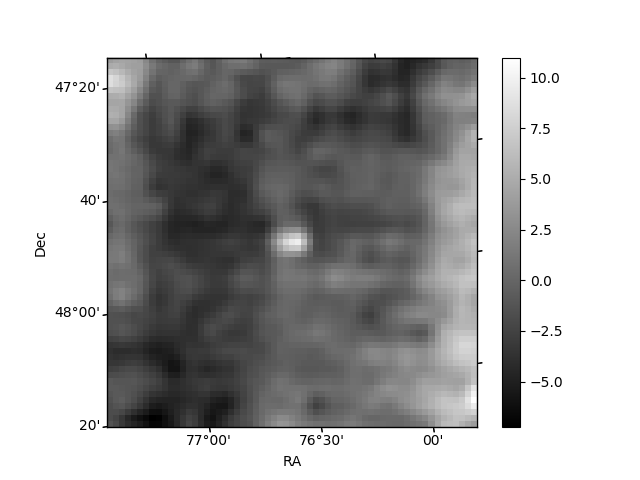
Histogram calculated using DETX and DETY for each event in the final _common_clean file
| Quadrant A | 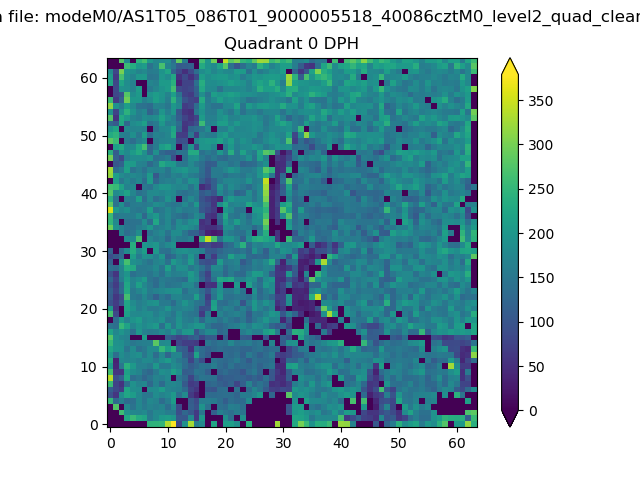 |
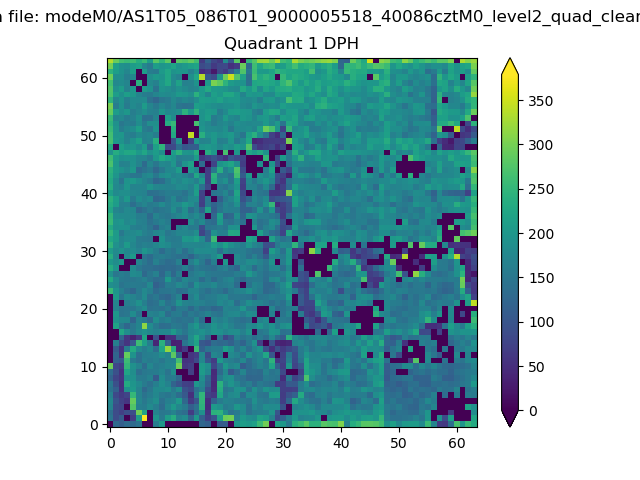 |
Quadrant B |
|---|---|---|---|
| Quadrant D | 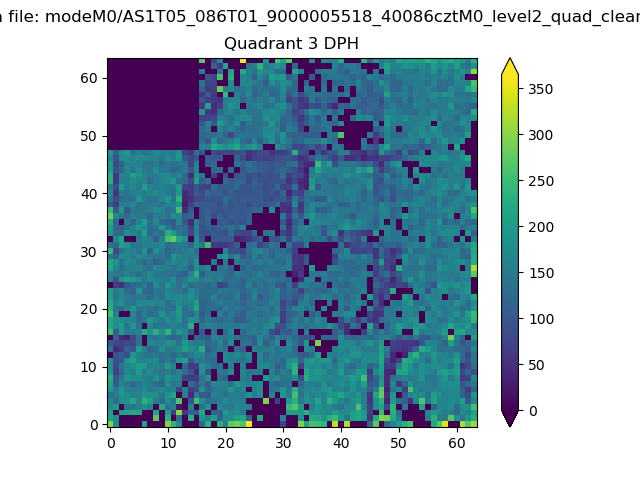 |
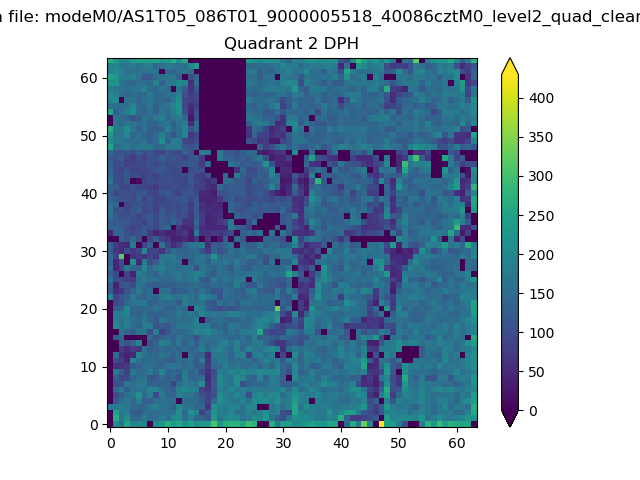 |
Quadrant C |
| Plot type | Count rate plots | Images |
|---|---|---|
| Comparison with Poisson distribution Blue bars denote a histogram of data divided into 1 sec bins. Red curve is a Poisson curve with rate = median count rate of data. |
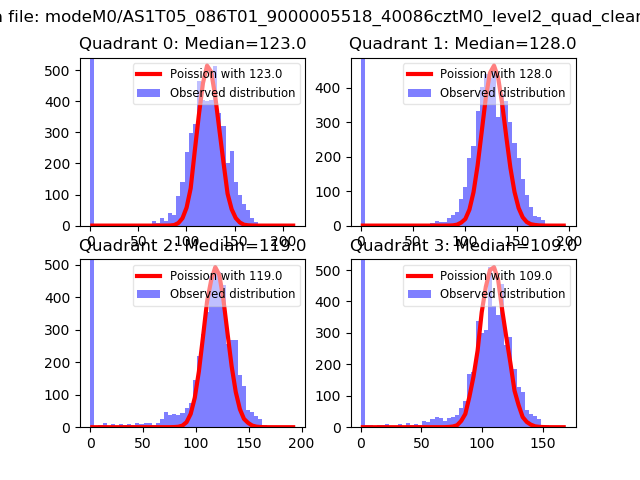 |
 |
| Quadrant-wise count rates Data is divided into 100 sec bins |
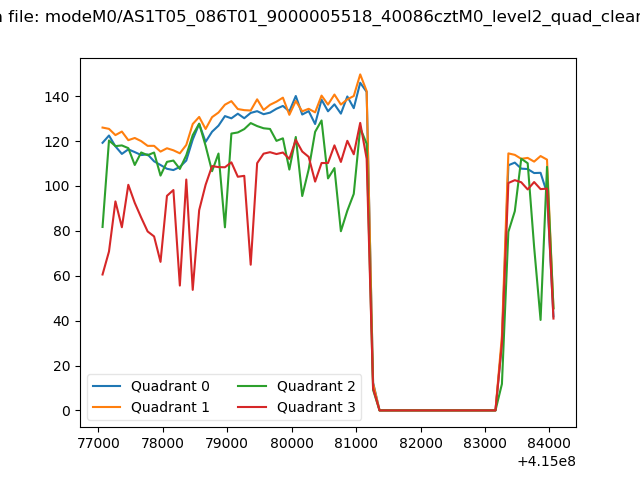 |
|
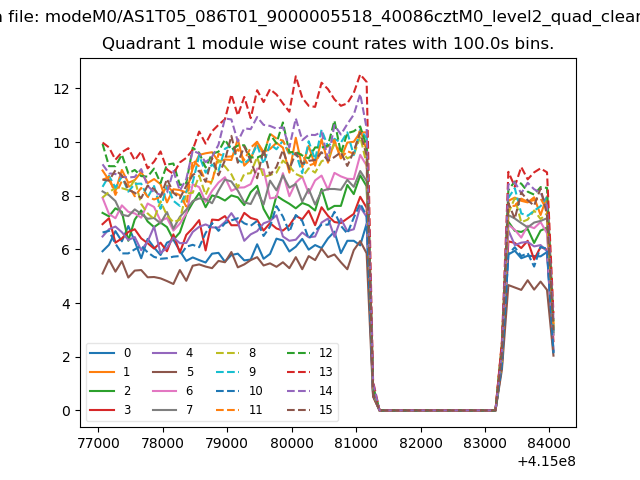
| Module-wise count rates for Quadrant A Data is divided into 100 sec bins |
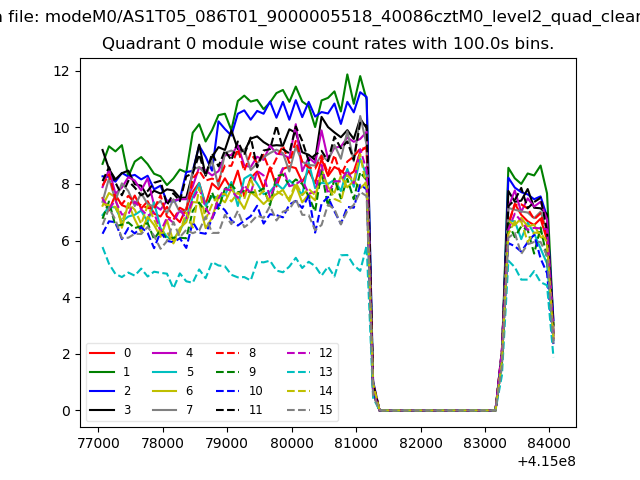 |
 |
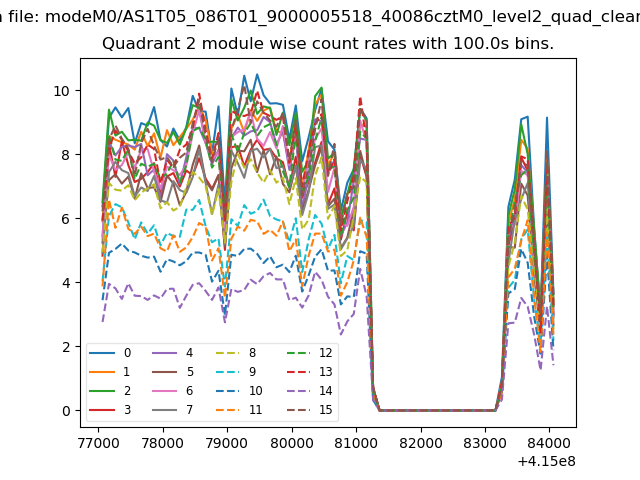
| Module-wise count rates for Quadrant B Data is divided into 100 sec bins |
 |
 |
| Module-wise count rates for Quadrant C Data is divided into 100 sec bins |
 |
 |
| Module-wise count rates for Quadrant D Data is divided into 100 sec bins |
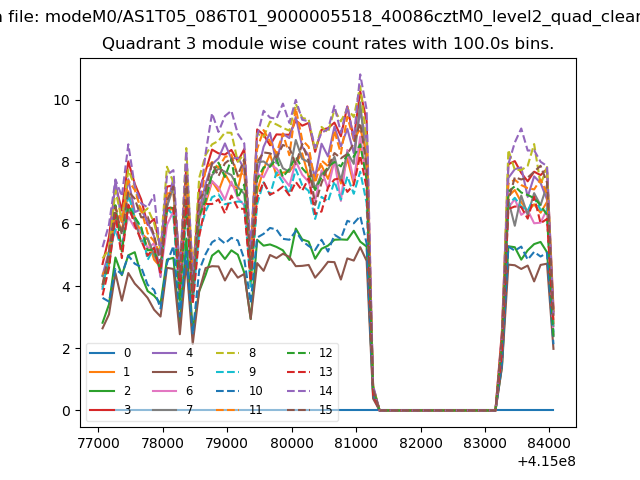 |
 |
| Parameter | Plot |
|---|---|
| CZT HV Monitor | 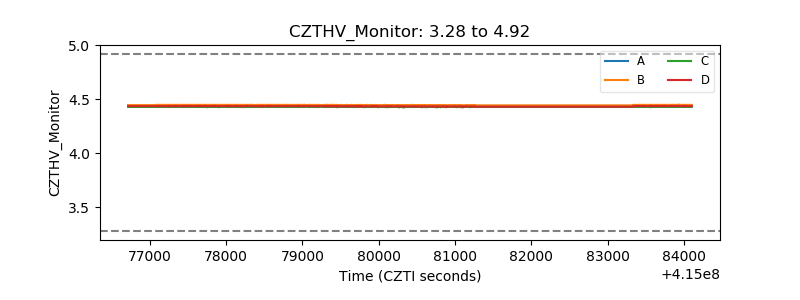 |
| D_VDD | 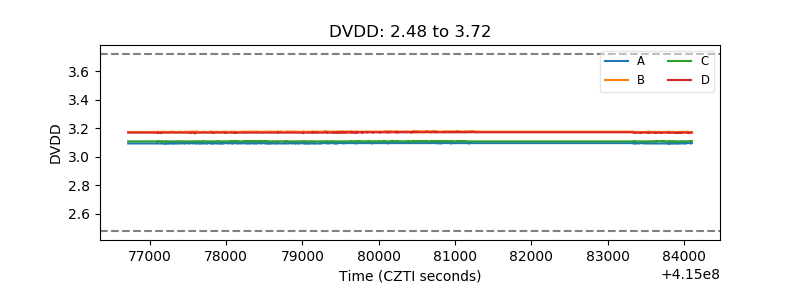 |
| Temperature 1 | 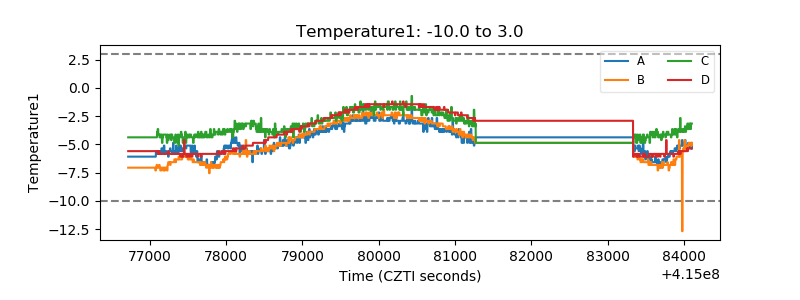 |
| Veto HV Monitor | 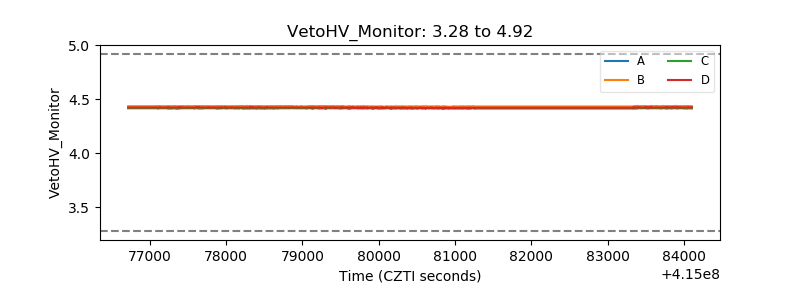 |
| Veto LLD | 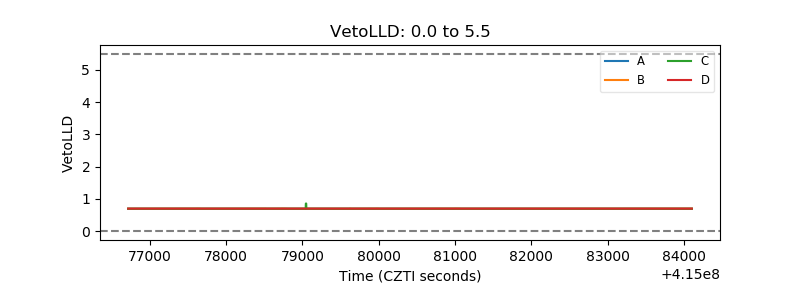 |
| Alpha Counter | 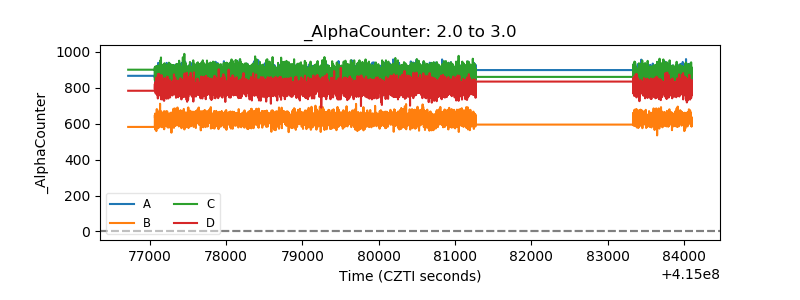 |
| _CPM_Rate | 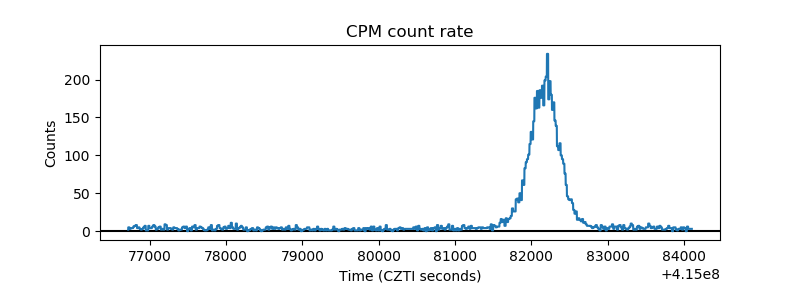 |
| CZT Counter | 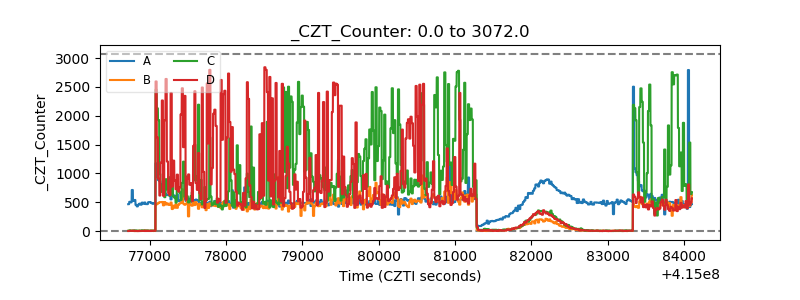 |
| +2.5 Volts monitor | 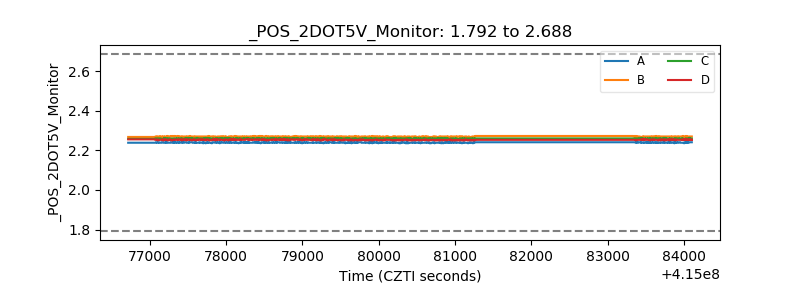 |
| +5 Volts monitor |  |
| _ROLL_ROT | 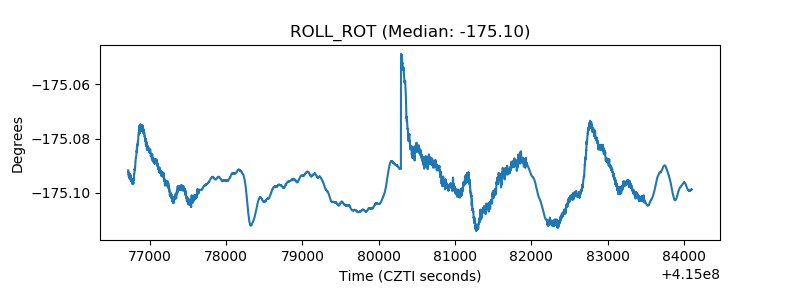 |
| _Roll_DEC | 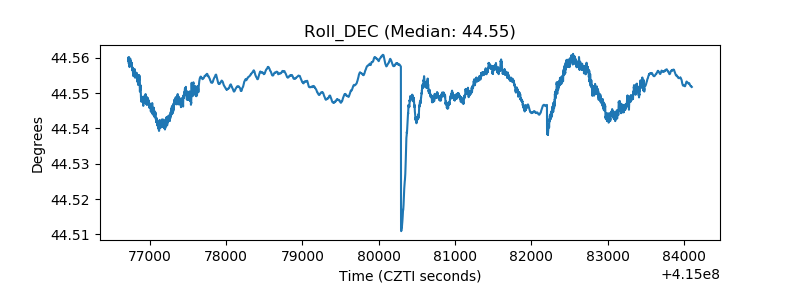 |
| _Roll_RA | 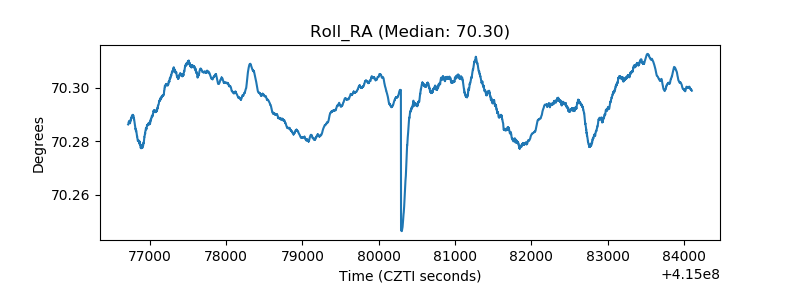 |
| Veto Counter | 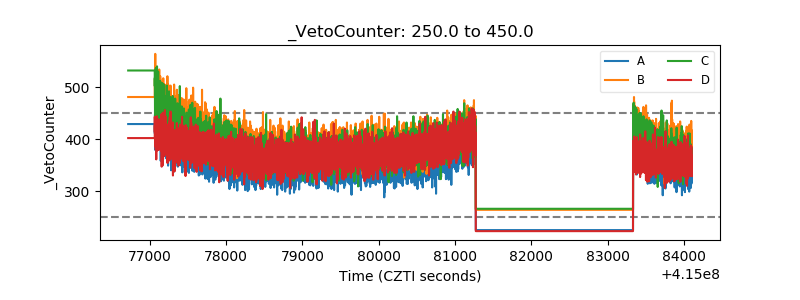 |