| Param | Original file | Final file |
|---|---|---|
| Filename | modeM0/AS1T05_086T01_9000005518_40087cztM0_level2.fits | modeM0/AS1T05_086T01_9000005518_40087cztM0_level2_quad_clean.evt |
| Size (bytes) | 458,182,080 | 101,787,840 |
| Size | 437.0 MB | 97.1 MB |
| Events in quadrant A | 3,103,056 | 713,152 |
| Events in quadrant B | 3,260,008 | 729,049 |
| Events in quadrant C | 6,486,208 | 620,456 |
| Events in quadrant D | 3,664,319 | 617,563 |
| Mode SS | |||
|---|---|---|---|
| Quadrant | BADHDUFLAG | Total packets | Discarded packets |
| A | 0 | 118 | 0 |
| B | 0 | 118 | 0 |
| C | 0 | 118 | 0 |
| D | 0 | 118 | 0 |
| Mode M0 | |||
|---|---|---|---|
| Quadrant | BADHDUFLAG | Total packets | Discarded packets |
| A | 0 | 12470 | 3 |
| B | 0 | 13403 | 2 |
| C | 0 | 23251 | 2 |
| D | 0 | 14743 | 2 |
| Mode M9 | |||
|---|---|---|---|
| Quadrant | BADHDUFLAG | Total packets | Discarded packets |
| A | 0 | 39 | 0 |
| B | 0 | 39 | 0 |
| C | 0 | 39 | 0 |
| D | 0 | 39 | 0 |
| Quadrant | Total seconds | Saturated seconds | Saturation percentage |
|---|---|---|---|
| A | 5752 | 28 | 0.486787% |
| B | 5752 | 57 | 0.990960% |
| C | 5752 | 865 | 15.038248% |
| D | 5752 | 176 | 3.059805% |
Noise dominated data is calculated using 1-second bins in cleaned event files. If a bin has >2000 counts, and if more than 50% of those come from <1% of pixels, then it is considered to be noise-dominated and hence unusable.
| Quadrant | # 1 sec bins | Bins with >0 counts | Bins with >2000 counts | High rate bins dominated by noise | Noise dominated (total time) | Noise dominated (detector-on time) | Marked lightcurve |
|---|---|---|---|---|---|---|---|
| A | 9606 | 5754 | 21 | 21 | 0.22% | 0.36% | 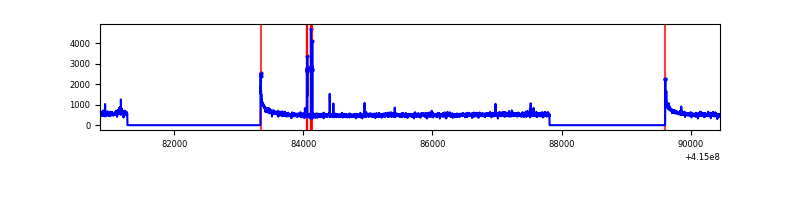 |
| B | 9606 | 5754 | 56 | 56 | 0.58% | 0.97% | 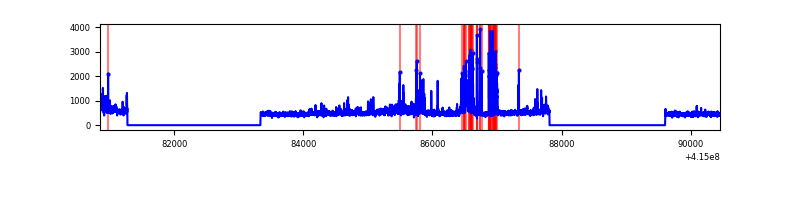 |
| C | 9606 | 5754 | 810 | 810 | 8.43% | 14.08% | 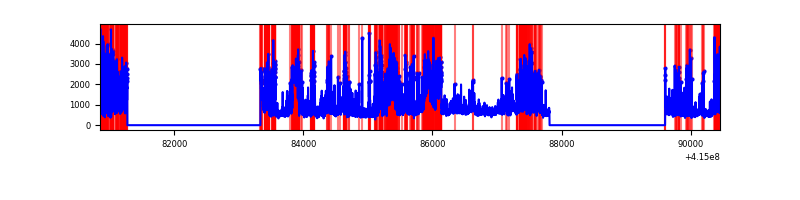 |
| D | 9606 | 5754 | 151 | 151 | 1.57% | 2.62% | 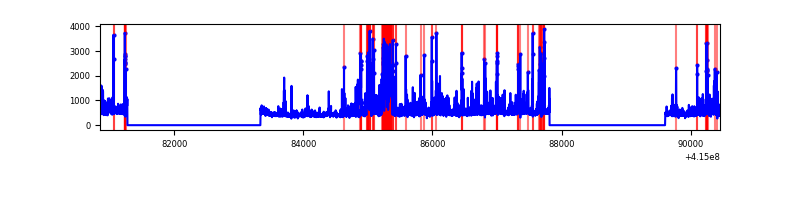 |
Top three noisy pixels from each quadrant. If the there are fewer than three noisy pixels in the level2.evt file, extra rows are filled as -1
| Pixel properties | Quadrant properties | ||||||
|---|---|---|---|---|---|---|---|
| Quadrant | DetID | PixID | Counts | Sigma | Mean | Median | Sigma |
| A | 10 | 83 | 483644 | 3594.55 | 651 | 640 | 134.4 |
| A | 6 | 10 | 55894 | 411.2 | 651 | 640 | 134.4 |
| A | 2 | 79 | 18870 | 135.67 | 651 | 640 | 134.4 |
| B | 0 | 189 | 510372 | 4059.35 | 647 | 632 | 125.6 |
| B | 15 | 201 | 143160 | 1135.03 | 647 | 632 | 125.6 |
| B | 5 | 63 | 21803 | 168.6 | 647 | 632 | 125.6 |
| C | 9 | 187 | 3121370 | 21978.02 | 601 | 607 | 142.0 |
| C | 15 | 208 | 583710 | 4106.51 | 601 | 607 | 142.0 |
| C | 15 | 214 | 230427 | 1618.51 | 601 | 607 | 142.0 |
| D | 12 | 0 | 391526 | 2520.22 | 624 | 608 | 155.1 |
| D | 12 | 227 | 369597 | 2378.85 | 624 | 608 | 155.1 |
| D | 9 | 19 | 142856 | 917.06 | 624 | 608 | 155.1 |
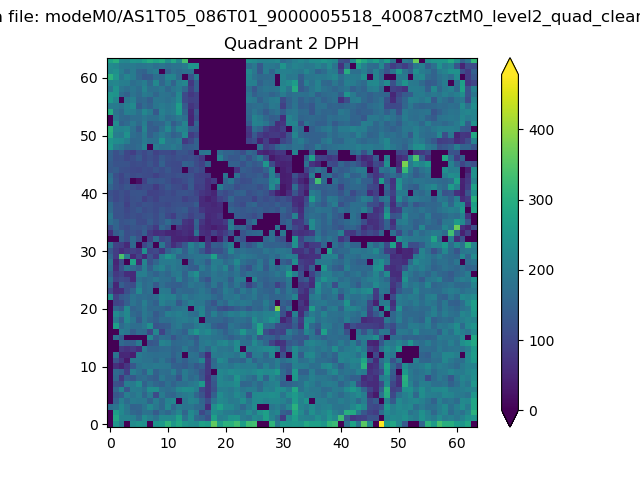
Histogram calculated using DETX and DETY for each event in the final _common_clean file
| Quadrant A | 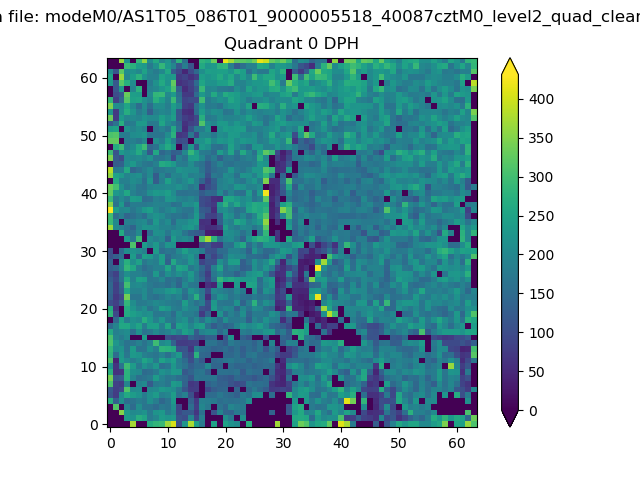 |
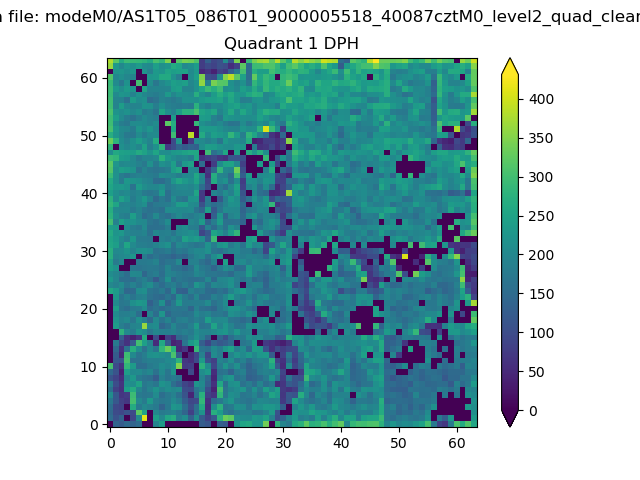 |
Quadrant B |
|---|---|---|---|
| Quadrant D | 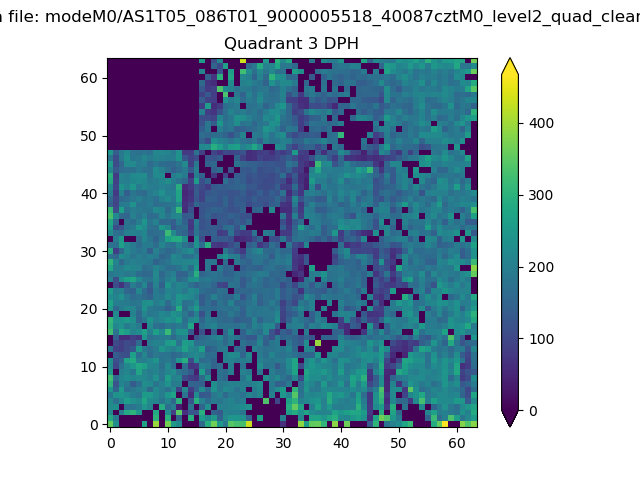 |
 |
Quadrant C |
| Plot type | Count rate plots | Images |
|---|---|---|
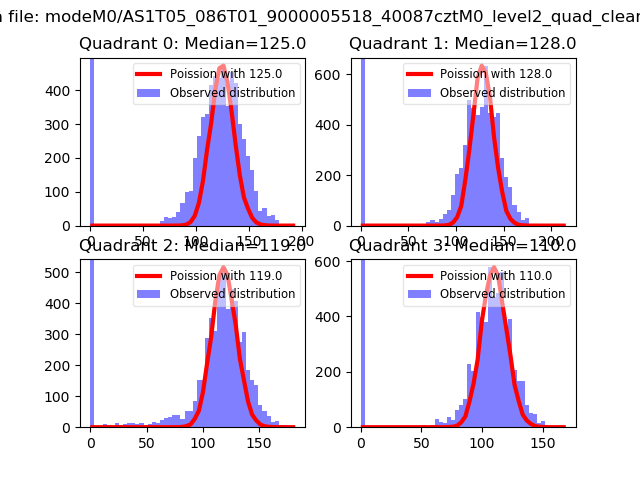
| Comparison with Poisson distribution Blue bars denote a histogram of data divided into 1 sec bins. Red curve is a Poisson curve with rate = median count rate of data. |
 |
 |
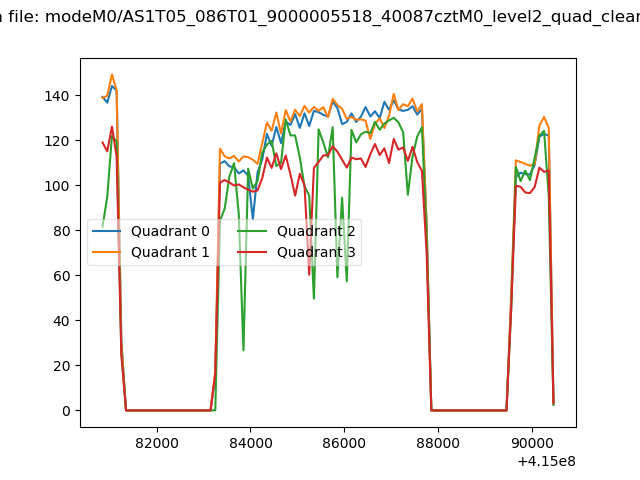
| Quadrant-wise count rates Data is divided into 100 sec bins |
 |
|
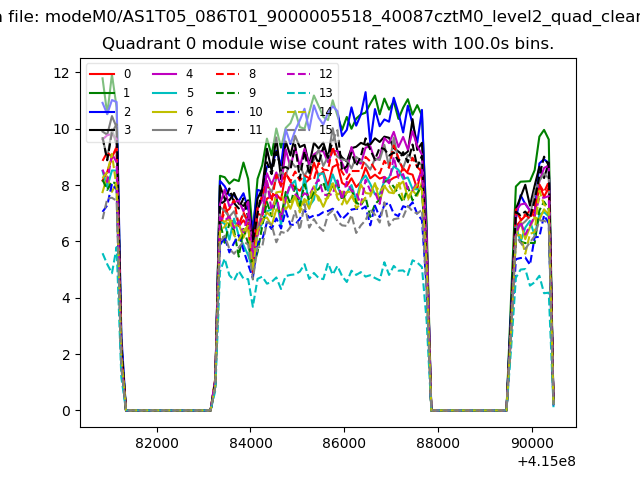
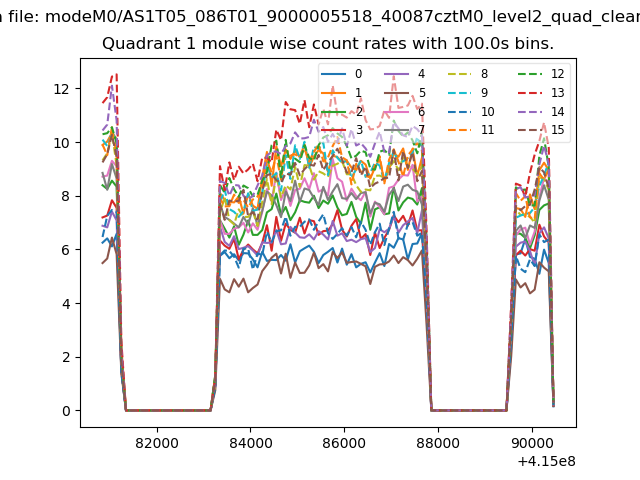
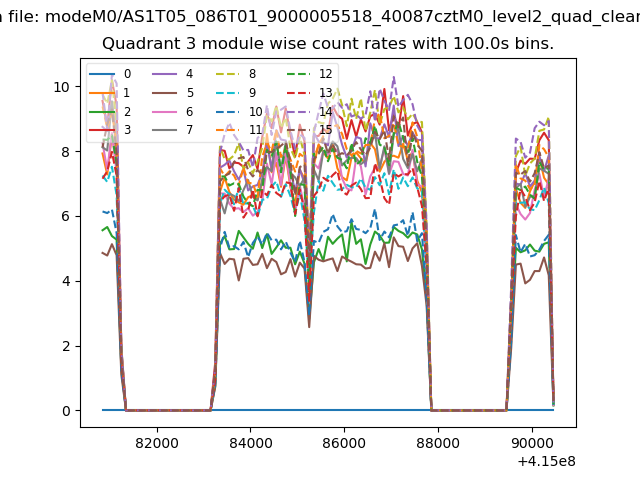
| Module-wise count rates for Quadrant A Data is divided into 100 sec bins |
 |
 |
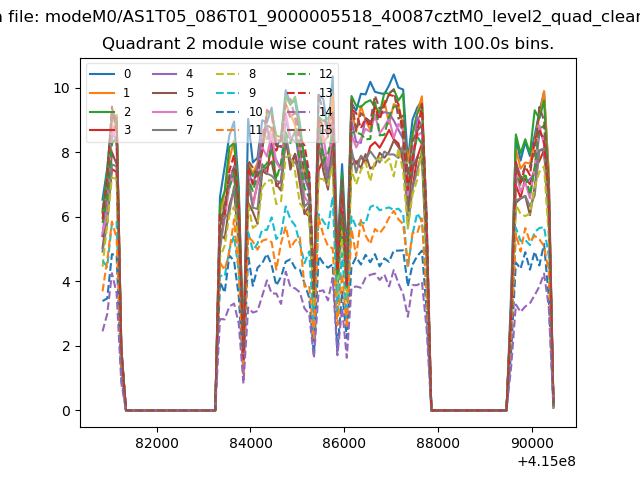
| Module-wise count rates for Quadrant B Data is divided into 100 sec bins |
 |
 |
| Module-wise count rates for Quadrant C Data is divided into 100 sec bins |
 |
 |
| Module-wise count rates for Quadrant D Data is divided into 100 sec bins |
 |
 |
| Parameter | Plot |
|---|---|
| CZT HV Monitor | 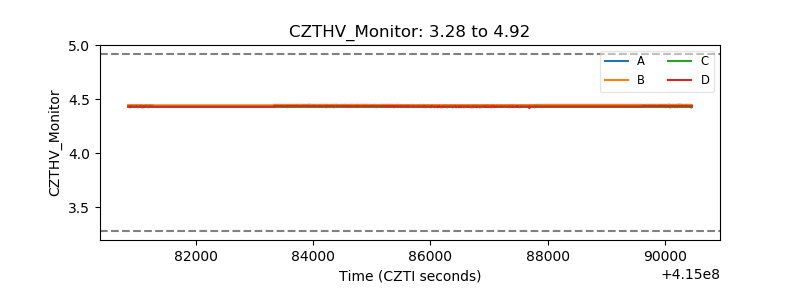 |
| D_VDD | 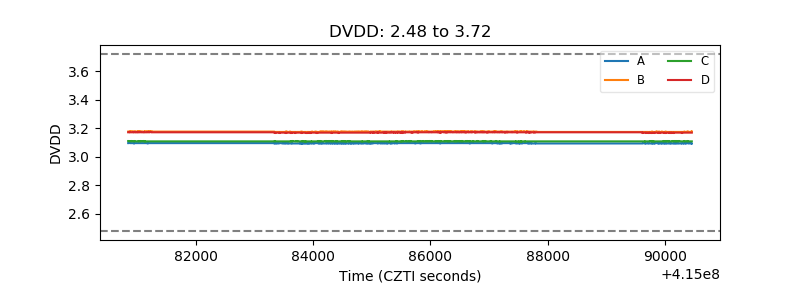 |
| Temperature 1 | 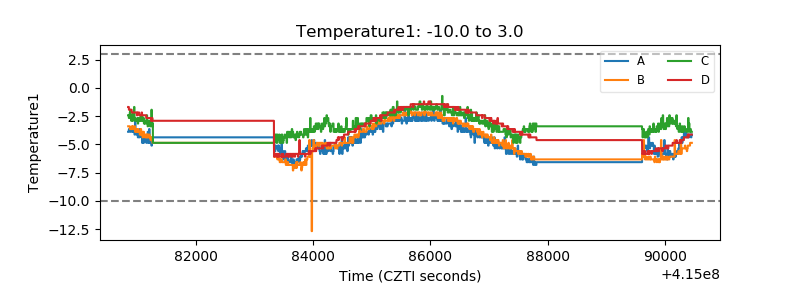 |
| Veto HV Monitor | 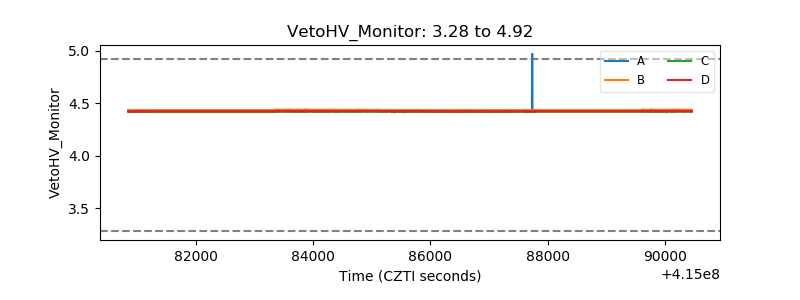 |
| Veto LLD | 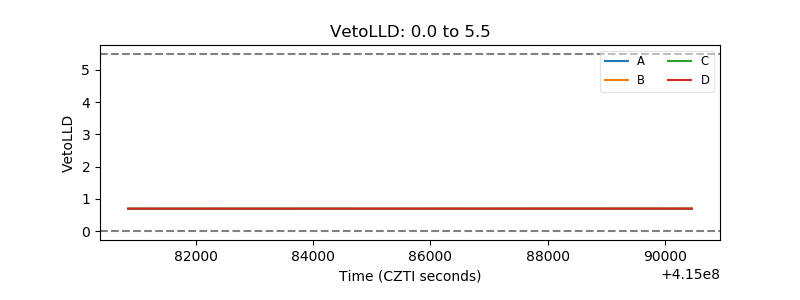 |
| Alpha Counter | 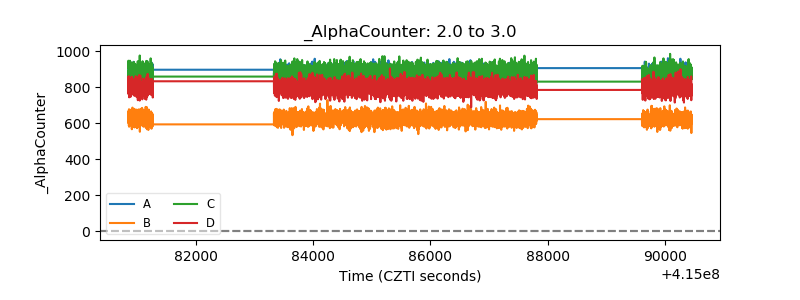 |
| _CPM_Rate |  |
| CZT Counter | 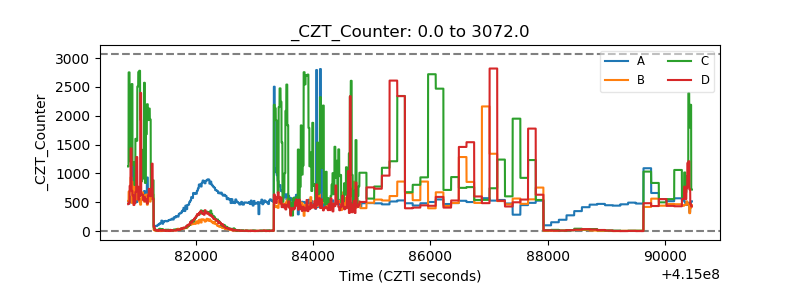 |
| +2.5 Volts monitor | 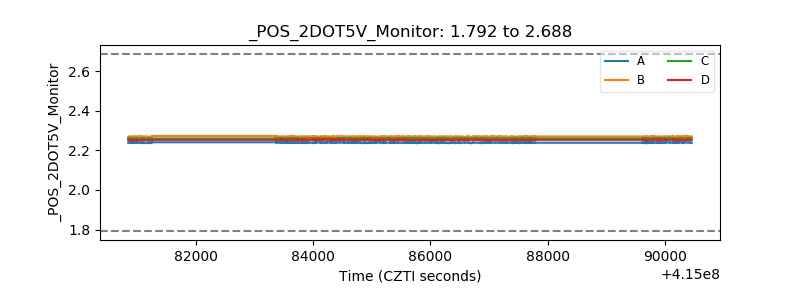 |
| +5 Volts monitor |  |
| _ROLL_ROT | 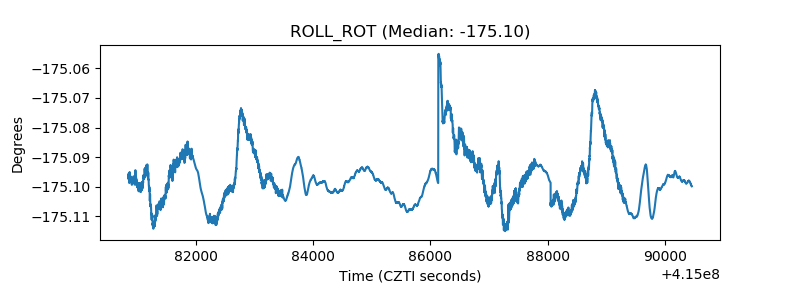 |
| _Roll_DEC | 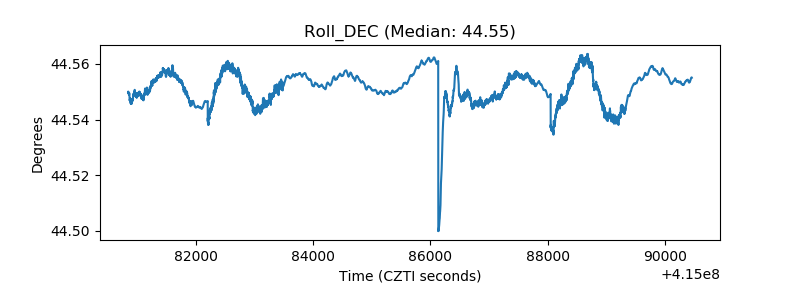 |
| _Roll_RA | 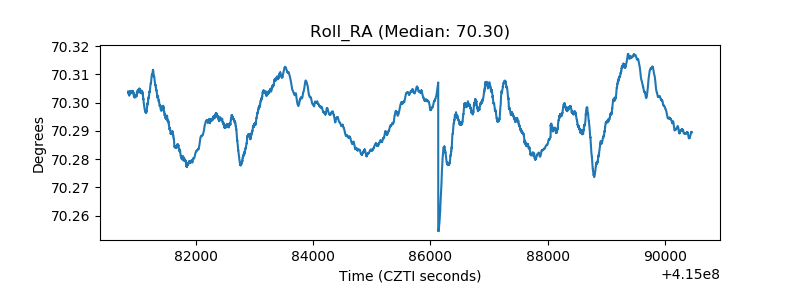 |
| Veto Counter | 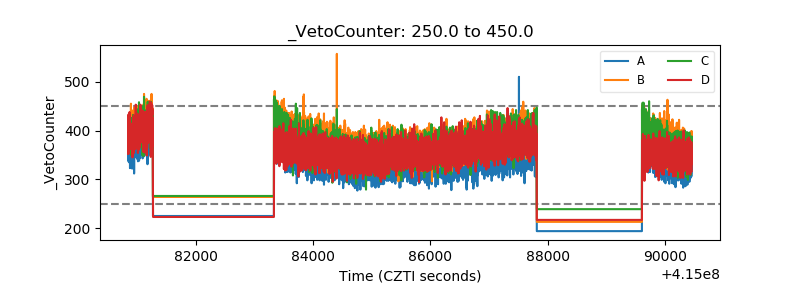 |