| Param | Original file | Final file |
|---|---|---|
| Filename | modeM0/AS1T05_086T01_9000005518_40088cztM0_level2.fits | modeM0/AS1T05_086T01_9000005518_40088cztM0_level2_quad_clean.evt |
| Size (bytes) | 459,069,120 | 100,229,760 |
| Size | 437.8 MB | 95.6 MB |
| Events in quadrant A | 2,989,907 | 704,897 |
| Events in quadrant B | 2,807,107 | 721,256 |
| Events in quadrant C | 5,969,643 | 631,055 |
| Events in quadrant D | 4,785,045 | 580,031 |
| Mode SS | |||
|---|---|---|---|
| Quadrant | BADHDUFLAG | Total packets | Discarded packets |
| A | 0 | 116 | 0 |
| B | 0 | 116 | 0 |
| C | 0 | 116 | 0 |
| D | 0 | 116 | 0 |
| Mode M0 | |||
|---|---|---|---|
| Quadrant | BADHDUFLAG | Total packets | Discarded packets |
| A | 0 | 12126 | 3 |
| B | 0 | 11933 | 2 |
| C | 0 | 21677 | 2 |
| D | 0 | 18118 | 2 |
| Mode M9 | |||
|---|---|---|---|
| Quadrant | BADHDUFLAG | Total packets | Discarded packets |
| A | 0 | 21 | 0 |
| B | 0 | 21 | 0 |
| C | 0 | 21 | 0 |
| D | 0 | 22 | 0 |
| Quadrant | Total seconds | Saturated seconds | Saturation percentage |
|---|---|---|---|
| A | 5687 | 10 | 0.175840% |
| B | 5687 | 25 | 0.439599% |
| C | 5687 | 614 | 10.796554% |
| D | 5687 | 470 | 8.264463% |
Noise dominated data is calculated using 1-second bins in cleaned event files. If a bin has >2000 counts, and if more than 50% of those come from <1% of pixels, then it is considered to be noise-dominated and hence unusable.
| Quadrant | # 1 sec bins | Bins with >0 counts | Bins with >2000 counts | High rate bins dominated by noise | Noise dominated (total time) | Noise dominated (detector-on time) | Marked lightcurve |
|---|---|---|---|---|---|---|---|
| A | 7150 | 5688 | 3 | 3 | 0.04% | 0.05% | 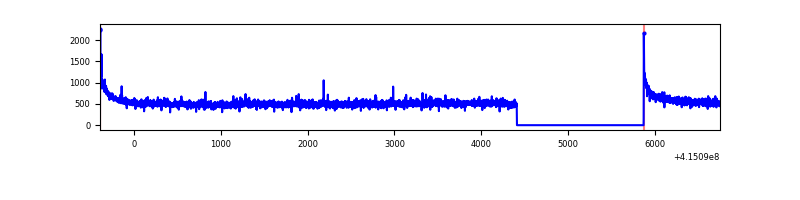 |
| B | 7150 | 5688 | 17 | 17 | 0.24% | 0.30% | 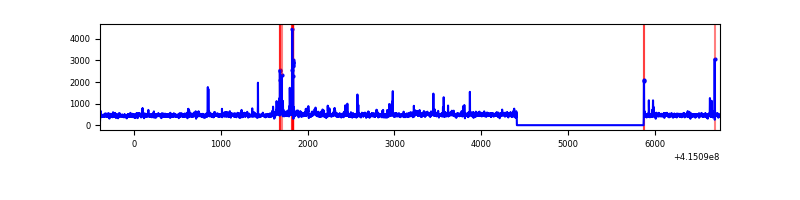 |
| C | 7150 | 5688 | 583 | 583 | 8.15% | 10.25% | 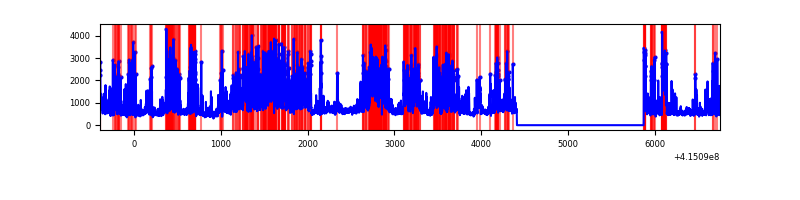 |
| D | 7150 | 5688 | 439 | 439 | 6.14% | 7.72% | 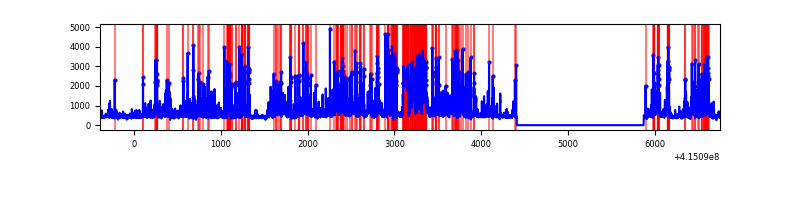 |
Top three noisy pixels from each quadrant. If the there are fewer than three noisy pixels in the level2.evt file, extra rows are filled as -1
| Pixel properties | Quadrant properties | ||||||
|---|---|---|---|---|---|---|---|
| Quadrant | DetID | PixID | Counts | Sigma | Mean | Median | Sigma |
| A | 10 | 83 | 479003 | 3558.89 | 640 | 629 | 134.4 |
| A | 2 | 79 | 15521 | 110.79 | 640 | 629 | 134.4 |
| A | 13 | 6 | 14802 | 105.44 | 640 | 629 | 134.4 |
| B | 0 | 189 | 198410 | 1574.07 | 634 | 618 | 125.7 |
| B | 5 | 32 | 49354 | 387.85 | 634 | 618 | 125.7 |
| B | 0 | 230 | 25435 | 197.5 | 634 | 618 | 125.7 |
| C | 9 | 187 | 3064300 | 21509.59 | 601 | 608 | 142.4 |
| C | 15 | 214 | 228160 | 1597.6 | 601 | 608 | 142.4 |
| C | 3 | 233 | 146679 | 1025.54 | 601 | 608 | 142.4 |
| D | 2 | 249 | 976736 | 6577.64 | 594 | 578 | 148.4 |
| D | 12 | 0 | 611606 | 4117.29 | 594 | 578 | 148.4 |
| D | 12 | 227 | 423509 | 2849.84 | 594 | 578 | 148.4 |
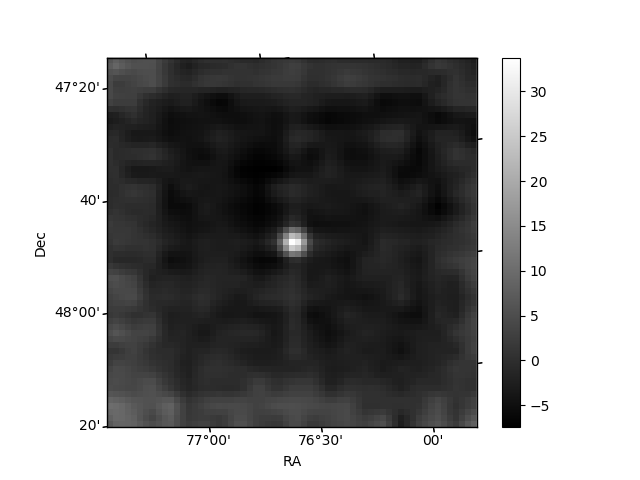
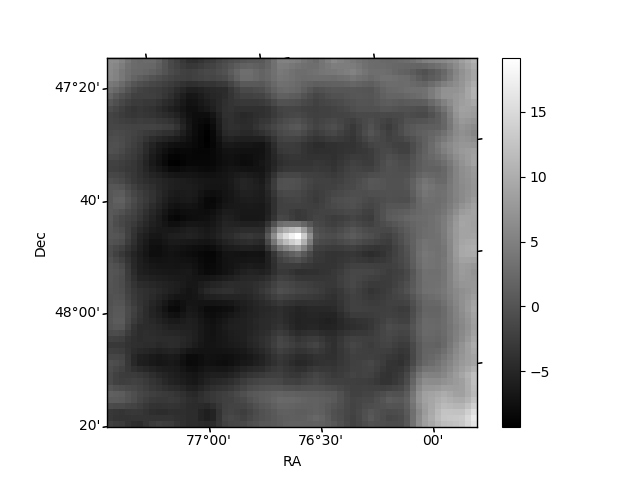
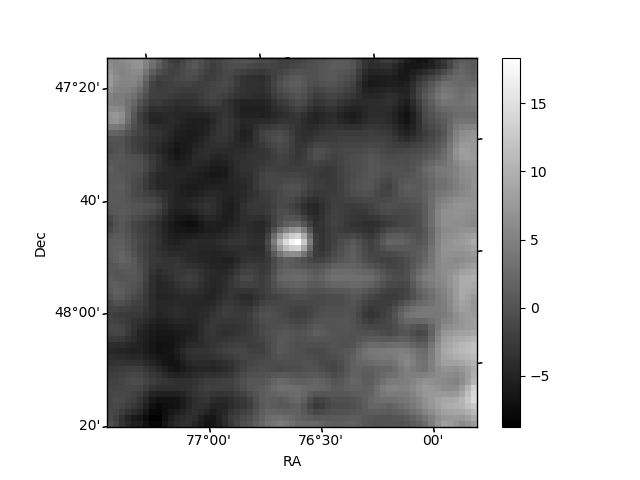
Histogram calculated using DETX and DETY for each event in the final _common_clean file
| Quadrant A | 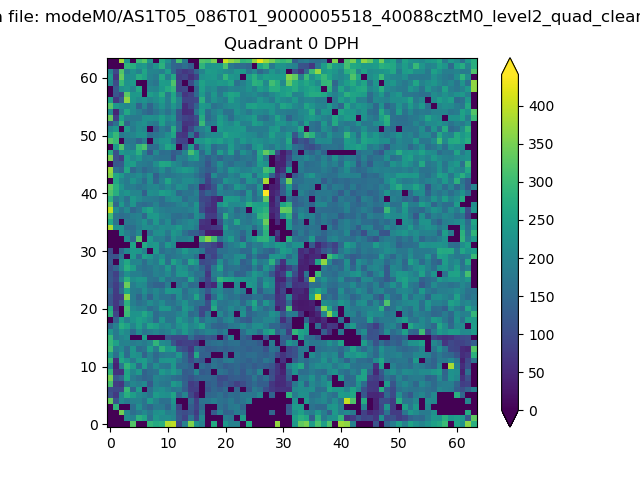 |
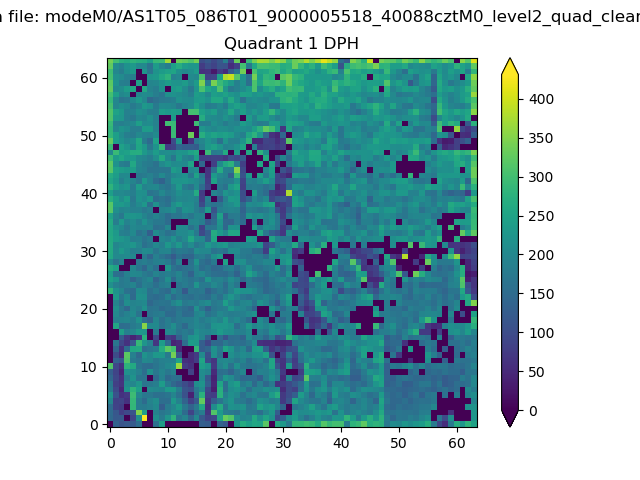 |
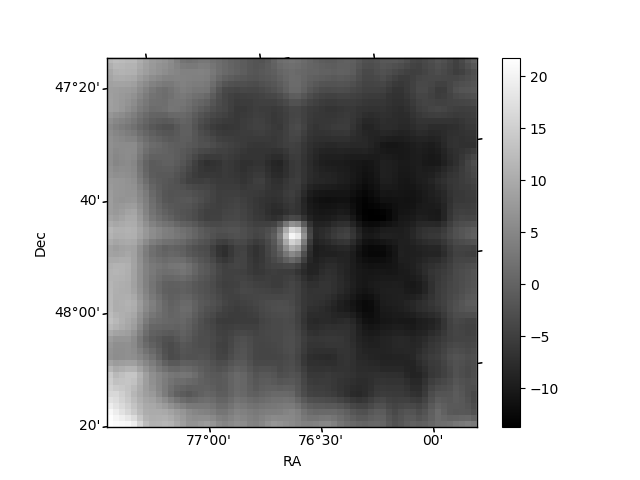
Quadrant B |
|---|---|---|---|
| Quadrant D | 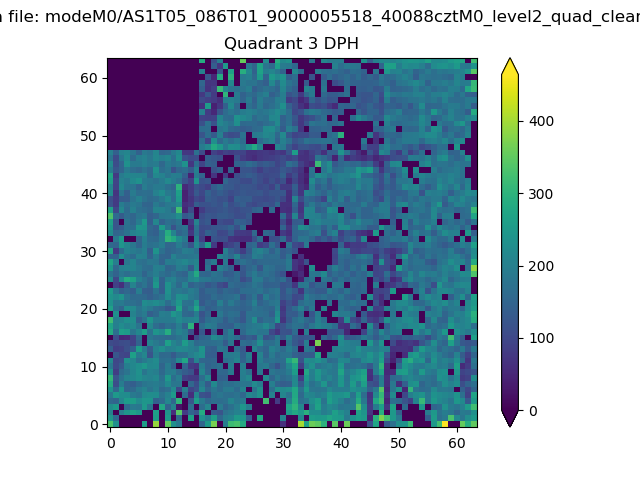 |
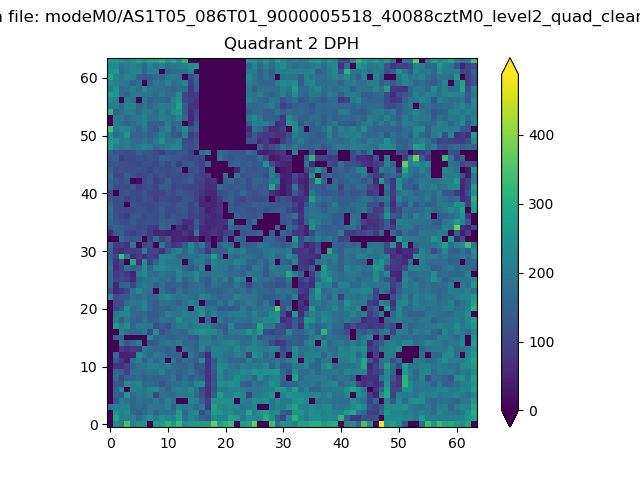 |
Quadrant C |
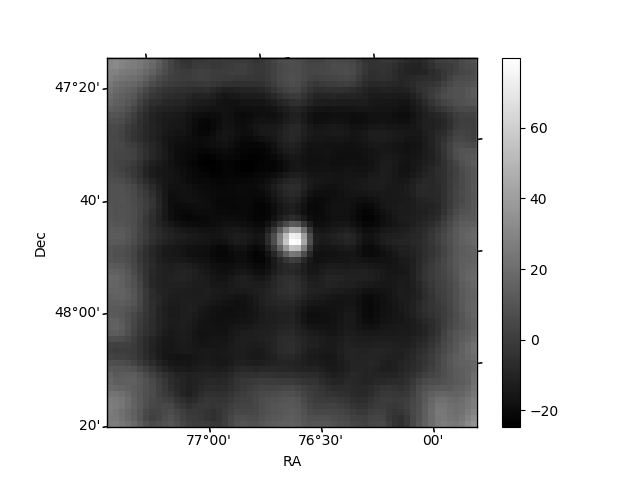
| Plot type | Count rate plots | Images |
|---|---|---|
| Comparison with Poisson distribution Blue bars denote a histogram of data divided into 1 sec bins. Red curve is a Poisson curve with rate = median count rate of data. |
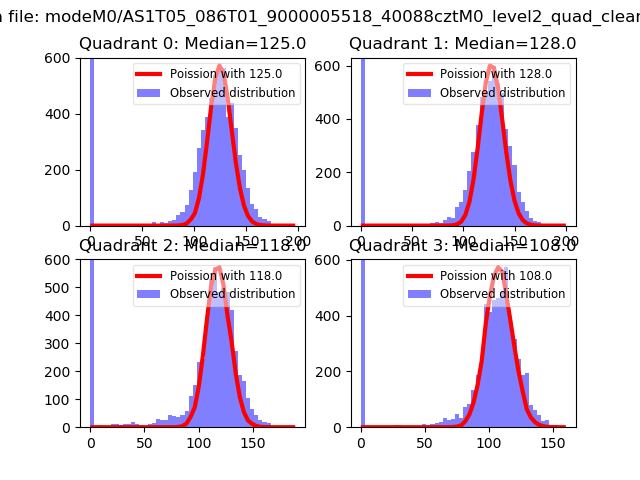 |
 |
| Quadrant-wise count rates Data is divided into 100 sec bins |
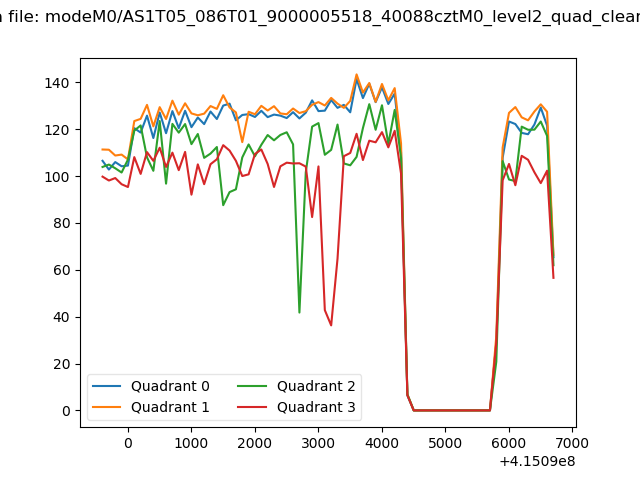 |
|
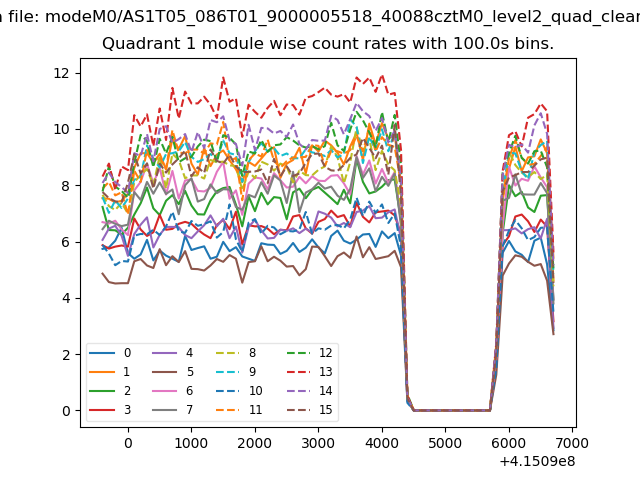
| Module-wise count rates for Quadrant A Data is divided into 100 sec bins |
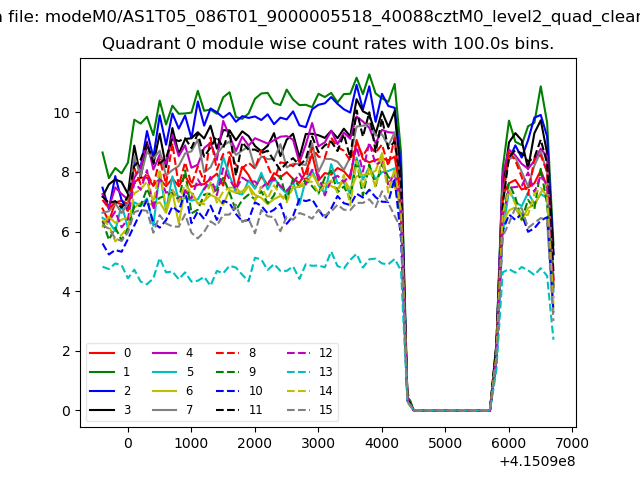 |
 |
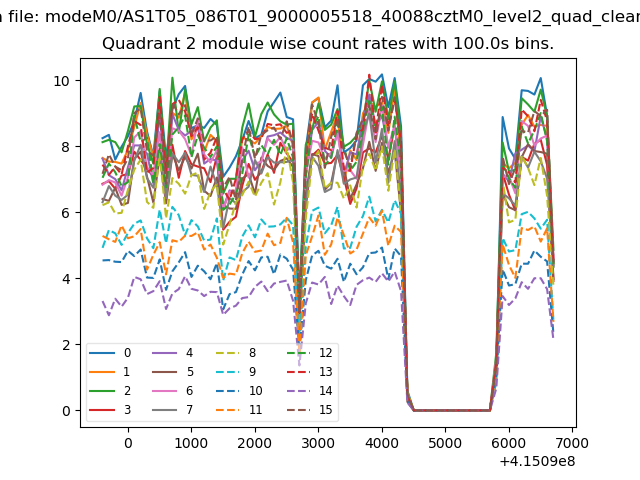
| Module-wise count rates for Quadrant B Data is divided into 100 sec bins |
 |
 |
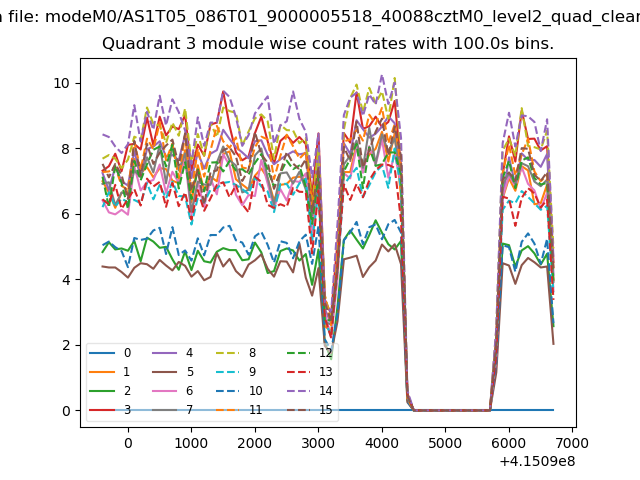
| Module-wise count rates for Quadrant C Data is divided into 100 sec bins |
 |
 |
| Module-wise count rates for Quadrant D Data is divided into 100 sec bins |
 |
 |
| Parameter | Plot |
|---|---|
| CZT HV Monitor | 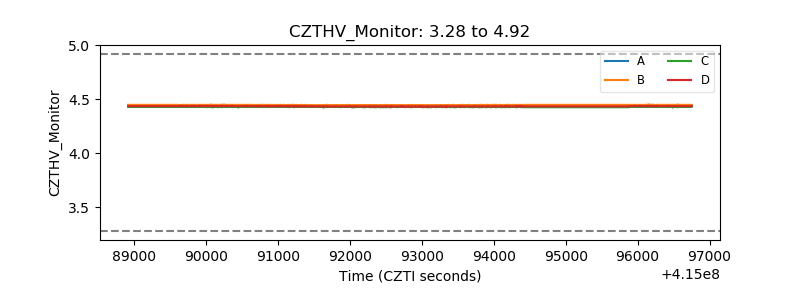 |
| D_VDD | 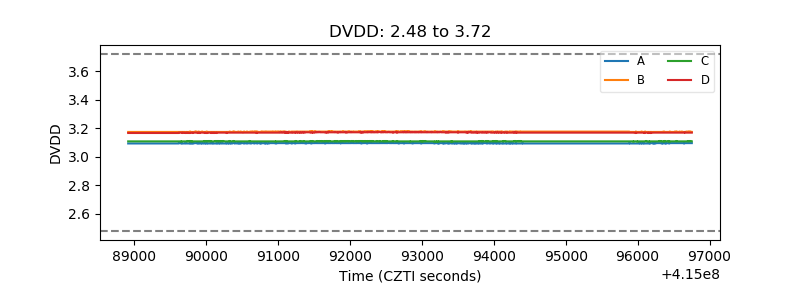 |
| Temperature 1 | 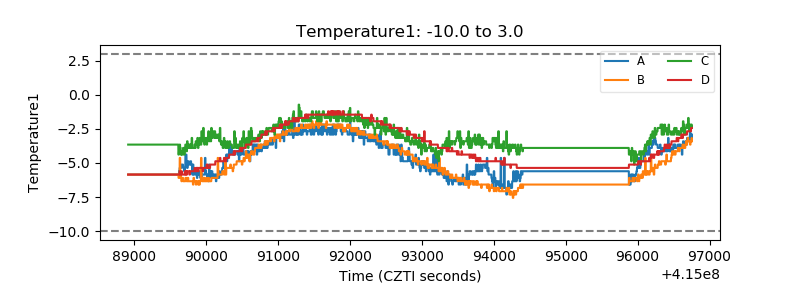 |
| Veto HV Monitor | 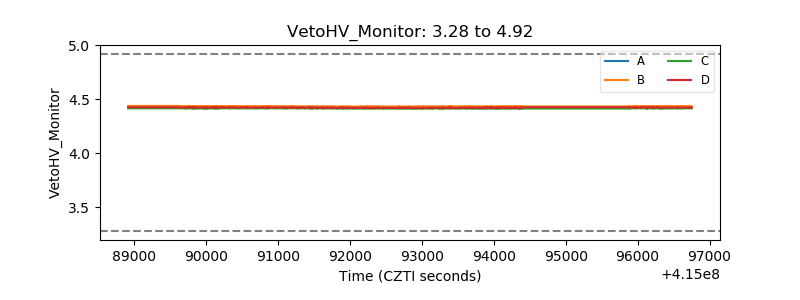 |
| Veto LLD | 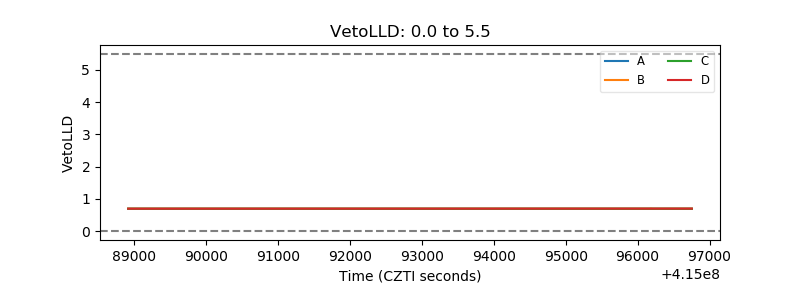 |
| Alpha Counter | 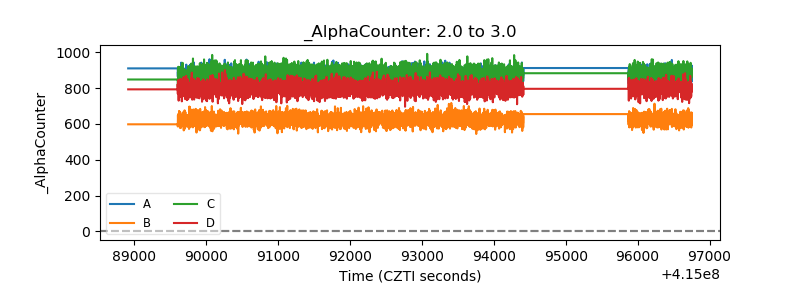 |
| _CPM_Rate | 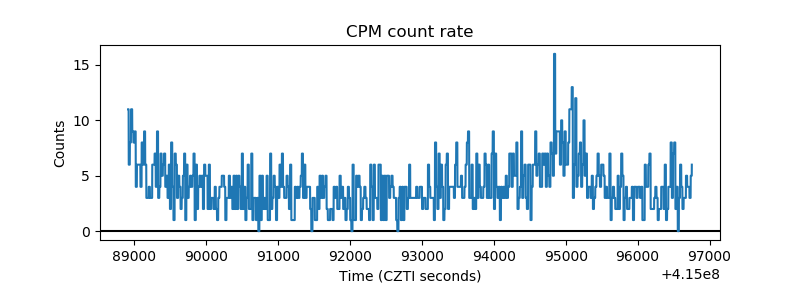 |
| CZT Counter | 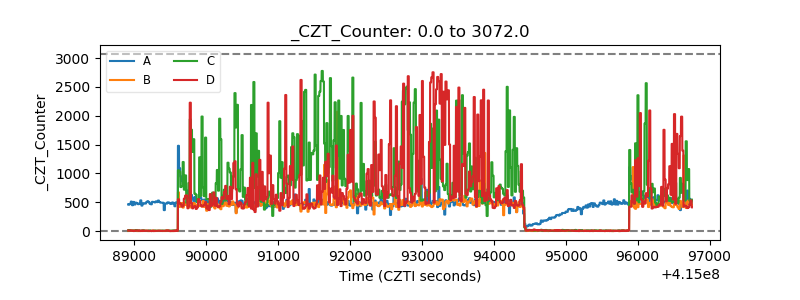 |
| +2.5 Volts monitor | 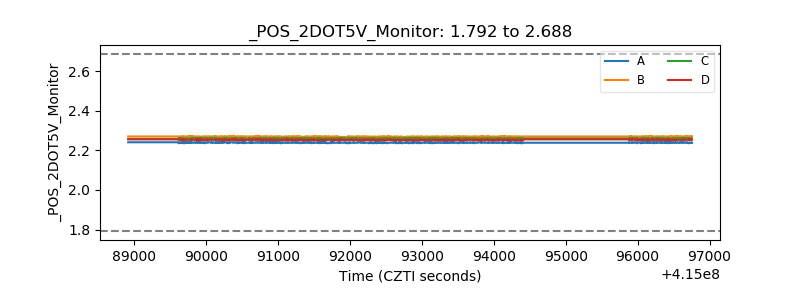 |
| +5 Volts monitor |  |
| _ROLL_ROT | 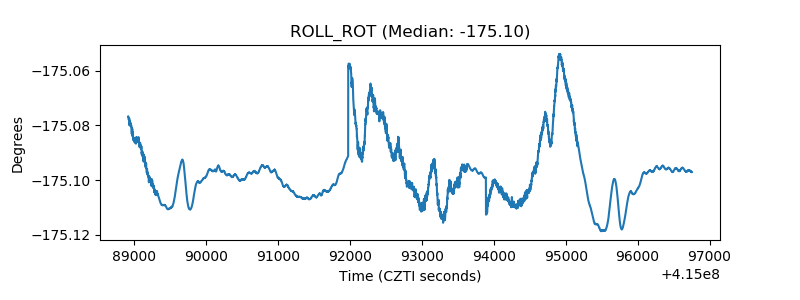 |
| _Roll_DEC | 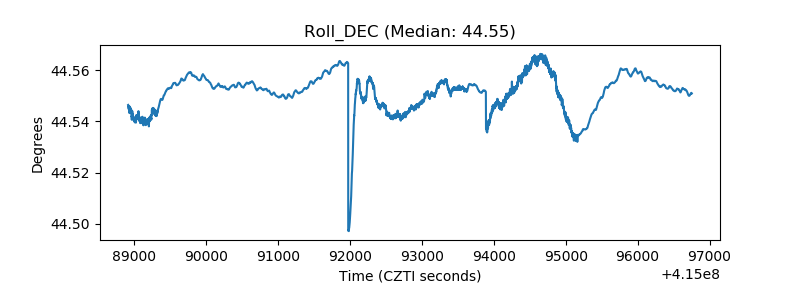 |
| _Roll_RA | 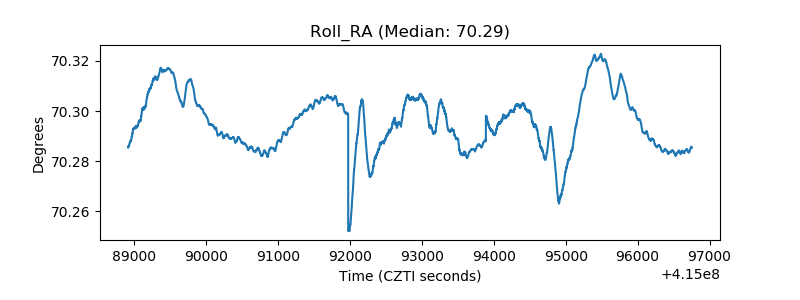 |
| Veto Counter | 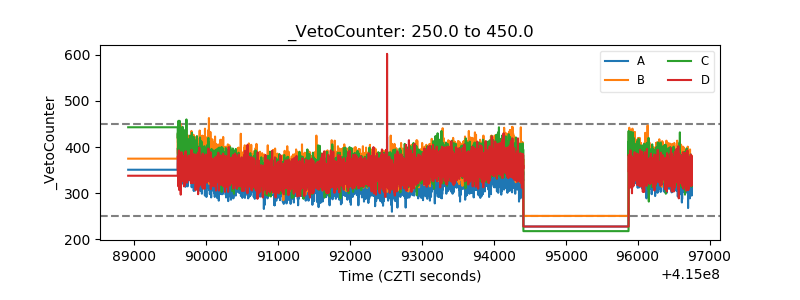 |