| Param | Original file | Final file |
|---|---|---|
| Filename | modeM0/AS1T05_086T01_9000005518_40089cztM0_level2.fits | modeM0/AS1T05_086T01_9000005518_40089cztM0_level2_quad_clean.evt |
| Size (bytes) | 470,897,280 | 97,433,280 |
| Size | 449.1 MB | 92.9 MB |
| Events in quadrant A | 3,113,133 | 700,147 |
| Events in quadrant B | 2,558,707 | 715,304 |
| Events in quadrant C | 5,303,408 | 633,105 |
| Events in quadrant D | 6,016,745 | 506,111 |
| Mode SS | |||
|---|---|---|---|
| Quadrant | BADHDUFLAG | Total packets | Discarded packets |
| A | 0 | 116 | 0 |
| B | 0 | 116 | 0 |
| C | 0 | 116 | 0 |
| D | 0 | 116 | 0 |
| Mode M0 | |||
|---|---|---|---|
| Quadrant | BADHDUFLAG | Total packets | Discarded packets |
| A | 0 | 12506 | 2 |
| B | 0 | 11380 | 1 |
| C | 0 | 19549 | 1 |
| D | 0 | 21765 | 1 |
| Mode M9 | |||
|---|---|---|---|
| Quadrant | BADHDUFLAG | Total packets | Discarded packets |
| A | 0 | 13 | 0 |
| B | 0 | 13 | 0 |
| C | 0 | 13 | 0 |
| D | 0 | 13 | 0 |
| Quadrant | Total seconds | Saturated seconds | Saturation percentage |
|---|---|---|---|
| A | 5652 | 30 | 0.530786% |
| B | 5652 | 5 | 0.088464% |
| C | 5652 | 509 | 9.005662% |
| D | 5652 | 1122 | 19.851380% |
Noise dominated data is calculated using 1-second bins in cleaned event files. If a bin has >2000 counts, and if more than 50% of those come from <1% of pixels, then it is considered to be noise-dominated and hence unusable.
| Quadrant | # 1 sec bins | Bins with >0 counts | Bins with >2000 counts | High rate bins dominated by noise | Noise dominated (total time) | Noise dominated (detector-on time) | Marked lightcurve |
|---|---|---|---|---|---|---|---|
| A | 6965 | 5653 | 18 | 18 | 0.26% | 0.32% | 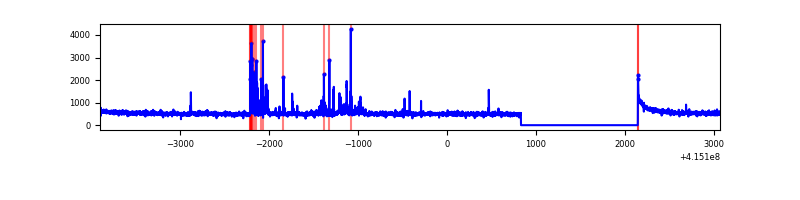 |
| B | 6965 | 5653 | 1 | 1 | 0.01% | 0.02% | 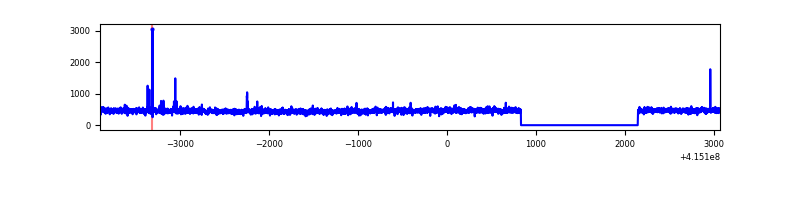 |
| C | 6965 | 5653 | 449 | 449 | 6.45% | 7.94% | 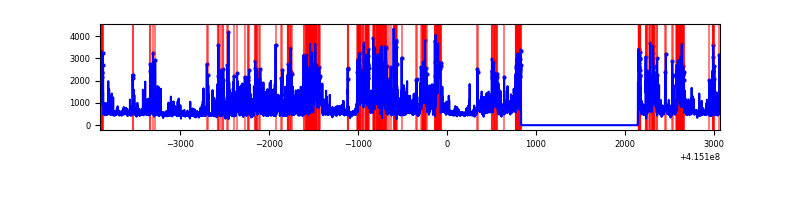 |
| D | 6965 | 5653 | 1019 | 1019 | 14.63% | 18.03% | 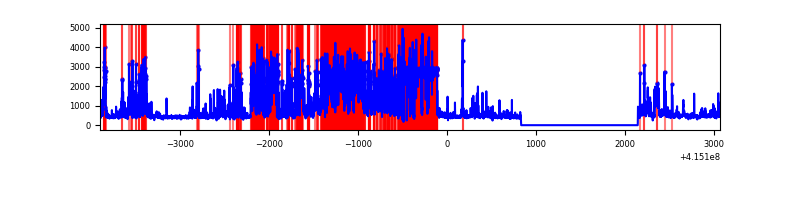 |
Top three noisy pixels from each quadrant. If the there are fewer than three noisy pixels in the level2.evt file, extra rows are filled as -1
| Pixel properties | Quadrant properties | ||||||
|---|---|---|---|---|---|---|---|
| Quadrant | DetID | PixID | Counts | Sigma | Mean | Median | Sigma |
| A | 10 | 83 | 427604 | 3187.37 | 637 | 628 | 134.0 |
| A | 13 | 248 | 131153 | 974.37 | 637 | 628 | 134.0 |
| A | 2 | 79 | 60860 | 449.63 | 637 | 628 | 134.0 |
| B | 4 | 171 | 17846 | 137.14 | 631 | 616 | 125.6 |
| B | 12 | 0 | 16172 | 123.82 | 631 | 616 | 125.6 |
| B | 0 | 230 | 15855 | 121.29 | 631 | 616 | 125.6 |
| C | 9 | 187 | 2546674 | 17935.04 | 595 | 601 | 142.0 |
| C | 15 | 214 | 225470 | 1584.02 | 595 | 601 | 142.0 |
| C | 15 | 208 | 101217 | 708.76 | 595 | 601 | 142.0 |
| D | 12 | 227 | 1574683 | 11275.13 | 553 | 537 | 139.6 |
| D | 2 | 249 | 963981 | 6900.86 | 553 | 537 | 139.6 |
| D | 13 | 249 | 801108 | 5734.25 | 553 | 537 | 139.6 |
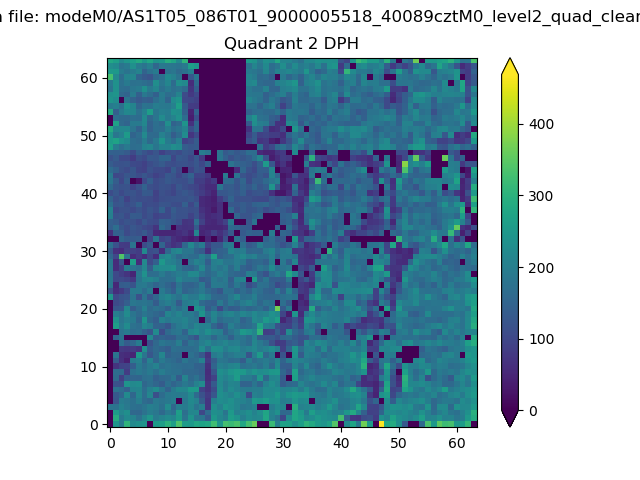
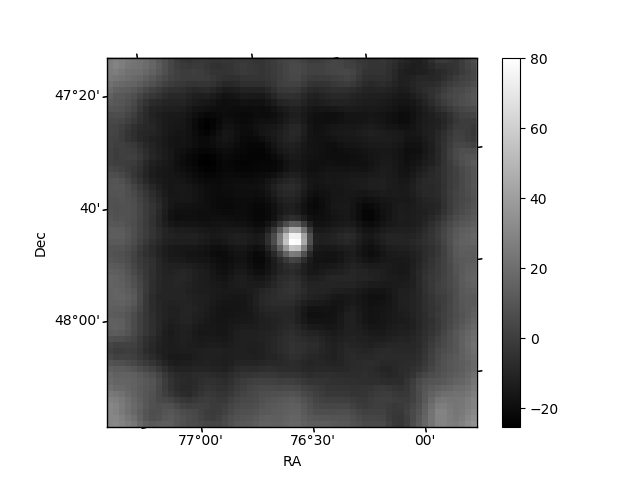
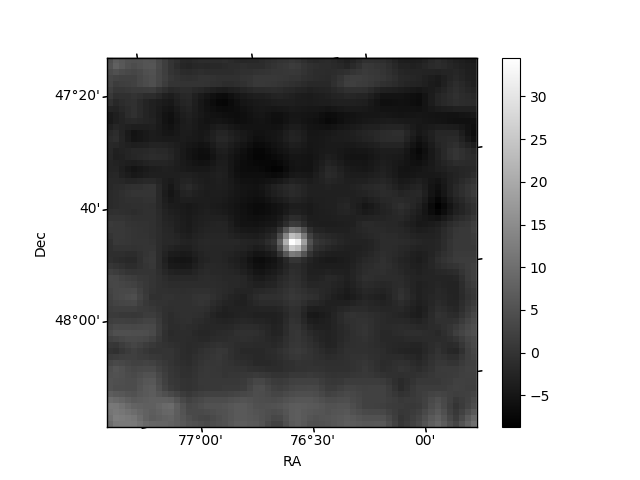
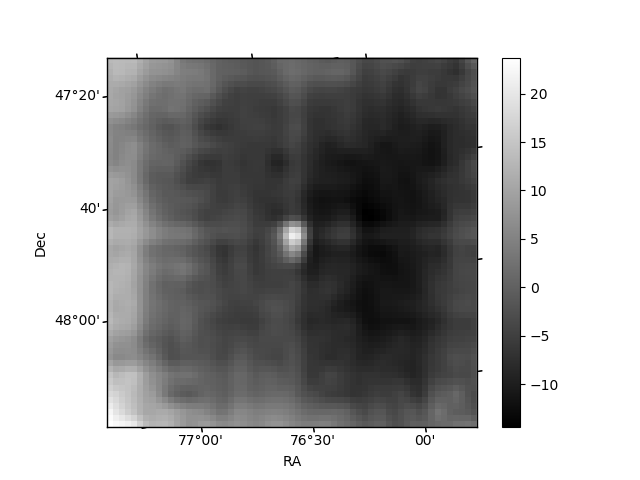
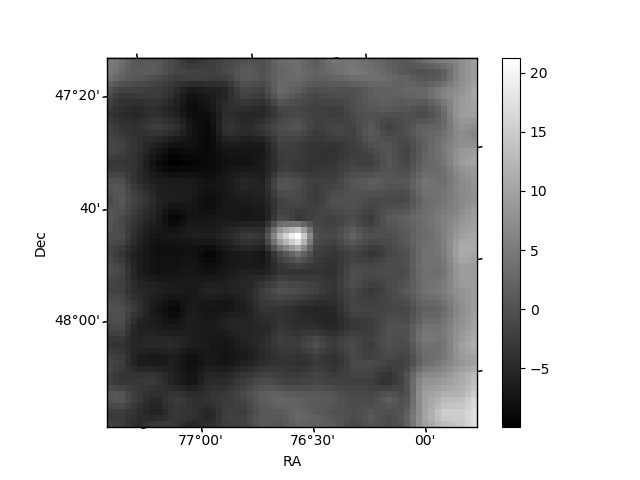
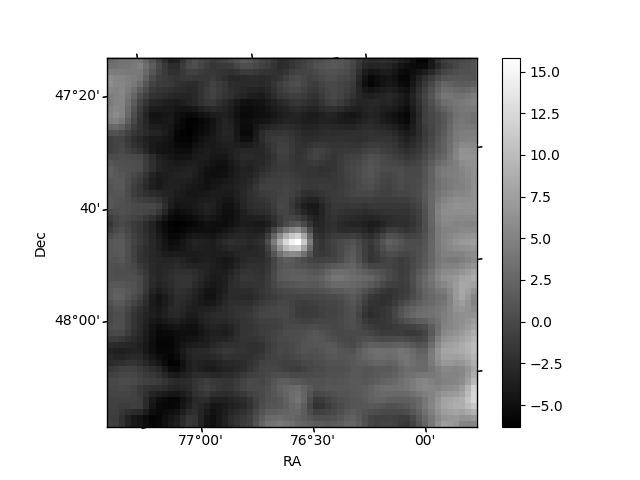
Histogram calculated using DETX and DETY for each event in the final _common_clean file
| Quadrant A | 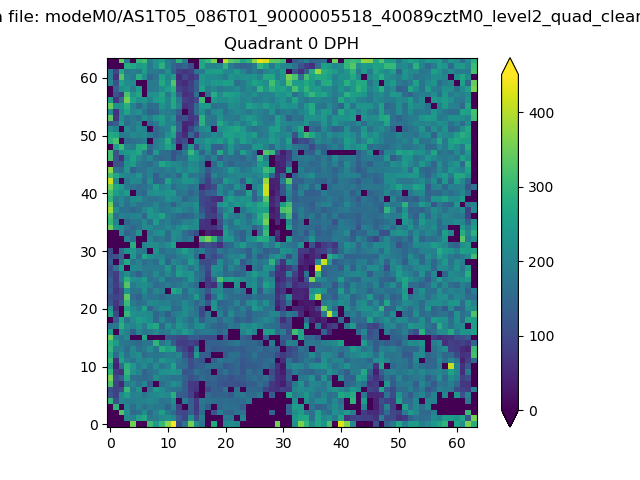 |
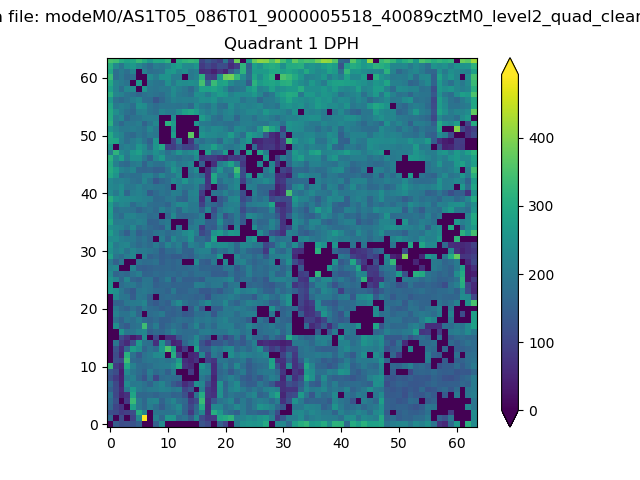 |
Quadrant B |
|---|---|---|---|
| Quadrant D | 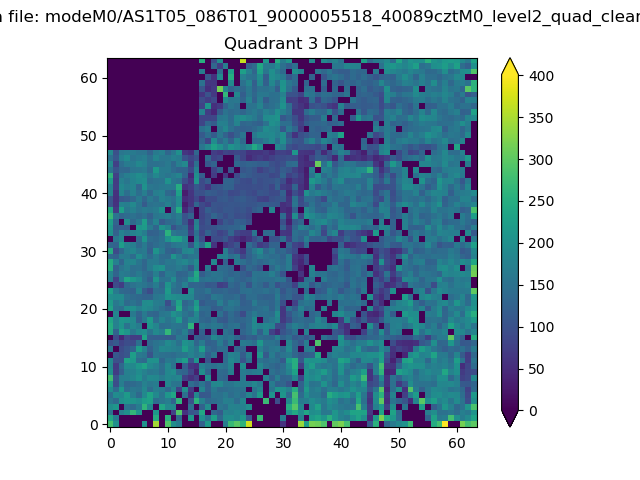 |
 |
Quadrant C |
| Plot type | Count rate plots | Images |
|---|---|---|
| Comparison with Poisson distribution Blue bars denote a histogram of data divided into 1 sec bins. Red curve is a Poisson curve with rate = median count rate of data. |
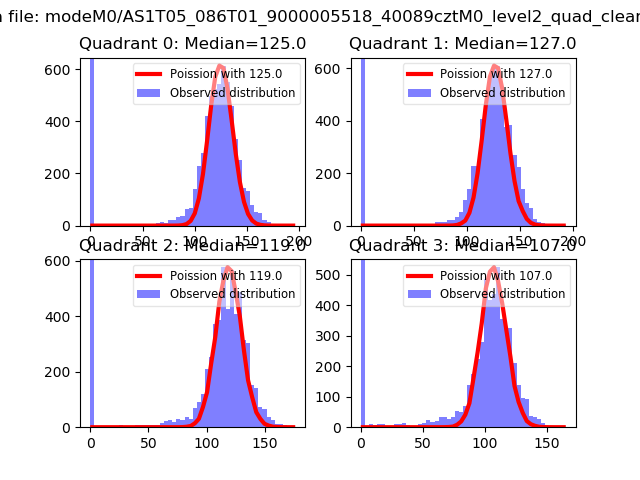 |
 |
| Quadrant-wise count rates Data is divided into 100 sec bins |
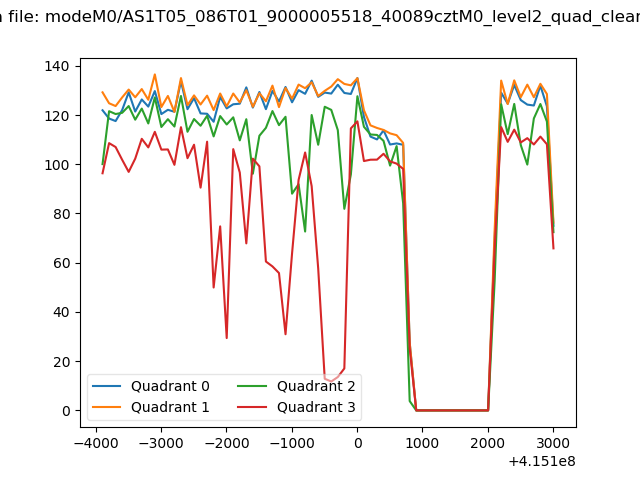 |
|
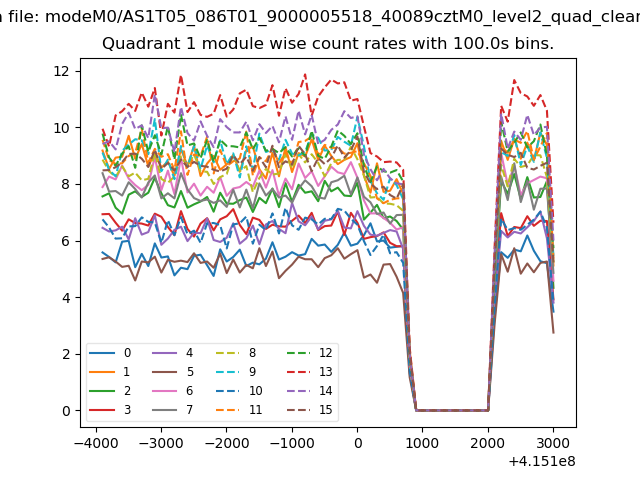
| Module-wise count rates for Quadrant A Data is divided into 100 sec bins |
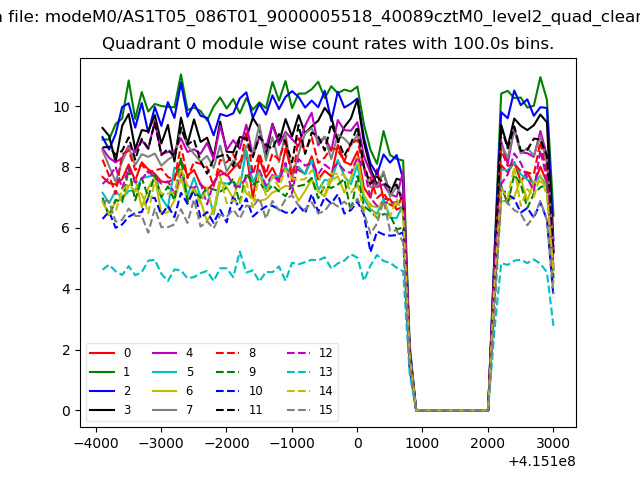 |
 |
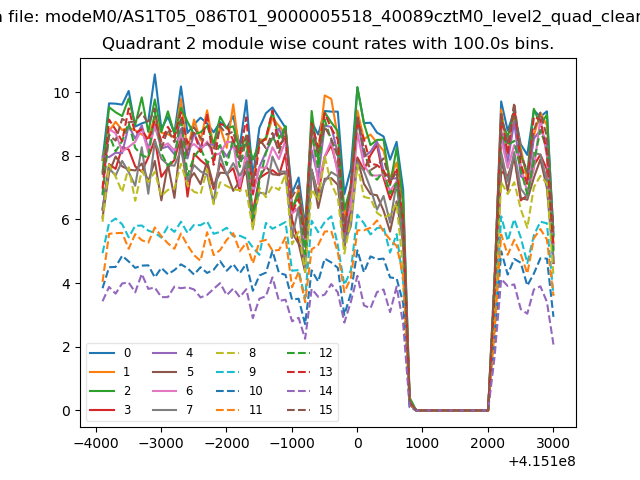
| Module-wise count rates for Quadrant B Data is divided into 100 sec bins |
 |
 |
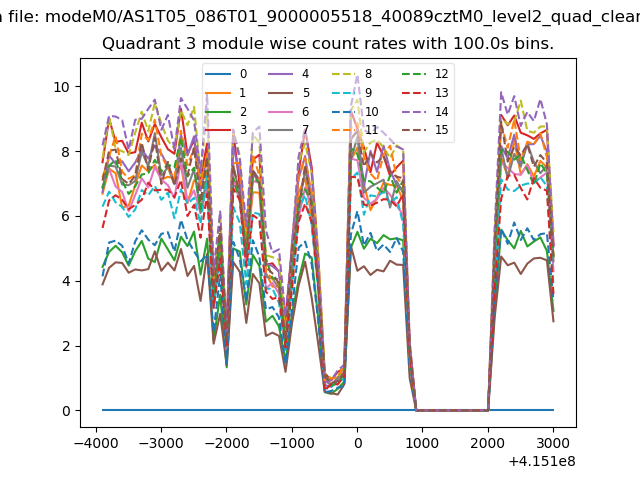
| Module-wise count rates for Quadrant C Data is divided into 100 sec bins |
 |
 |
| Module-wise count rates for Quadrant D Data is divided into 100 sec bins |
 |
 |
| Parameter | Plot |
|---|---|
| CZT HV Monitor | 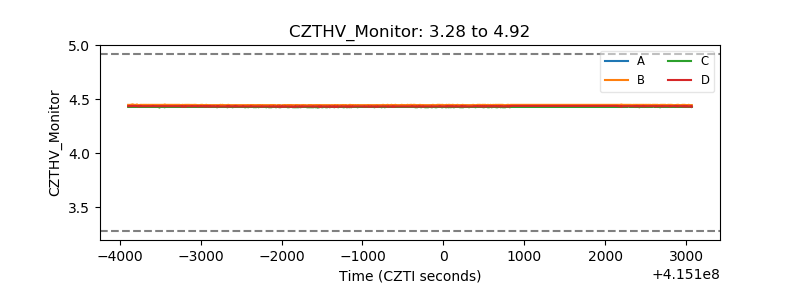 |
| D_VDD | 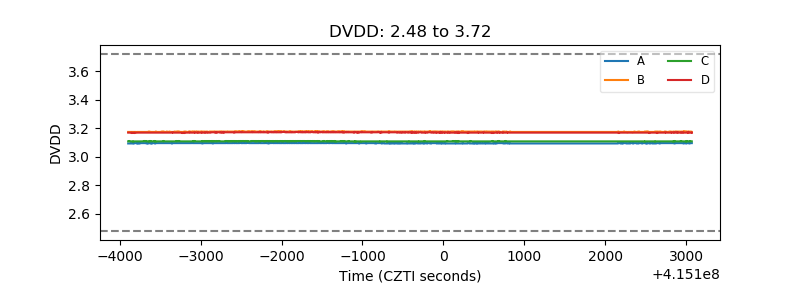 |
| Temperature 1 | 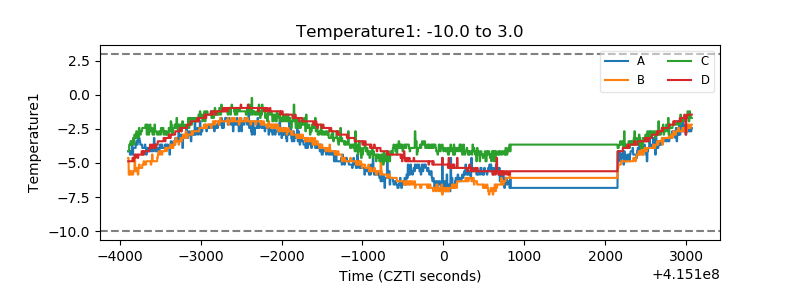 |
| Veto HV Monitor | 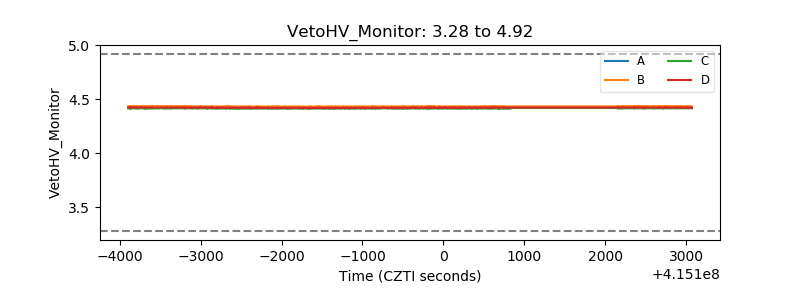 |
| Veto LLD | 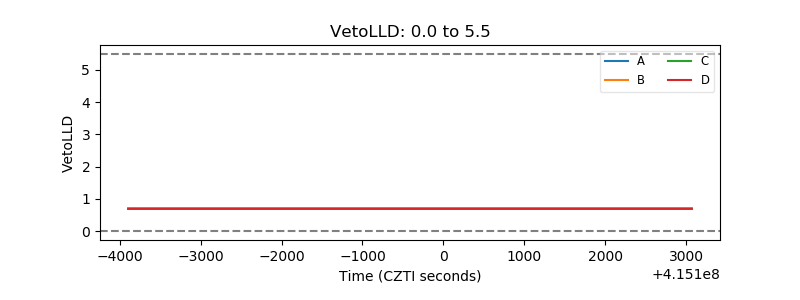 |
| Alpha Counter | 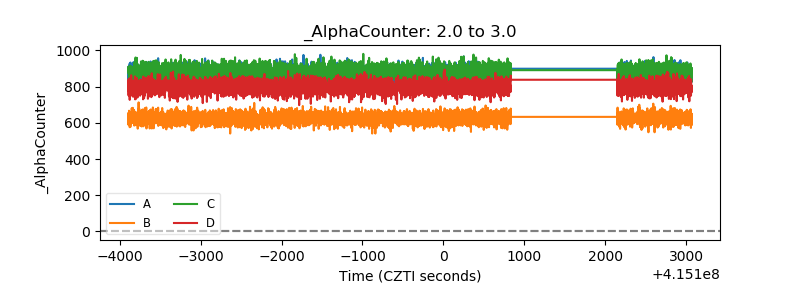 |
| _CPM_Rate | 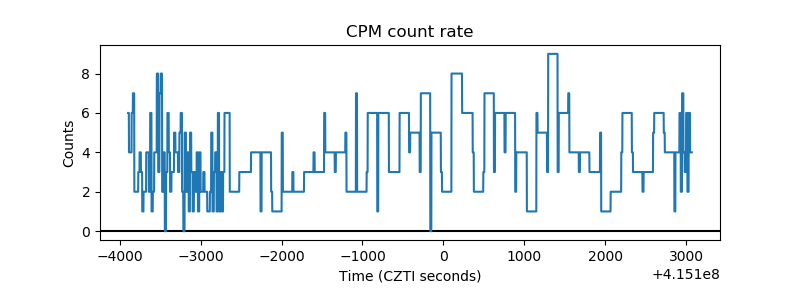 |
| CZT Counter | 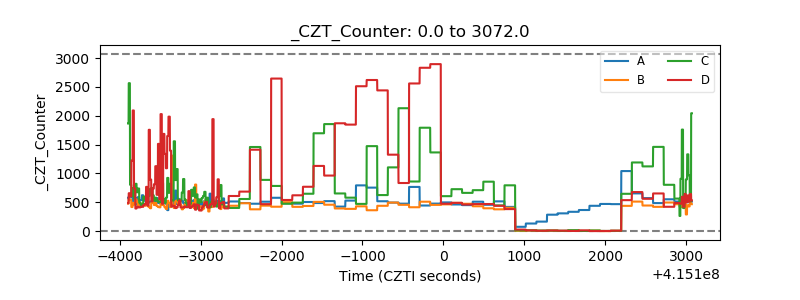 |
| +2.5 Volts monitor | 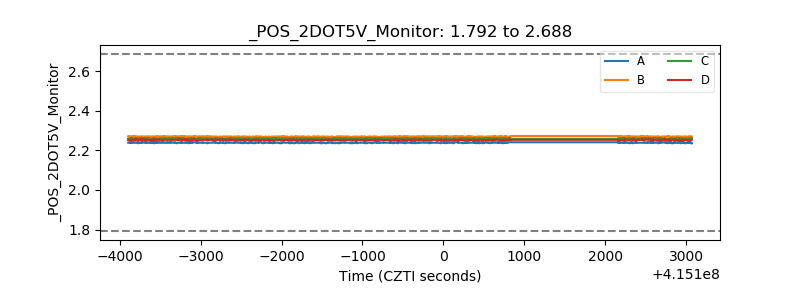 |
| +5 Volts monitor |  |
| _ROLL_ROT | 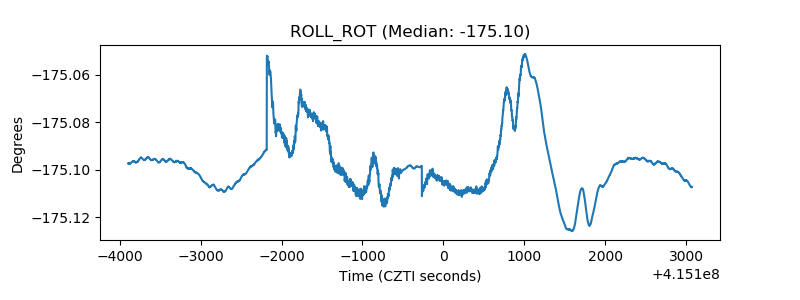 |
| _Roll_DEC | 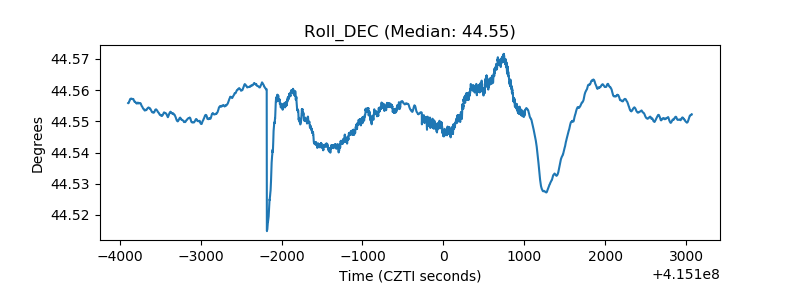 |
| _Roll_RA | 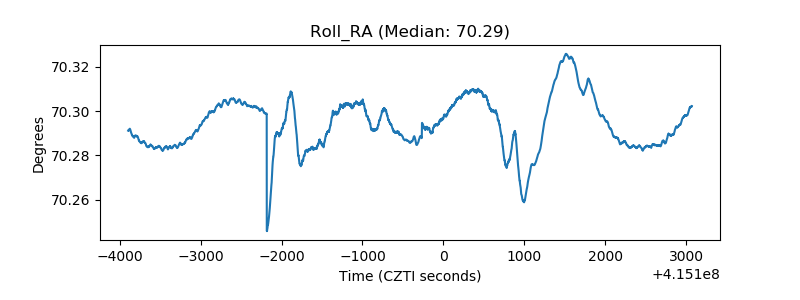 |
| Veto Counter | 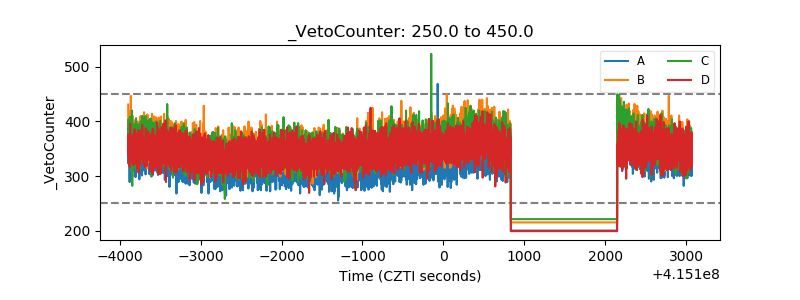 |