| Param | Original file | Final file |
|---|---|---|
| Filename | modeM0/AS1T05_086T01_9000005518_40092cztM0_level2.fits | modeM0/AS1T05_086T01_9000005518_40092cztM0_level2_quad_clean.evt |
| Size (bytes) | 858,096,000 | 165,830,400 |
| Size | 818.3 MB | 158.1 MB |
| Events in quadrant A | 5,294,783 | 1,216,494 |
| Events in quadrant B | 4,664,078 | 1,236,088 |
| Events in quadrant C | 9,437,992 | 1,086,542 |
| Events in quadrant D | 11,590,785 | 787,971 |
| Mode SS | |||
|---|---|---|---|
| Quadrant | BADHDUFLAG | Total packets | Discarded packets |
| A | 0 | 202 | 0 |
| B | 0 | 202 | 0 |
| C | 0 | 202 | 0 |
| D | 0 | 202 | 0 |
| Mode M0 | |||
|---|---|---|---|
| Quadrant | BADHDUFLAG | Total packets | Discarded packets |
| A | 0 | 21714 | 3 |
| B | 0 | 20583 | 6 |
| C | 0 | 34798 | 8 |
| D | 0 | 41256 | 3 |
| Mode M9 | |||
|---|---|---|---|
| Quadrant | BADHDUFLAG | Total packets | Discarded packets |
| A | 0 | 34 | 0 |
| B | 0 | 34 | 0 |
| C | 0 | 34 | 0 |
| D | 0 | 35 | 0 |
| Quadrant | Total seconds | Saturated seconds | Saturation percentage |
|---|---|---|---|
| A | 10026 | 46 | 0.458807% |
| B | 10024 | 17 | 0.169593% |
| C | 10023 | 957 | 9.548040% |
| D | 10026 | 2714 | 27.069619% |
Noise dominated data is calculated using 1-second bins in cleaned event files. If a bin has >2000 counts, and if more than 50% of those come from <1% of pixels, then it is considered to be noise-dominated and hence unusable.
| Quadrant | # 1 sec bins | Bins with >0 counts | Bins with >2000 counts | High rate bins dominated by noise | Noise dominated (total time) | Noise dominated (detector-on time) | Marked lightcurve |
|---|---|---|---|---|---|---|---|
| A | 12684 | 10028 | 32 | 32 | 0.25% | 0.32% | 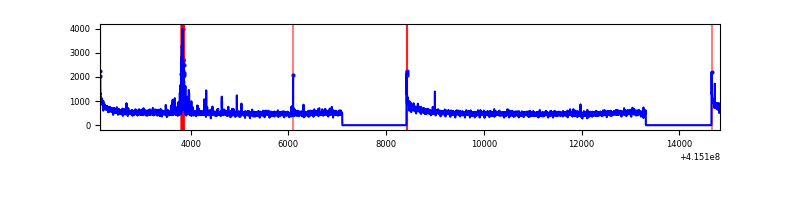 |
| B | 12684 | 10027 | 8 | 8 | 0.06% | 0.08% | 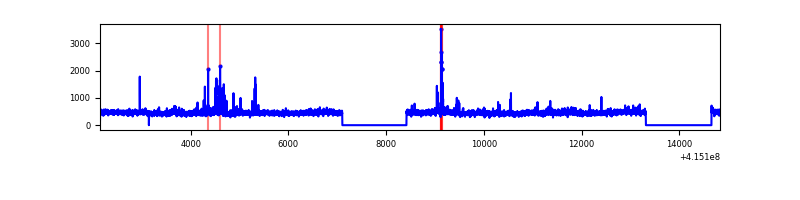 |
| C | 12684 | 10027 | 924 | 924 | 7.28% | 9.22% | 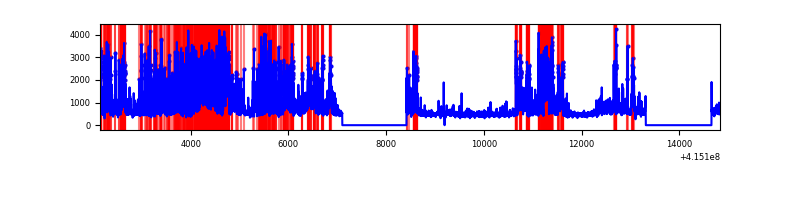 |
| D | 12684 | 10028 | 2573 | 2573 | 20.29% | 25.66% | 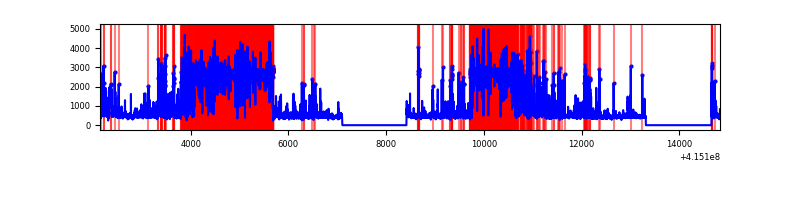 |
Top three noisy pixels from each quadrant. If the there are fewer than three noisy pixels in the level2.evt file, extra rows are filled as -1
| Pixel properties | Quadrant properties | ||||||
|---|---|---|---|---|---|---|---|
| Quadrant | DetID | PixID | Counts | Sigma | Mean | Median | Sigma |
| A | 10 | 83 | 784761 | 3412.43 | 1112 | 1091 | 229.7 |
| A | 13 | 248 | 123330 | 532.28 | 1112 | 1091 | 229.7 |
| A | 2 | 79 | 69657 | 298.57 | 1112 | 1091 | 229.7 |
| B | 4 | 171 | 141734 | 654.88 | 1107 | 1082 | 214.8 |
| B | 0 | 189 | 80352 | 369.08 | 1107 | 1082 | 214.8 |
| B | 10 | 246 | 40730 | 184.6 | 1107 | 1082 | 214.8 |
| C | 9 | 187 | 4666897 | 18759.09 | 1053 | 1065 | 248.7 |
| C | 15 | 214 | 398296 | 1597.08 | 1053 | 1065 | 248.7 |
| C | 15 | 208 | 151357 | 604.25 | 1053 | 1065 | 248.7 |
| D | 12 | 227 | 6007750 | 26452.04 | 912 | 889 | 227.1 |
| D | 2 | 249 | 955498 | 4203.75 | 912 | 889 | 227.1 |
| D | 13 | 249 | 629690 | 2769.01 | 912 | 889 | 227.1 |
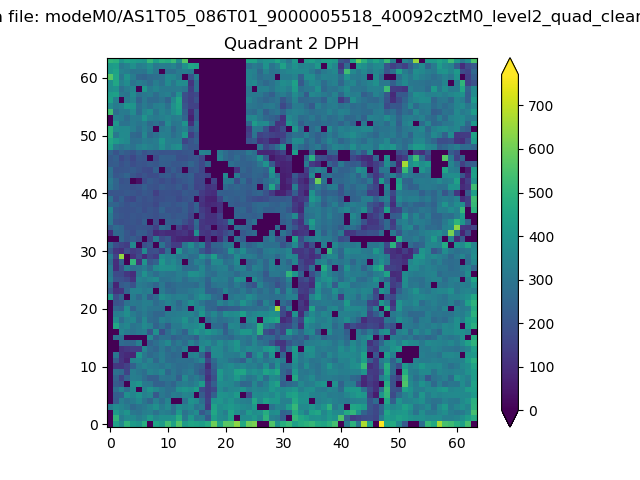
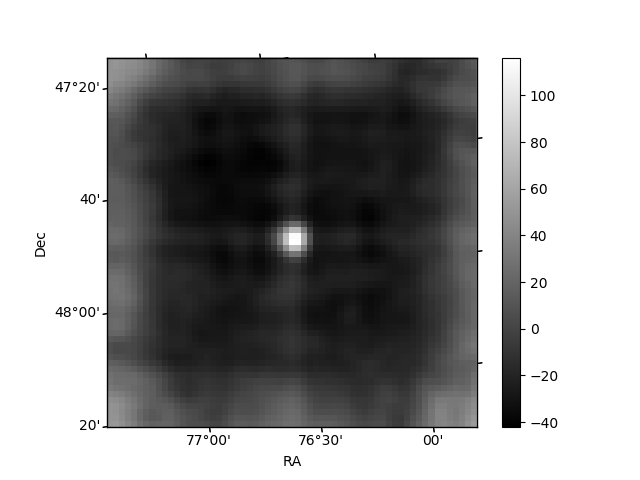
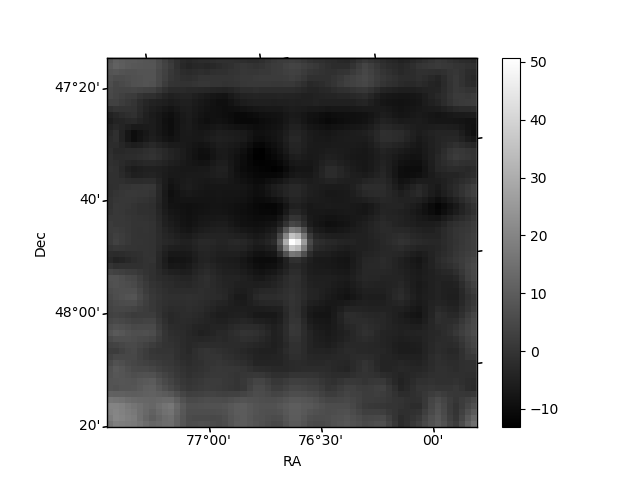
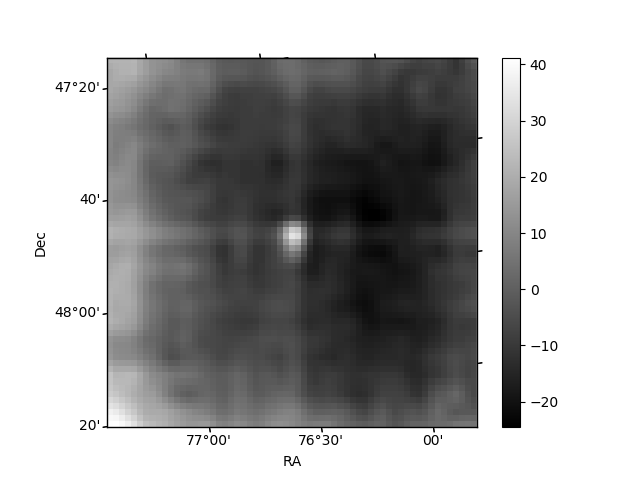
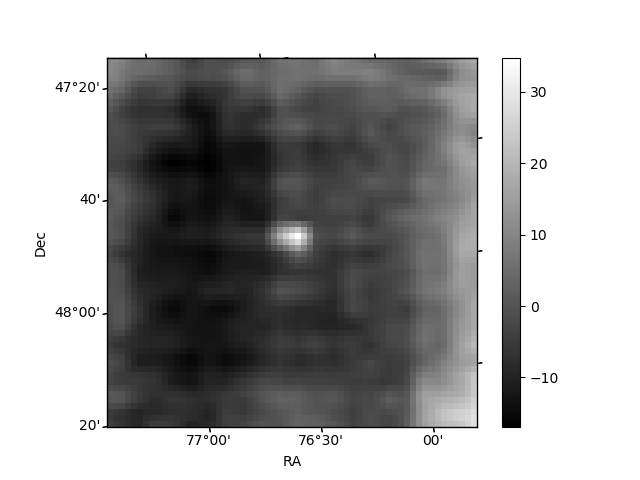
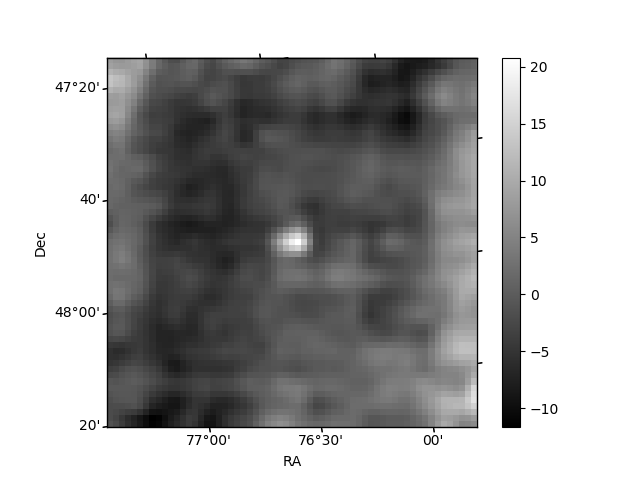
Histogram calculated using DETX and DETY for each event in the final _common_clean file
| Quadrant A | 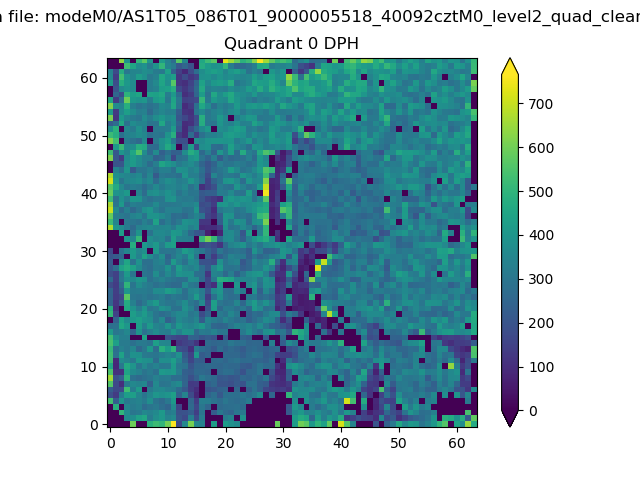 |
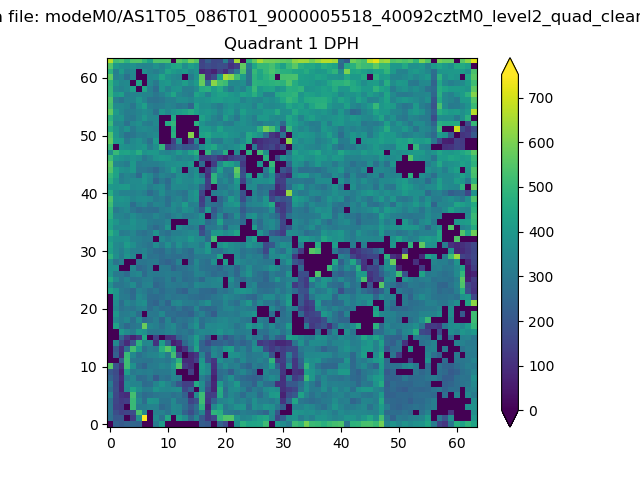 |
Quadrant B |
|---|---|---|---|
| Quadrant D | 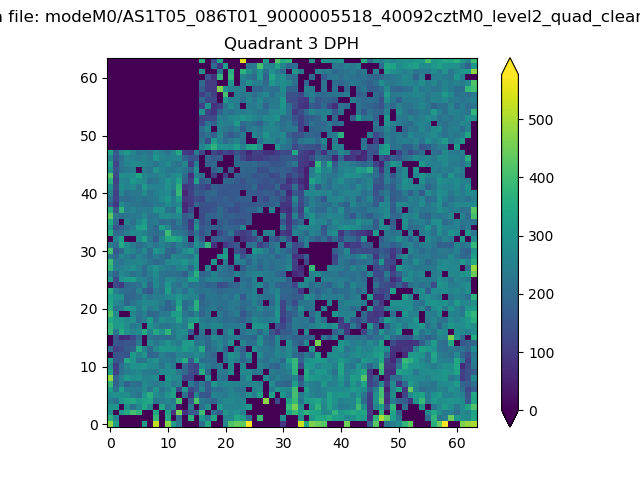 |
 |
Quadrant C |
| Plot type | Count rate plots | Images |
|---|---|---|
| Comparison with Poisson distribution Blue bars denote a histogram of data divided into 1 sec bins. Red curve is a Poisson curve with rate = median count rate of data. |
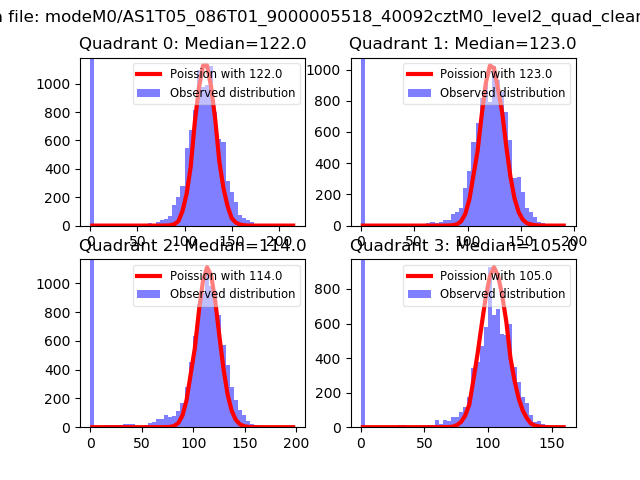 |
 |
| Quadrant-wise count rates Data is divided into 100 sec bins |
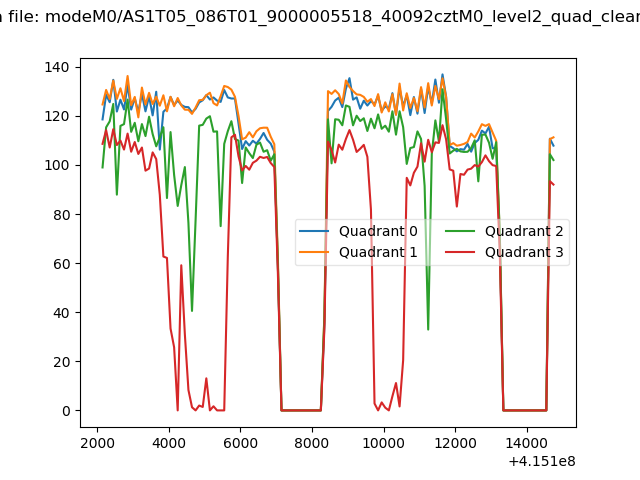 |
|
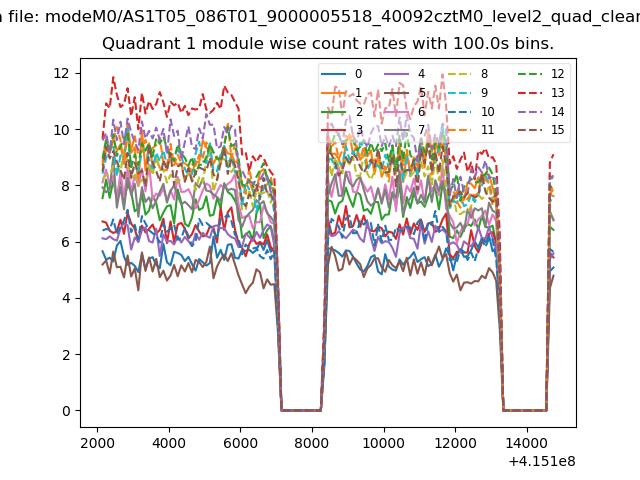
| Module-wise count rates for Quadrant A Data is divided into 100 sec bins |
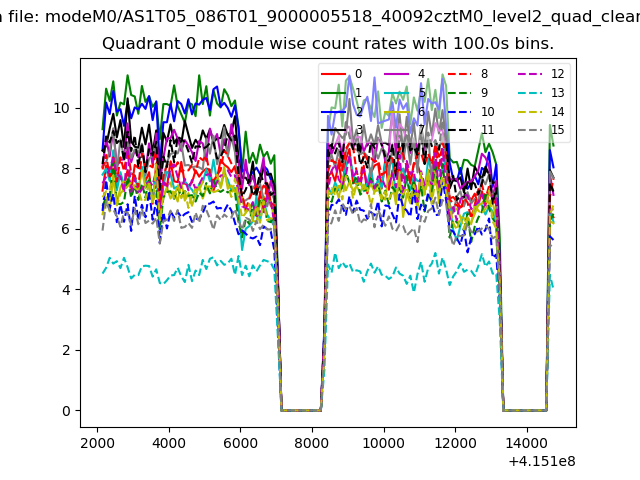 |
 |
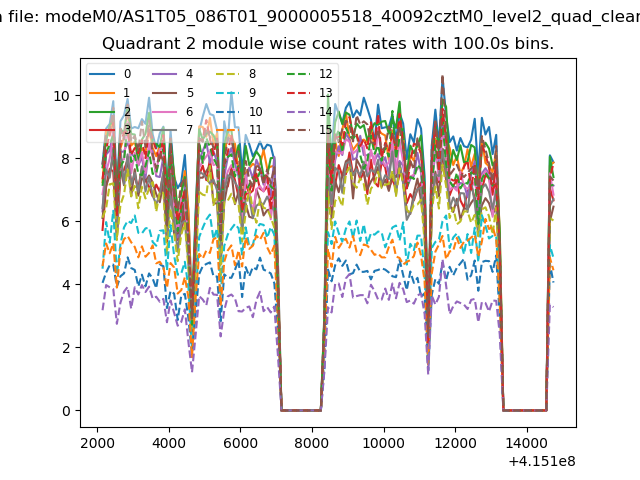
| Module-wise count rates for Quadrant B Data is divided into 100 sec bins |
 |
 |
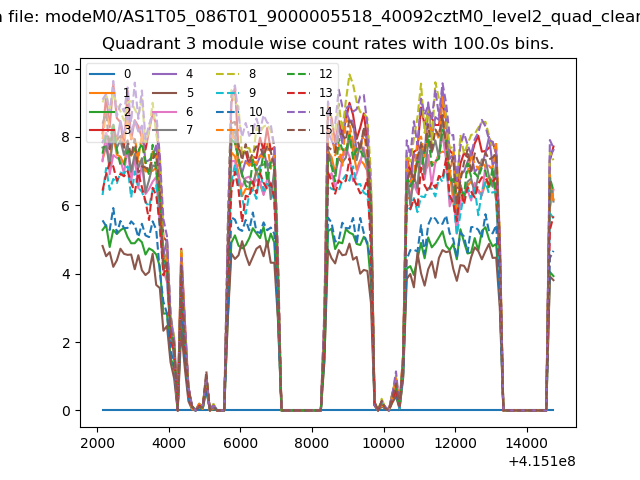
| Module-wise count rates for Quadrant C Data is divided into 100 sec bins |
 |
 |
| Module-wise count rates for Quadrant D Data is divided into 100 sec bins |
 |
 |
| Parameter | Plot |
|---|---|
| CZT HV Monitor | 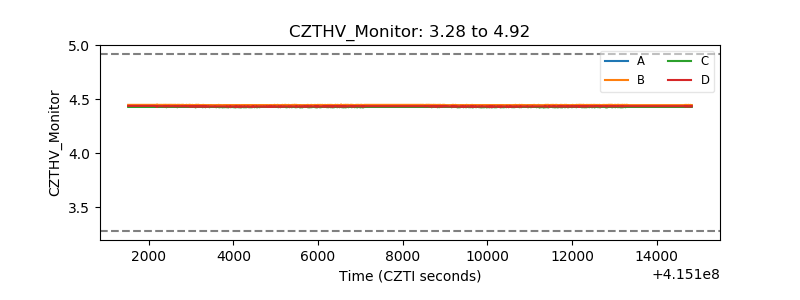 |
| D_VDD | 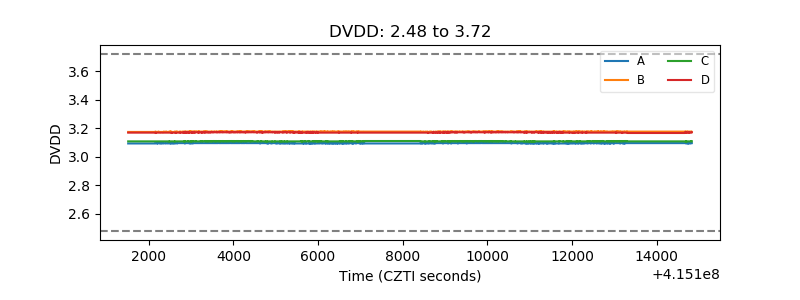 |
| Temperature 1 | 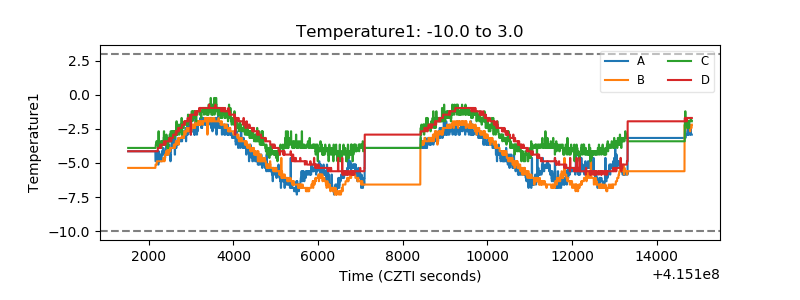 |
| Veto HV Monitor | 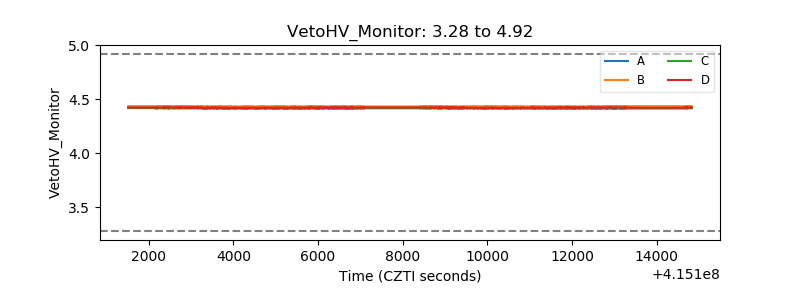 |
| Veto LLD | 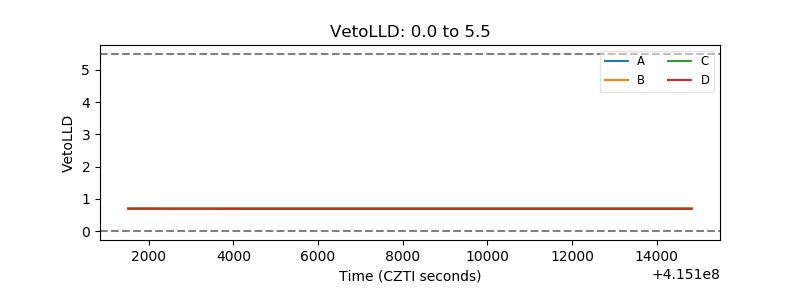 |
| Alpha Counter | 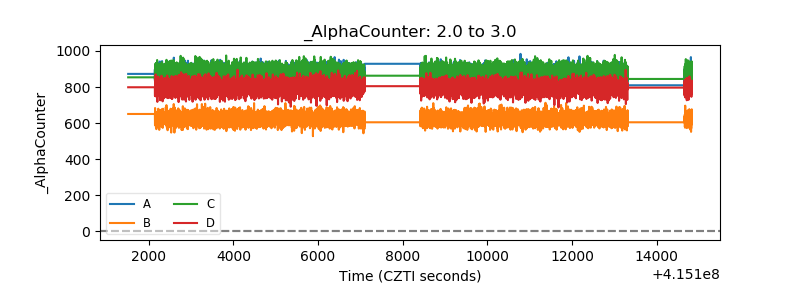 |
| _CPM_Rate | 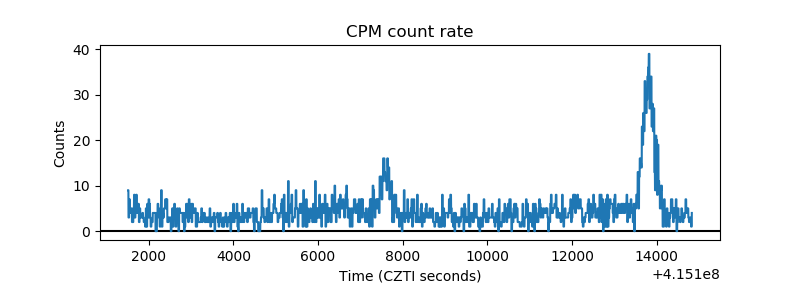 |
| CZT Counter | 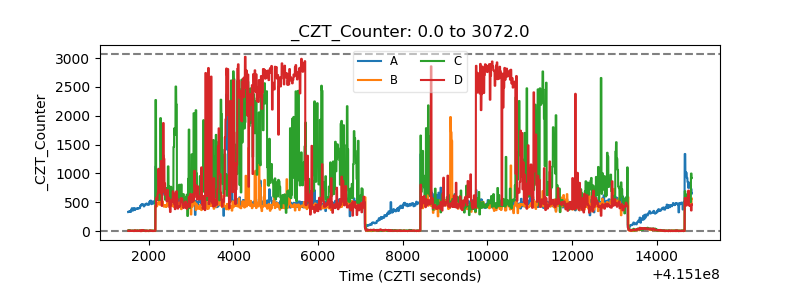 |
| +2.5 Volts monitor | 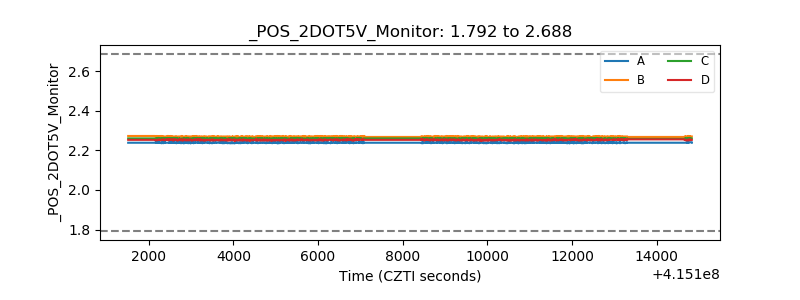 |
| +5 Volts monitor | 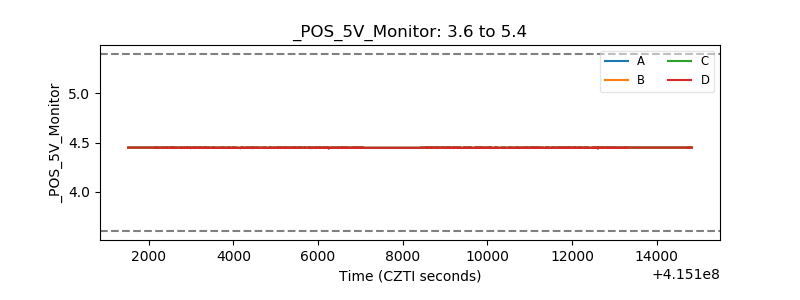 |
| _ROLL_ROT | 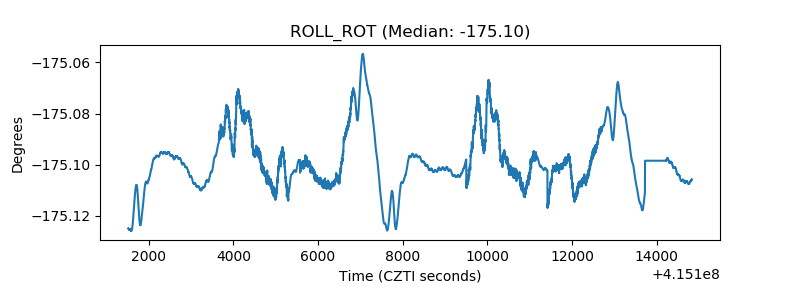 |
| _Roll_DEC | 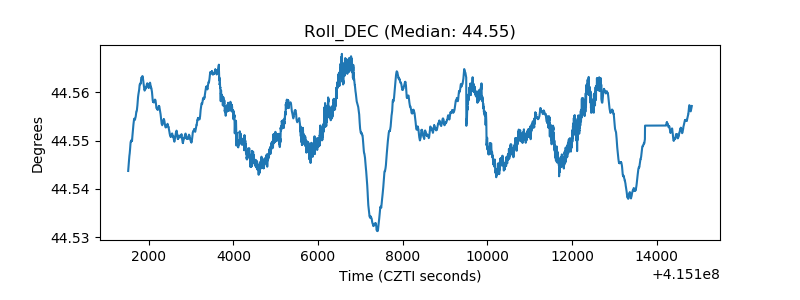 |
| _Roll_RA | 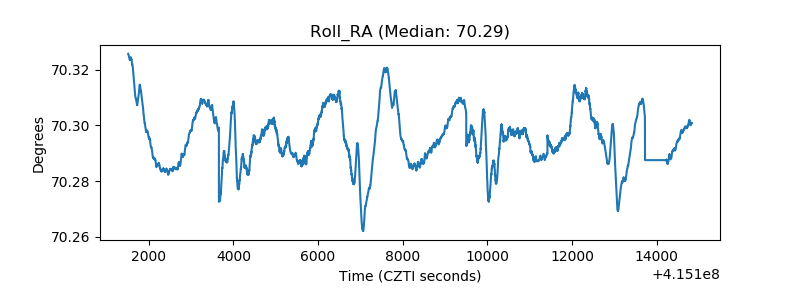 |
| Veto Counter | 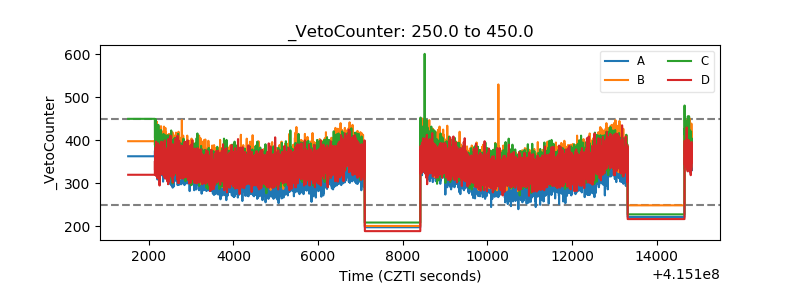 |