| Param | Original file | Final file |
|---|---|---|
| Filename | modeM0/AS1A12_004T01_9000005520_40092cztM0_level2.fits | modeM0/AS1A12_004T01_9000005520_40092cztM0_level2_quad_clean.evt |
| Size (bytes) | 377,559,360 | 73,428,480 |
| Size | 360.1 MB | 70.0 MB |
| Events in quadrant A | 2,348,836 | 505,279 |
| Events in quadrant B | 2,153,315 | 517,739 |
| Events in quadrant C | 5,281,331 | 444,868 |
| Events in quadrant D | 3,831,206 | 429,125 |
| Mode M0 | |||
|---|---|---|---|
| Quadrant | BADHDUFLAG | Total packets | Discarded packets |
| A | 0 | 9867 | 2 |
| B | 0 | 9532 | 1 |
| C | 0 | 18873 | 11 |
| D | 0 | 14721 | 8 |
| Mode M9 | |||
|---|---|---|---|
| Quadrant | BADHDUFLAG | Total packets | Discarded packets |
| A | 0 | 15 | 0 |
| B | 0 | 15 | 0 |
| C | 0 | 15 | 0 |
| D | 0 | 15 | 0 |
| Mode SS | |||
|---|---|---|---|
| Quadrant | BADHDUFLAG | Total packets | Discarded packets |
| A | 0 | 94 | 0 |
| B | 0 | 94 | 0 |
| C | 0 | 94 | 0 |
| D | 0 | 94 | 0 |
| Quadrant | Total seconds | Saturated seconds | Saturation percentage |
|---|---|---|---|
| A | 4644 | 9 | 0.193798% |
| B | 4644 | 6 | 0.129199% |
| C | 4641 | 656 | 14.134885% |
| D | 4643 | 397 | 8.550506% |
Noise dominated data is calculated using 1-second bins in cleaned event files. If a bin has >2000 counts, and if more than 50% of those come from <1% of pixels, then it is considered to be noise-dominated and hence unusable.
| Quadrant | # 1 sec bins | Bins with >0 counts | Bins with >2000 counts | High rate bins dominated by noise | Noise dominated (total time) | Noise dominated (detector-on time) | Marked lightcurve |
|---|---|---|---|---|---|---|---|
| A | 6106 | 4645 | 3 | 3 | 0.05% | 0.06% | 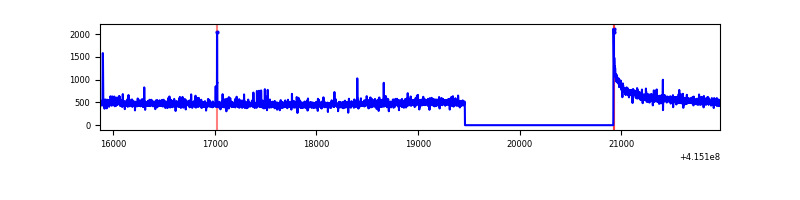 |
| B | 6106 | 4645 | 1 | 1 | 0.02% | 0.02% | 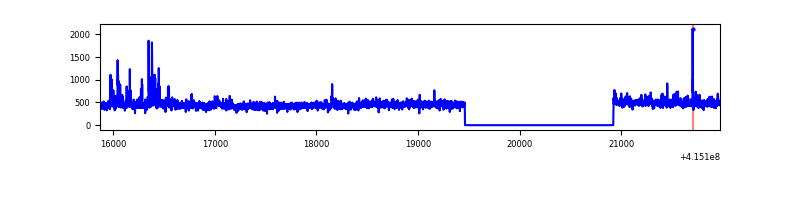 |
| C | 6106 | 4644 | 559 | 559 | 9.15% | 12.04% | 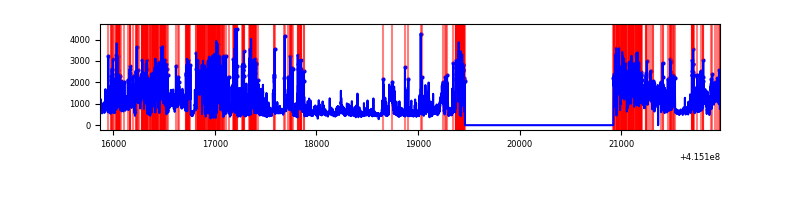 |
| D | 6106 | 4645 | 333 | 333 | 5.45% | 7.17% | 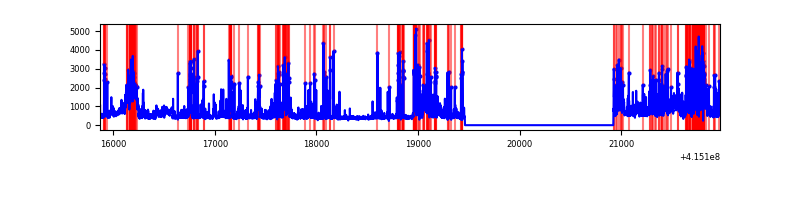 |
Top three noisy pixels from each quadrant. If the there are fewer than three noisy pixels in the level2.evt file, extra rows are filled as -1
| Pixel properties | Quadrant properties | ||||||
|---|---|---|---|---|---|---|---|
| Quadrant | DetID | PixID | Counts | Sigma | Mean | Median | Sigma |
| A | 10 | 83 | 344944 | 3263.04 | 506 | 495 | 105.6 |
| A | 2 | 79 | 29949 | 279.02 | 506 | 495 | 105.6 |
| A | 13 | 6 | 8036 | 71.44 | 506 | 495 | 105.6 |
| B | 0 | 189 | 80357 | 797.0 | 506 | 490 | 100.2 |
| B | 4 | 171 | 47635 | 470.46 | 506 | 490 | 100.2 |
| B | 0 | 230 | 22307 | 217.71 | 506 | 490 | 100.2 |
| C | 9 | 187 | 3225196 | 28852.26 | 473 | 475 | 111.8 |
| C | 15 | 214 | 178965 | 1596.99 | 473 | 475 | 111.8 |
| C | 15 | 208 | 15185 | 131.61 | 473 | 475 | 111.8 |
| D | 12 | 227 | 1256068 | 10627.02 | 479 | 465 | 118.2 |
| D | 13 | 249 | 378255 | 3197.49 | 479 | 465 | 118.2 |
| D | 12 | 218 | 110585 | 932.02 | 479 | 465 | 118.2 |
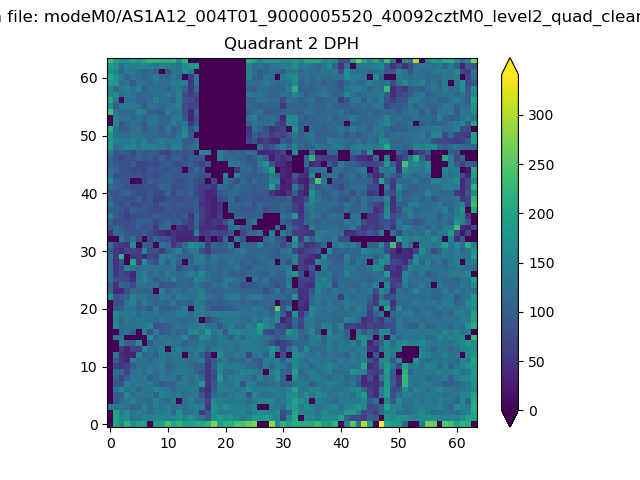
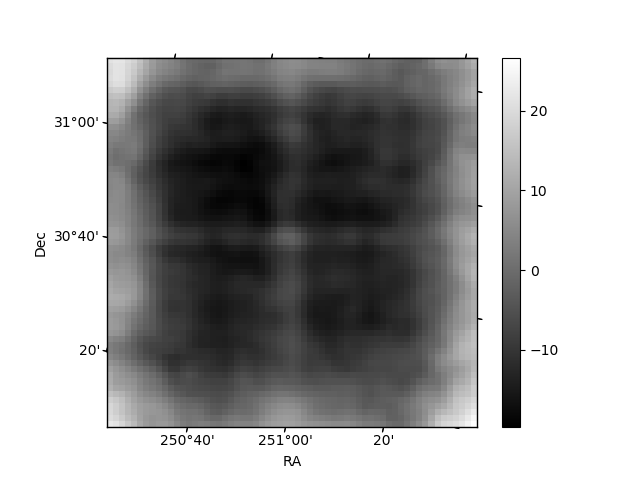
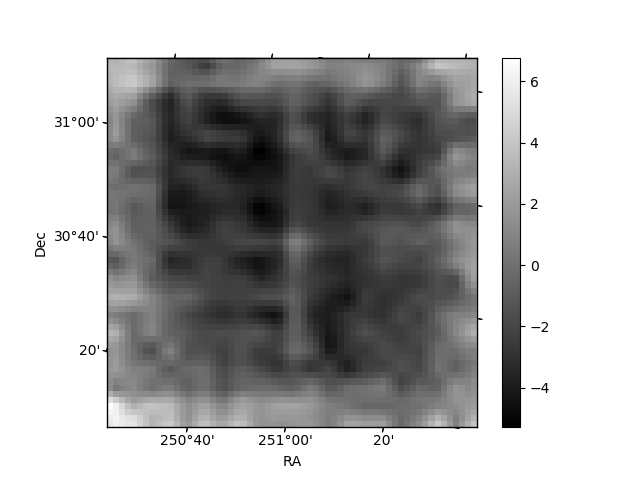
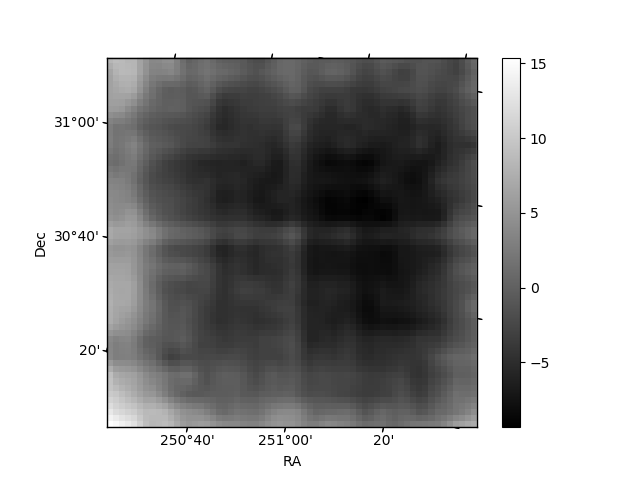
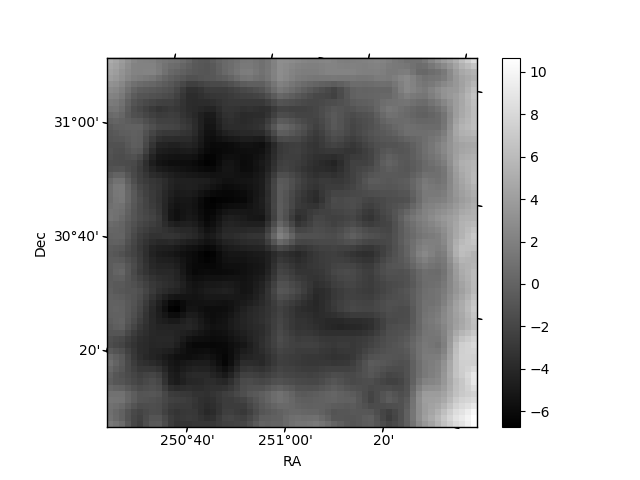
Histogram calculated using DETX and DETY for each event in the final _common_clean file
| Quadrant A | 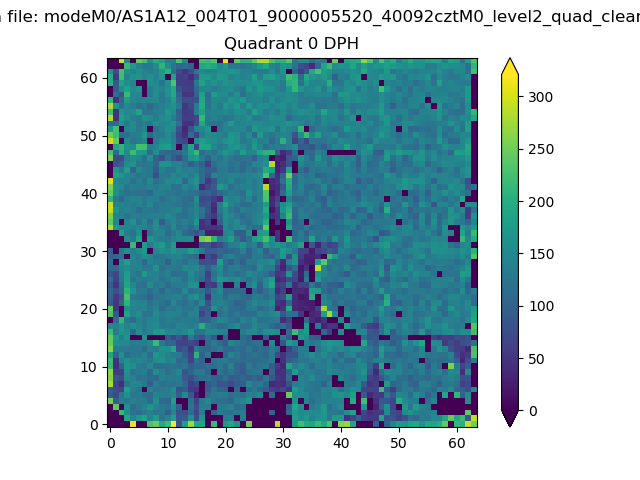 |
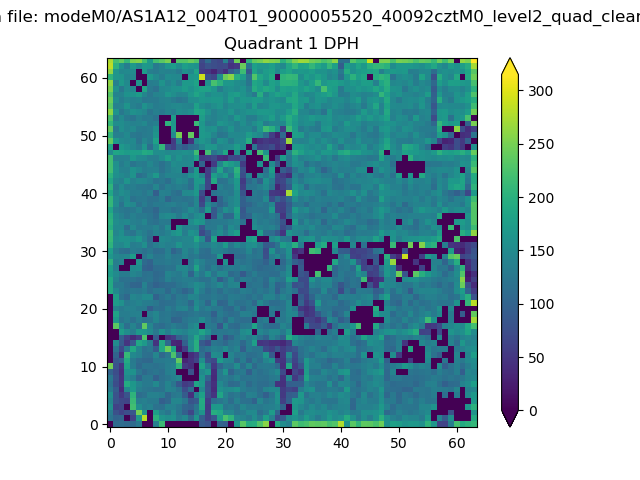 |
Quadrant B |
|---|---|---|---|
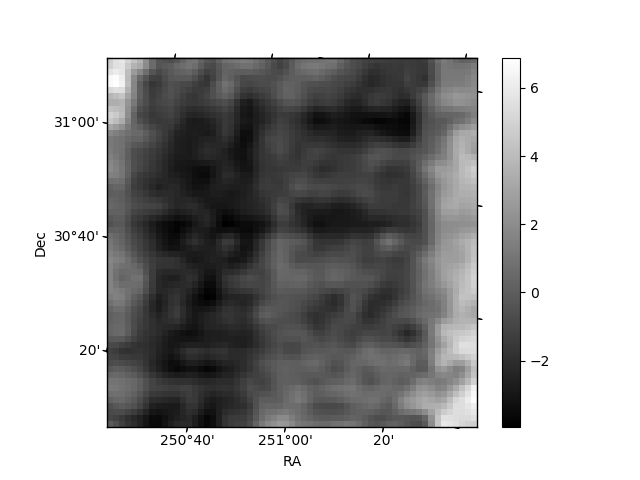
| Quadrant D | 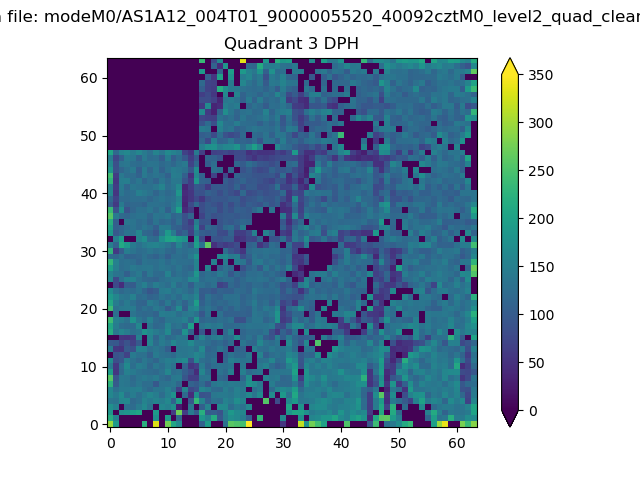 |
 |
Quadrant C |
| Plot type | Count rate plots | Images |
|---|---|---|
| Comparison with Poisson distribution Blue bars denote a histogram of data divided into 1 sec bins. Red curve is a Poisson curve with rate = median count rate of data. |
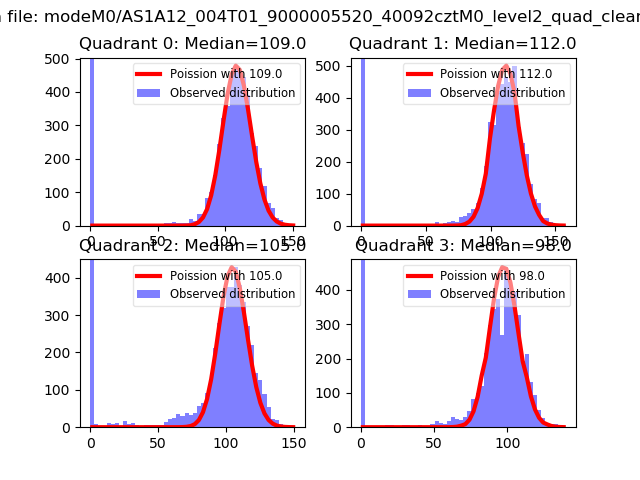 |
 |
| Quadrant-wise count rates Data is divided into 100 sec bins |
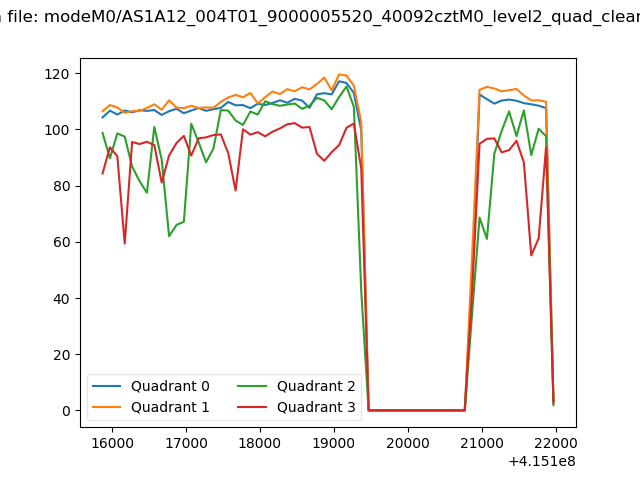 |
|
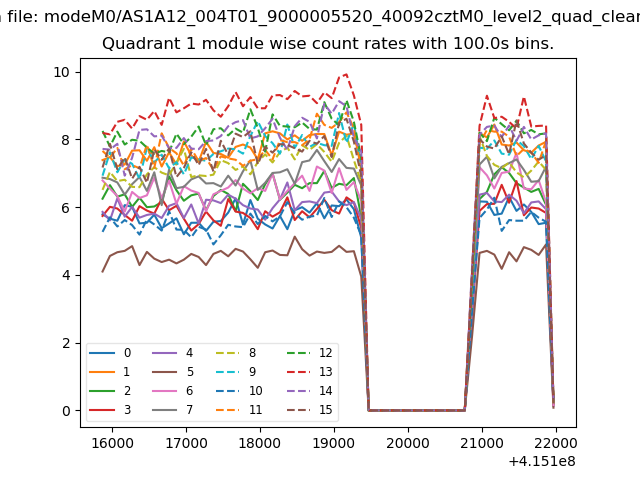
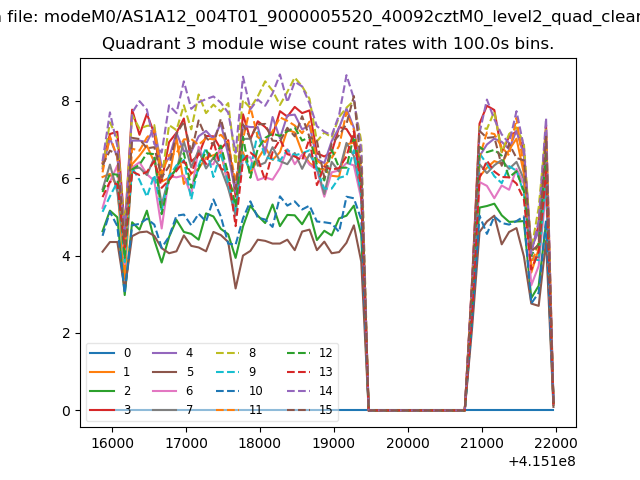
| Module-wise count rates for Quadrant A Data is divided into 100 sec bins |
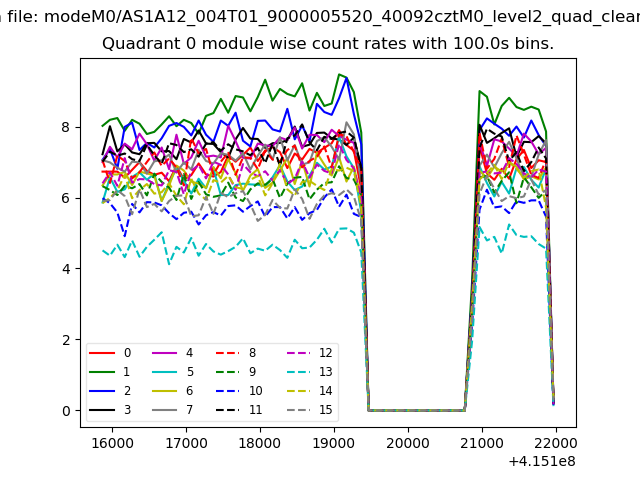 |
 |
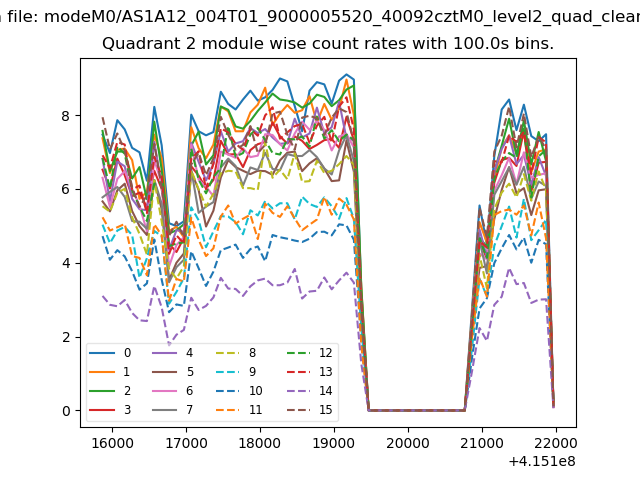
| Module-wise count rates for Quadrant B Data is divided into 100 sec bins |
 |
 |
| Module-wise count rates for Quadrant C Data is divided into 100 sec bins |
 |
 |
| Module-wise count rates for Quadrant D Data is divided into 100 sec bins |
 |
 |
| Parameter | Plot |
|---|---|
| CZT HV Monitor | 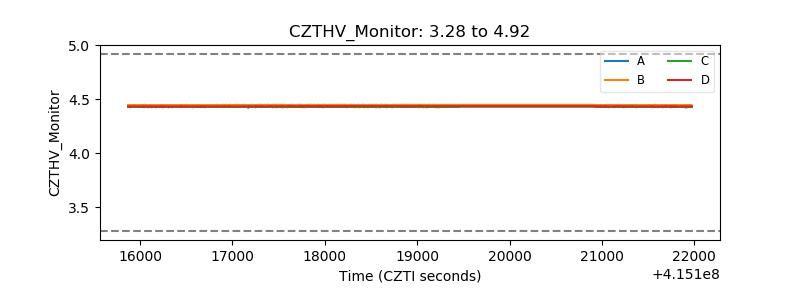 |
| D_VDD | 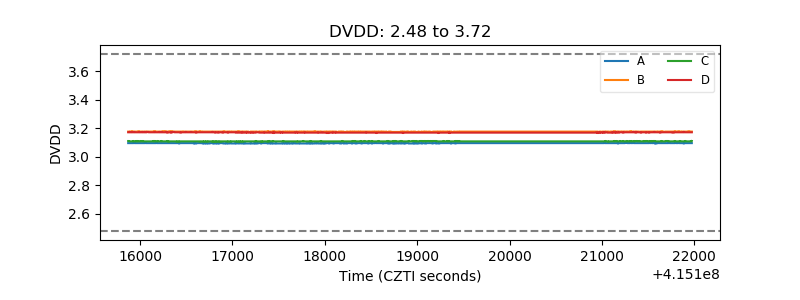 |
| Temperature 1 | 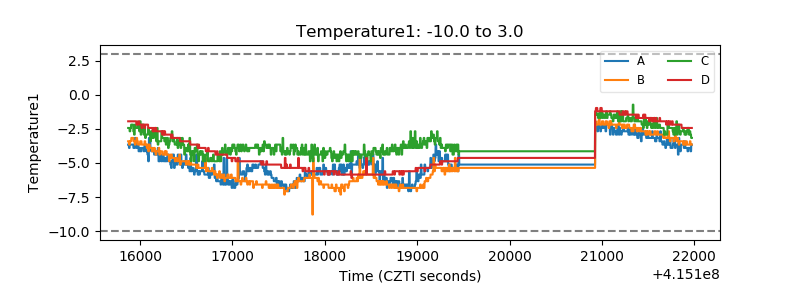 |
| Veto HV Monitor |  |
| Veto LLD | 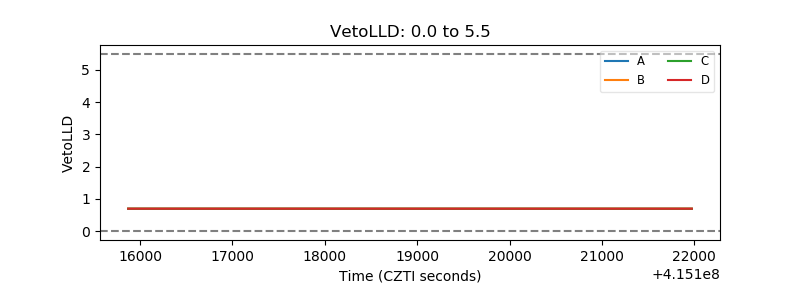 |
| Alpha Counter | 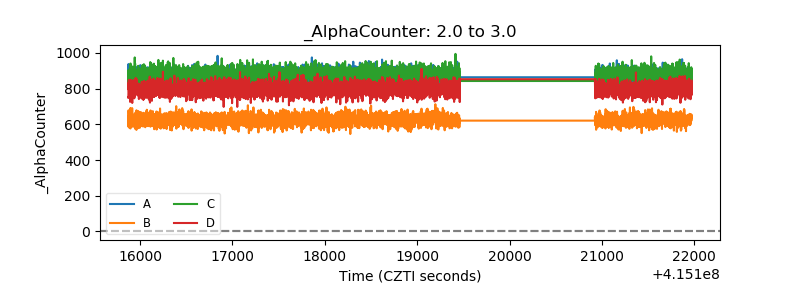 |
| _CPM_Rate | 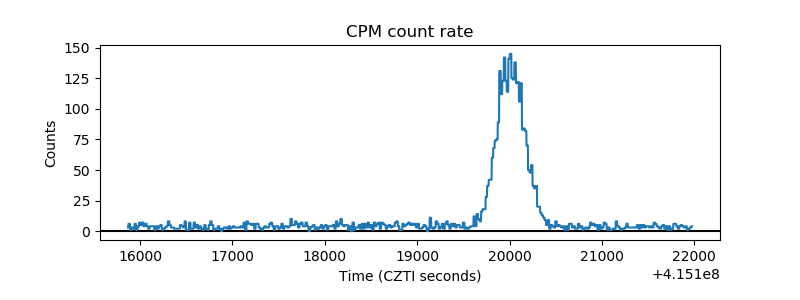 |
| CZT Counter | 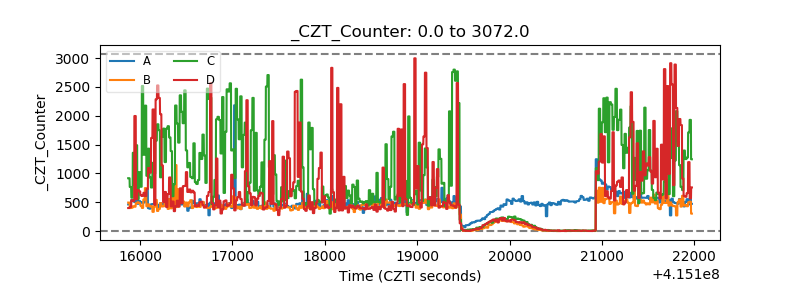 |
| +2.5 Volts monitor | 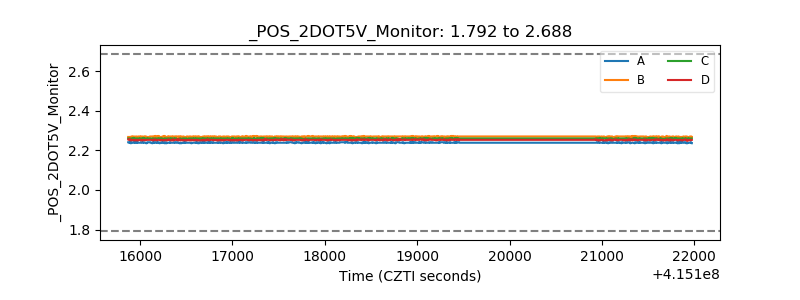 |
| +5 Volts monitor |  |
| _ROLL_ROT | 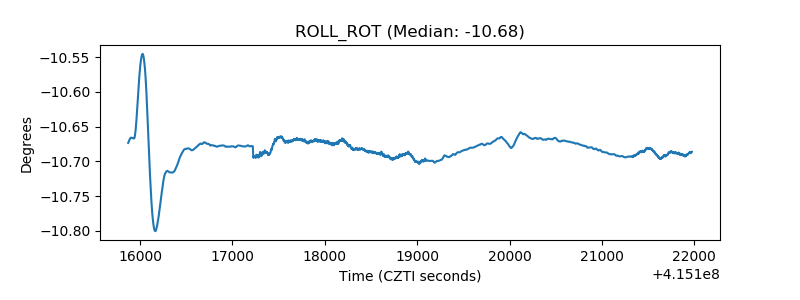 |
| _Roll_DEC | 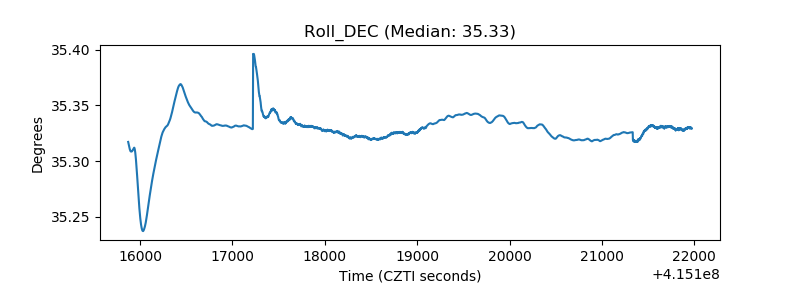 |
| _Roll_RA | 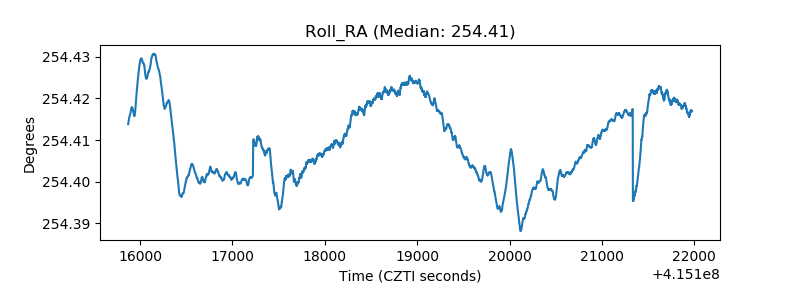 |
| Veto Counter | 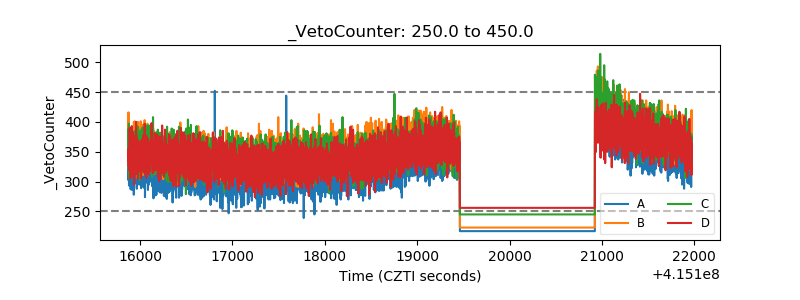 |