| Param | Original file | Final file |
|---|---|---|
| Filename | modeM0/AS1A12_004T01_9000005520_40093cztM0_level2.fits | modeM0/AS1A12_004T01_9000005520_40093cztM0_level2_quad_clean.evt |
| Size (bytes) | 485,965,440 | 88,683,840 |
| Size | 463.5 MB | 84.6 MB |
| Events in quadrant A | 3,127,747 | 614,121 |
| Events in quadrant B | 2,652,100 | 635,525 |
| Events in quadrant C | 7,339,586 | 508,270 |
| Events in quadrant D | 4,430,152 | 531,804 |
| Mode M0 | |||
|---|---|---|---|
| Quadrant | BADHDUFLAG | Total packets | Discarded packets |
| A | 0 | 12914 | 3 |
| B | 0 | 11651 | 2 |
| C | 0 | 25723 | 2 |
| D | 0 | 17204 | 2 |
| Mode M9 | |||
|---|---|---|---|
| Quadrant | BADHDUFLAG | Total packets | Discarded packets |
| A | 0 | 27 | 0 |
| B | 0 | 27 | 0 |
| C | 0 | 27 | 0 |
| D | 0 | 28 | 0 |
| Mode SS | |||
|---|---|---|---|
| Quadrant | BADHDUFLAG | Total packets | Discarded packets |
| A | 0 | 114 | 0 |
| B | 0 | 114 | 0 |
| C | 0 | 114 | 0 |
| D | 0 | 114 | 0 |
| Quadrant | Total seconds | Saturated seconds | Saturation percentage |
|---|---|---|---|
| A | 5656 | 72 | 1.272984% |
| B | 5656 | 9 | 0.159123% |
| C | 5656 | 1235 | 21.835219% |
| D | 5656 | 420 | 7.425743% |
Noise dominated data is calculated using 1-second bins in cleaned event files. If a bin has >2000 counts, and if more than 50% of those come from <1% of pixels, then it is considered to be noise-dominated and hence unusable.
| Quadrant | # 1 sec bins | Bins with >0 counts | Bins with >2000 counts | High rate bins dominated by noise | Noise dominated (total time) | Noise dominated (detector-on time) | Marked lightcurve |
|---|---|---|---|---|---|---|---|
| A | 7238 | 5657 | 36 | 36 | 0.50% | 0.64% | 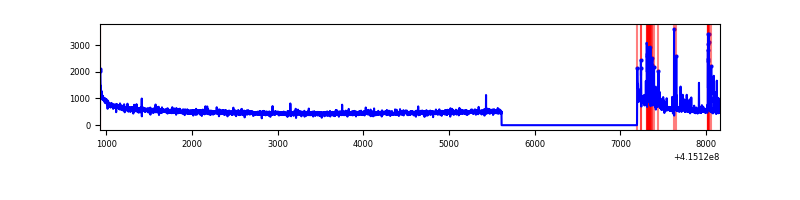 |
| B | 7238 | 5657 | 2 | 2 | 0.03% | 0.04% | 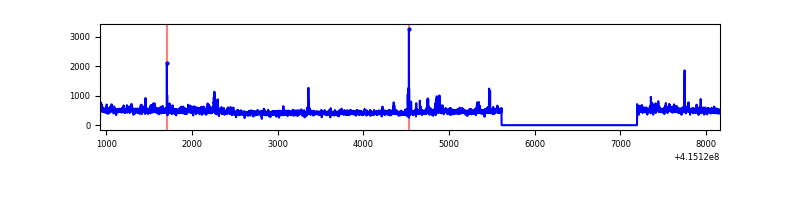 |
| C | 7238 | 5657 | 1019 | 1019 | 14.08% | 18.01% | 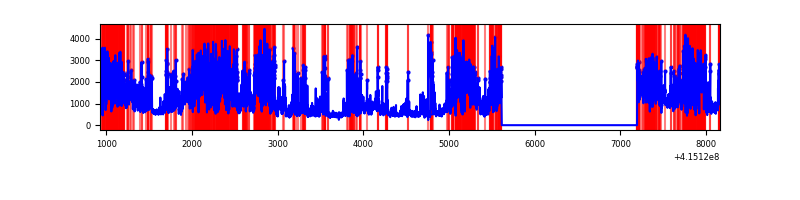 |
| D | 7238 | 5657 | 335 | 335 | 4.63% | 5.92% | 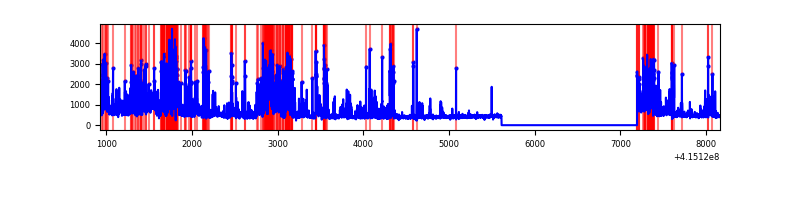 |
Top three noisy pixels from each quadrant. If the there are fewer than three noisy pixels in the level2.evt file, extra rows are filled as -1
| Pixel properties | Quadrant properties | ||||||
|---|---|---|---|---|---|---|---|
| Quadrant | DetID | PixID | Counts | Sigma | Mean | Median | Sigma |
| A | 10 | 83 | 492147 | 3856.72 | 621 | 609 | 127.4 |
| A | 13 | 248 | 148306 | 1158.86 | 621 | 609 | 127.4 |
| A | 2 | 79 | 59174 | 459.51 | 621 | 609 | 127.4 |
| B | 0 | 189 | 127751 | 1041.29 | 623 | 604 | 122.1 |
| B | 4 | 171 | 38601 | 311.18 | 623 | 604 | 122.1 |
| B | 12 | 111 | 15460 | 121.67 | 623 | 604 | 122.1 |
| C | 9 | 187 | 4727202 | 35514.46 | 570 | 572 | 133.1 |
| C | 15 | 214 | 217640 | 1630.98 | 570 | 572 | 133.1 |
| C | 3 | 233 | 88082 | 657.52 | 570 | 572 | 133.1 |
| D | 12 | 227 | 774475 | 5302.44 | 592 | 576 | 146.0 |
| D | 13 | 249 | 443940 | 3037.75 | 592 | 576 | 146.0 |
| D | 12 | 218 | 429275 | 2937.27 | 592 | 576 | 146.0 |
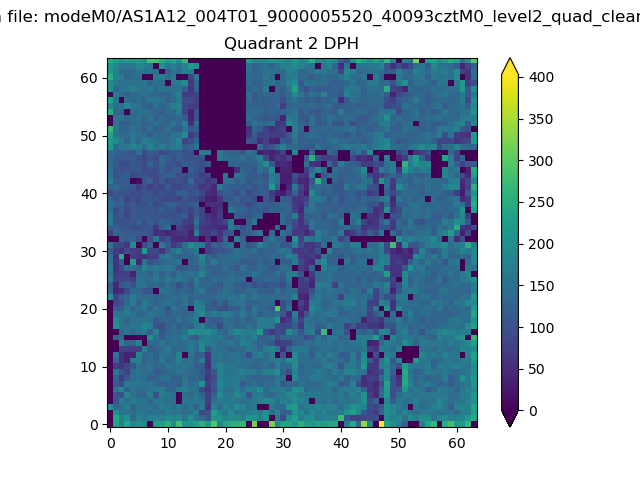
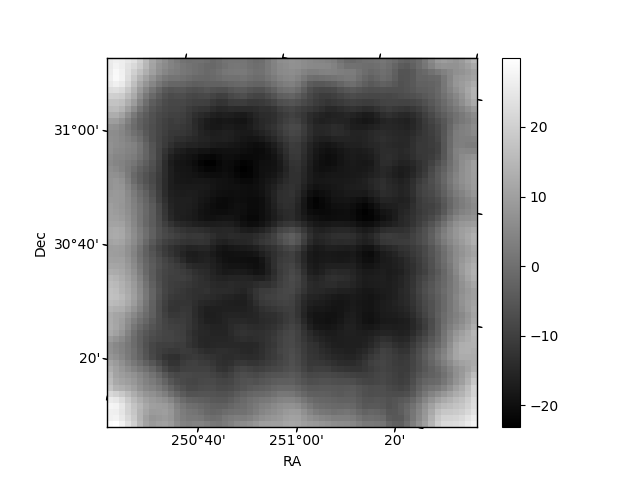
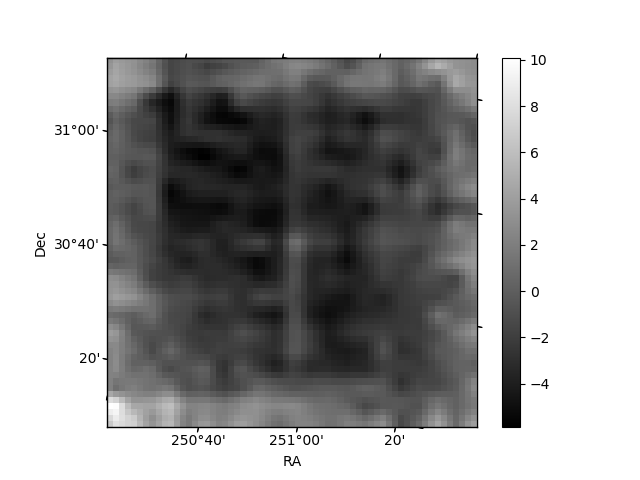
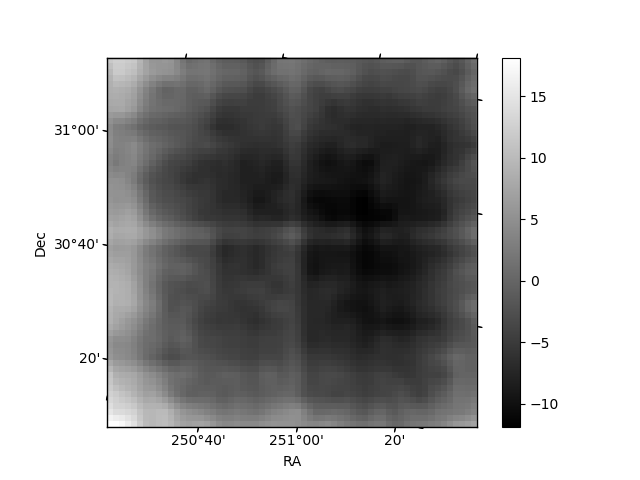
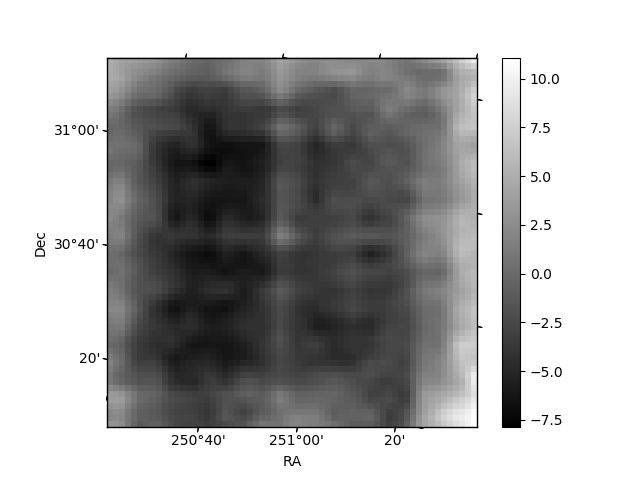
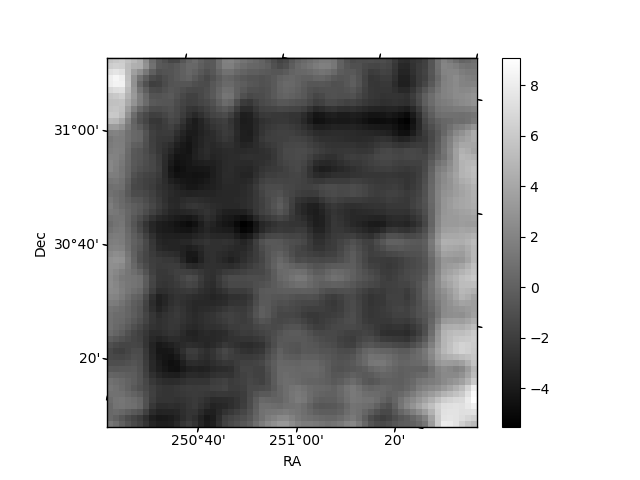
Histogram calculated using DETX and DETY for each event in the final _common_clean file
| Quadrant A | 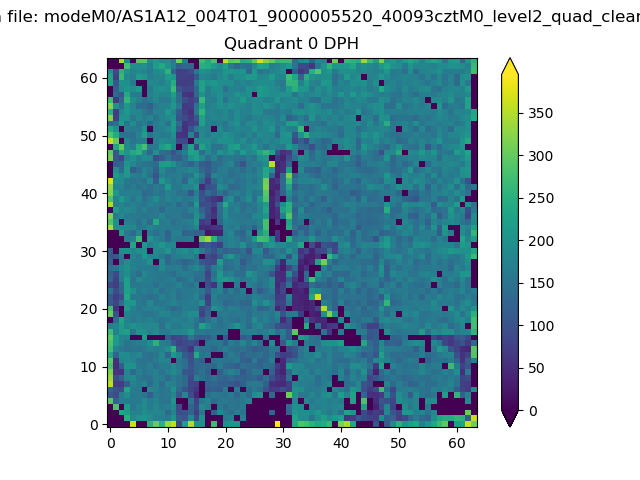 |
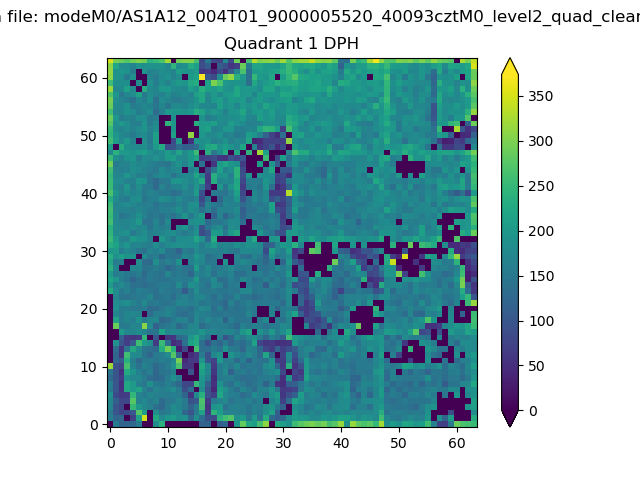 |
Quadrant B |
|---|---|---|---|
| Quadrant D | 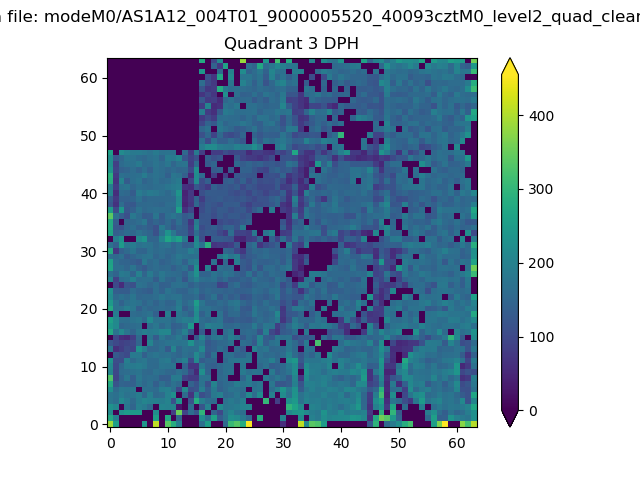 |
 |
Quadrant C |
| Plot type | Count rate plots | Images |
|---|---|---|
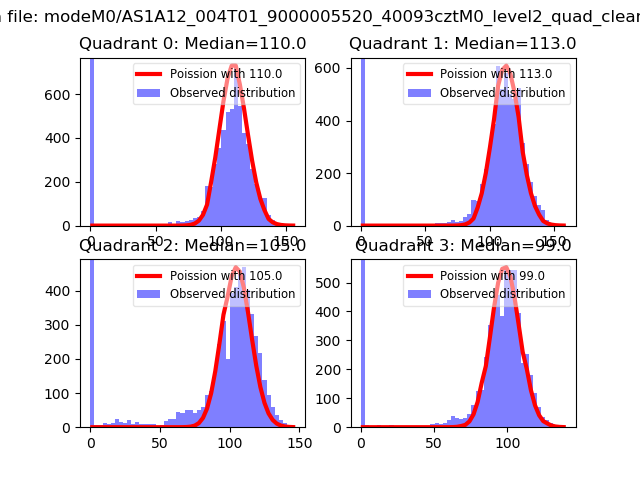
| Comparison with Poisson distribution Blue bars denote a histogram of data divided into 1 sec bins. Red curve is a Poisson curve with rate = median count rate of data. |
 |
 |
| Quadrant-wise count rates Data is divided into 100 sec bins |
 |
|
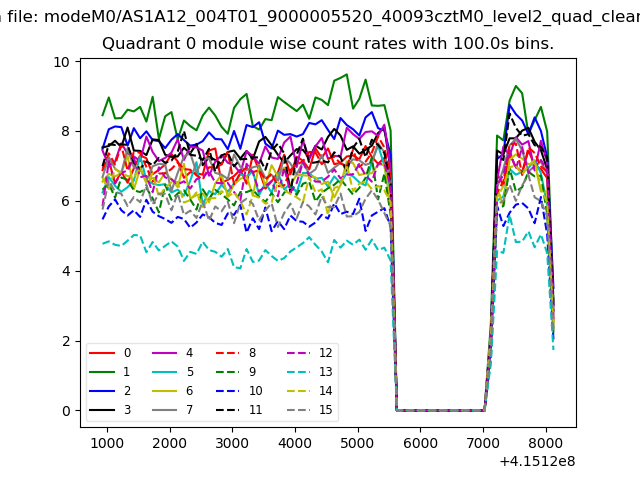
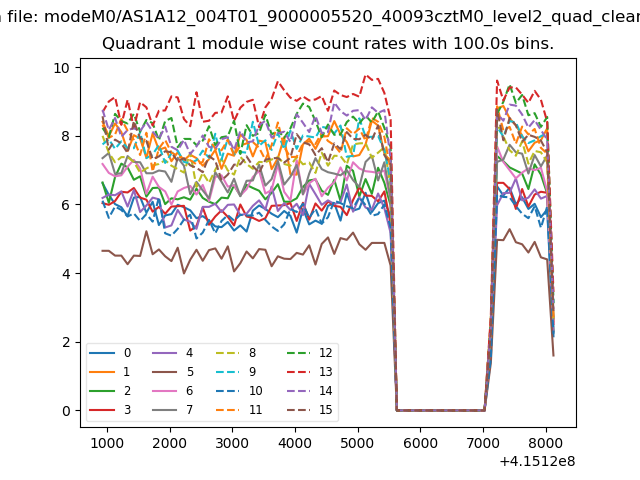
| Module-wise count rates for Quadrant A Data is divided into 100 sec bins |
 |
 |
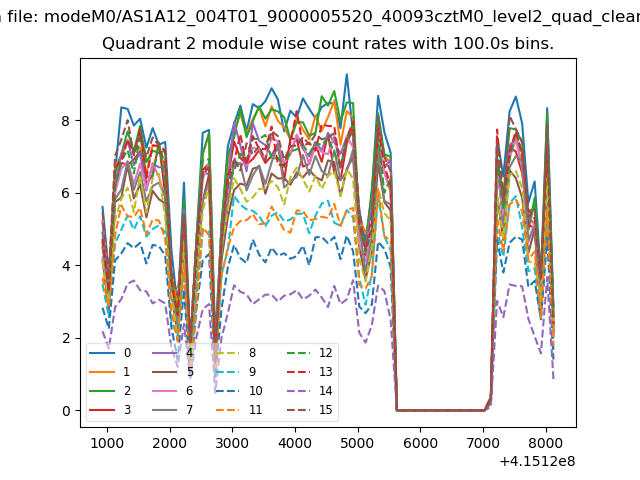
| Module-wise count rates for Quadrant B Data is divided into 100 sec bins |
 |
 |
| Module-wise count rates for Quadrant C Data is divided into 100 sec bins |
 |
 |
| Module-wise count rates for Quadrant D Data is divided into 100 sec bins |
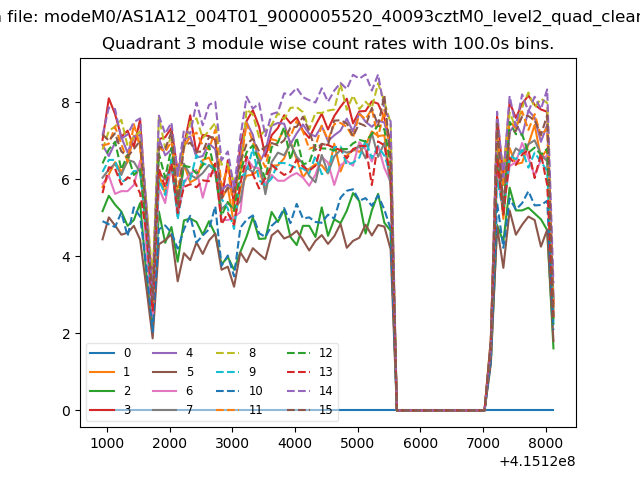 |
 |
| Parameter | Plot |
|---|---|
| CZT HV Monitor | 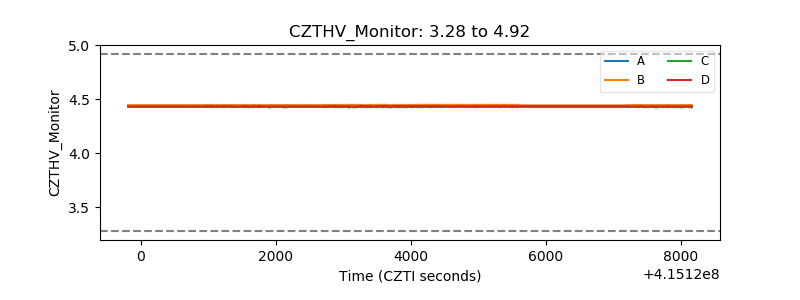 |
| D_VDD | 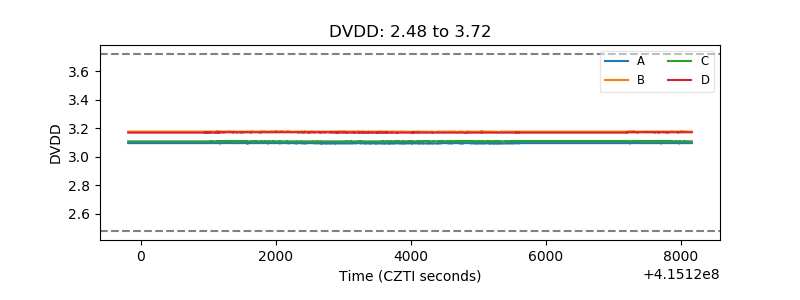 |
| Temperature 1 | 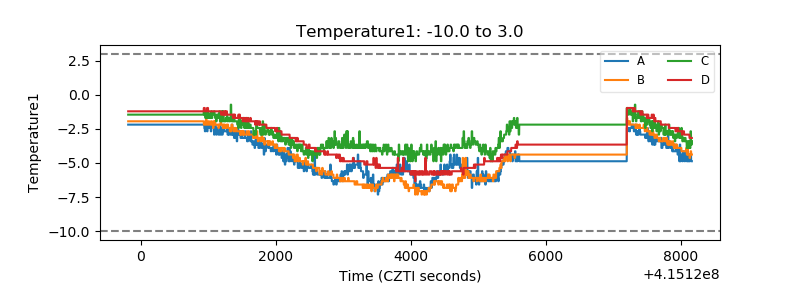 |
| Veto HV Monitor |  |
| Veto LLD | 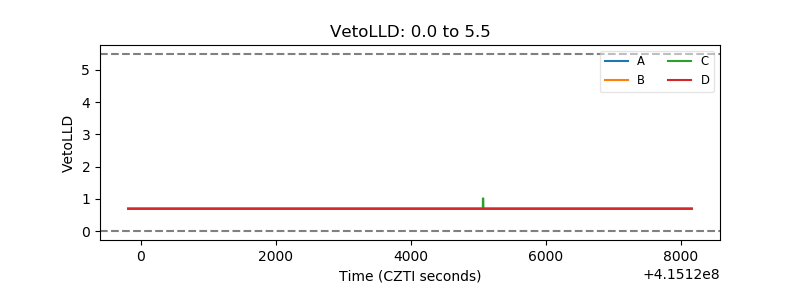 |
| Alpha Counter | 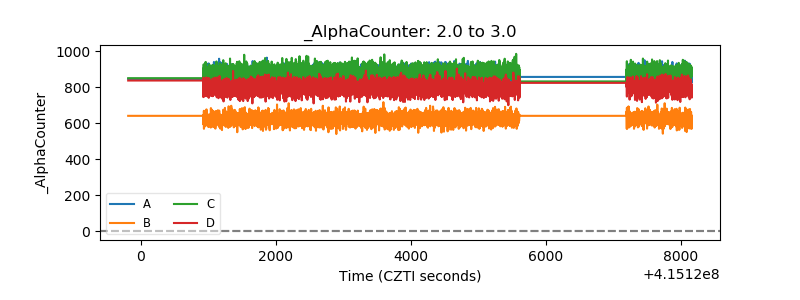 |
| _CPM_Rate |  |
| CZT Counter | 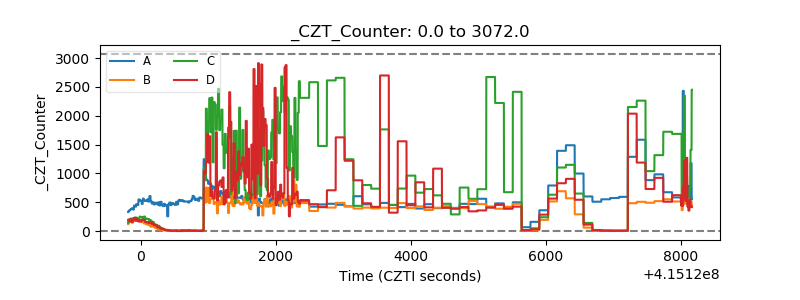 |
| +2.5 Volts monitor | 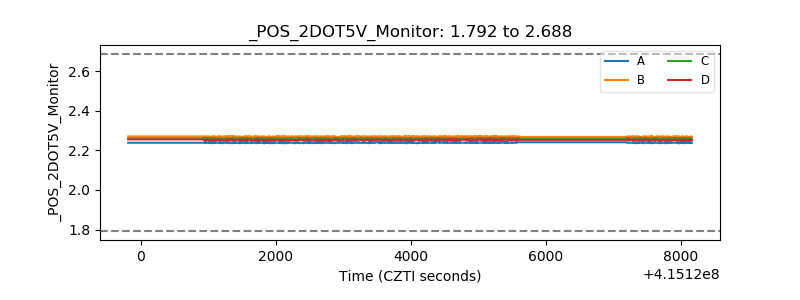 |
| +5 Volts monitor | 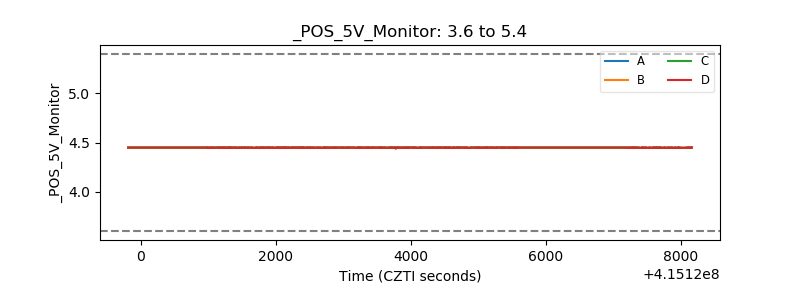 |
| _ROLL_ROT | 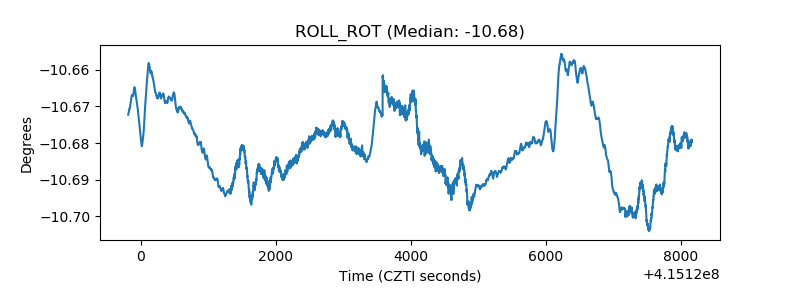 |
| _Roll_DEC | 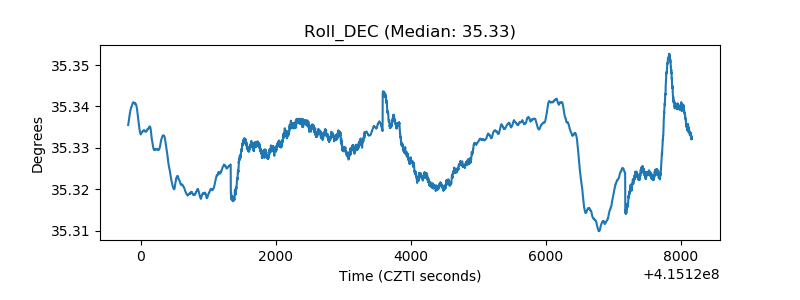 |
| _Roll_RA | 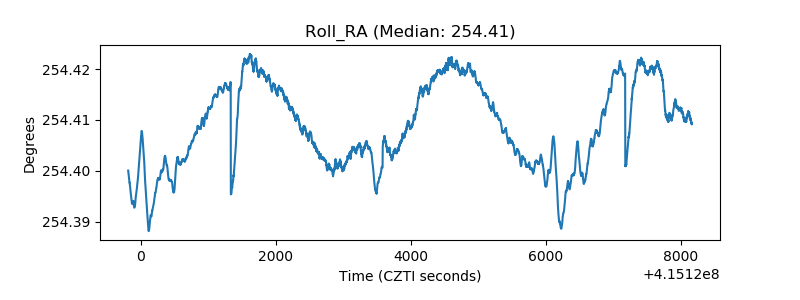 |
| Veto Counter | 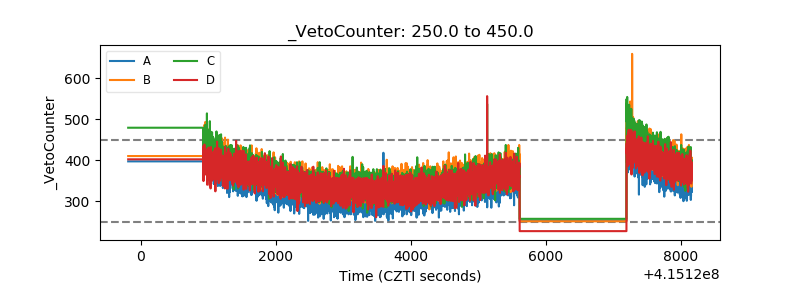 |