| Param | Original file | Final file |
|---|---|---|
| Filename | modeM0/AS1A12_004T01_9000005520_40094cztM0_level2.fits | modeM0/AS1A12_004T01_9000005520_40094cztM0_level2_quad_clean.evt |
| Size (bytes) | 457,692,480 | 86,178,240 |
| Size | 436.5 MB | 82.2 MB |
| Events in quadrant A | 3,115,495 | 603,212 |
| Events in quadrant B | 2,709,755 | 616,974 |
| Events in quadrant C | 7,034,907 | 479,037 |
| Events in quadrant D | 3,661,202 | 530,631 |
| Mode M0 | |||
|---|---|---|---|
| Quadrant | BADHDUFLAG | Total packets | Discarded packets |
| A | 0 | 12773 | 3 |
| B | 0 | 11675 | 2 |
| C | 0 | 24689 | 2 |
| D | 0 | 14892 | 2 |
| Mode M9 | |||
|---|---|---|---|
| Quadrant | BADHDUFLAG | Total packets | Discarded packets |
| A | 0 | 19 | 0 |
| B | 0 | 19 | 0 |
| C | 0 | 19 | 0 |
| D | 0 | 20 | 0 |
| Mode SS | |||
|---|---|---|---|
| Quadrant | BADHDUFLAG | Total packets | Discarded packets |
| A | 0 | 112 | 0 |
| B | 0 | 112 | 0 |
| C | 0 | 112 | 0 |
| D | 0 | 112 | 0 |
| Quadrant | Total seconds | Saturated seconds | Saturation percentage |
|---|---|---|---|
| A | 5417 | 75 | 1.384530% |
| B | 5417 | 70 | 1.292228% |
| C | 5417 | 1374 | 25.364593% |
| D | 5417 | 305 | 5.630423% |
Noise dominated data is calculated using 1-second bins in cleaned event files. If a bin has >2000 counts, and if more than 50% of those come from <1% of pixels, then it is considered to be noise-dominated and hence unusable.
| Quadrant | # 1 sec bins | Bins with >0 counts | Bins with >2000 counts | High rate bins dominated by noise | Noise dominated (total time) | Noise dominated (detector-on time) | Marked lightcurve |
|---|---|---|---|---|---|---|---|
| A | 7149 | 5418 | 36 | 36 | 0.50% | 0.66% | 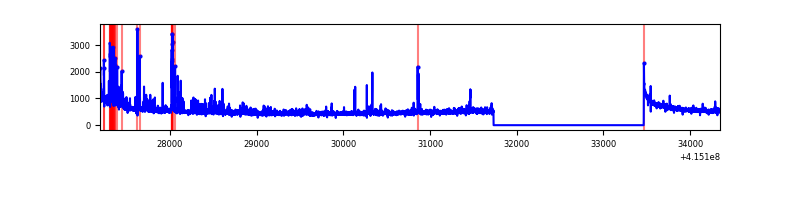 |
| B | 7149 | 5418 | 42 | 42 | 0.59% | 0.78% | 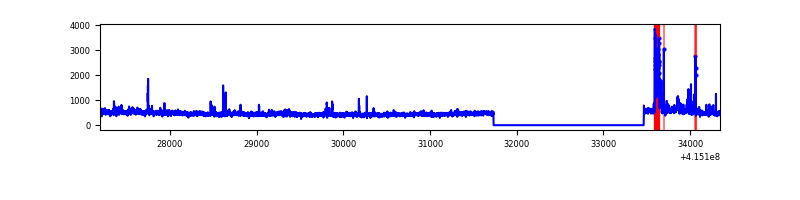 |
| C | 7149 | 5418 | 1160 | 1160 | 16.23% | 21.41% | 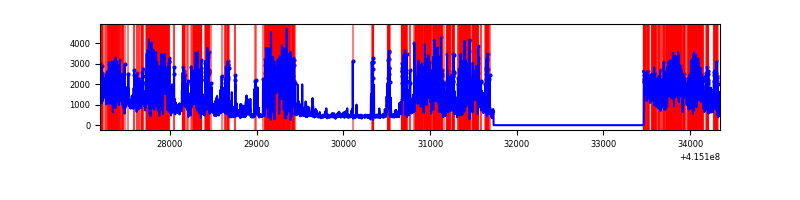 |
| D | 7149 | 5418 | 244 | 244 | 3.41% | 4.50% | 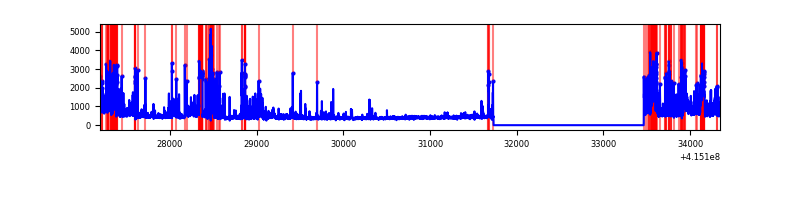 |
Top three noisy pixels from each quadrant. If the there are fewer than three noisy pixels in the level2.evt file, extra rows are filled as -1
| Pixel properties | Quadrant properties | ||||||
|---|---|---|---|---|---|---|---|
| Quadrant | DetID | PixID | Counts | Sigma | Mean | Median | Sigma |
| A | 10 | 83 | 472727 | 3844.77 | 596 | 583 | 122.8 |
| A | 13 | 248 | 151749 | 1230.98 | 596 | 583 | 122.8 |
| A | 2 | 79 | 131115 | 1062.95 | 596 | 583 | 122.8 |
| B | 10 | 246 | 151329 | 1287.78 | 597 | 582 | 117.1 |
| B | 0 | 189 | 82895 | 703.17 | 597 | 582 | 117.1 |
| B | 0 | 230 | 61325 | 518.91 | 597 | 582 | 117.1 |
| C | 9 | 187 | 4456006 | 35407.4 | 537 | 540 | 125.8 |
| C | 15 | 214 | 204155 | 1618.12 | 537 | 540 | 125.8 |
| C | 3 | 233 | 121399 | 960.46 | 537 | 540 | 125.8 |
| D | 12 | 227 | 565577 | 4043.16 | 573 | 558 | 139.7 |
| D | 13 | 249 | 432618 | 3091.73 | 573 | 558 | 139.7 |
| D | 12 | 233 | 118525 | 844.15 | 573 | 558 | 139.7 |
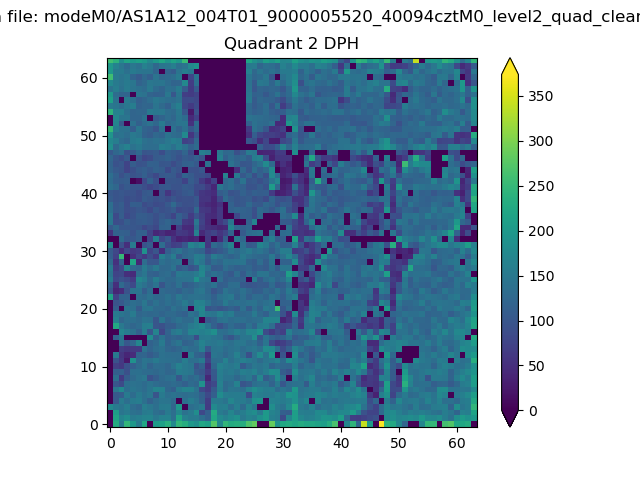
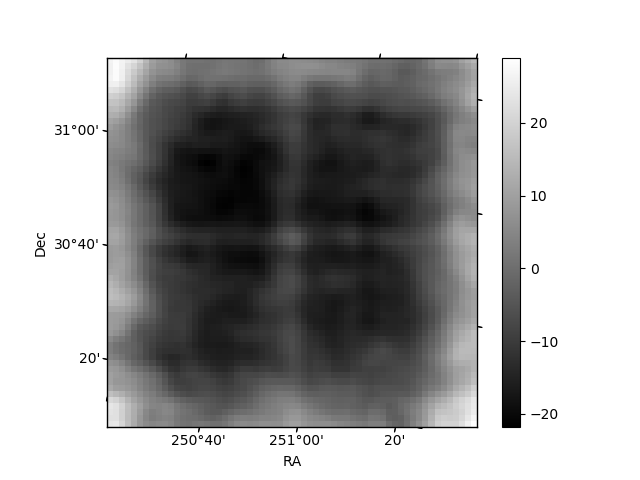
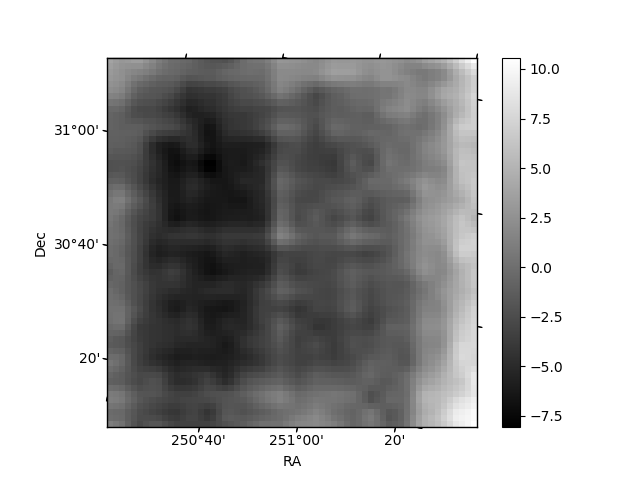
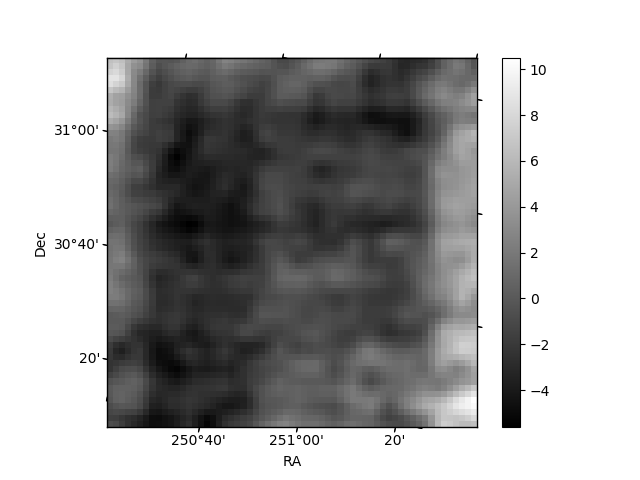
Histogram calculated using DETX and DETY for each event in the final _common_clean file
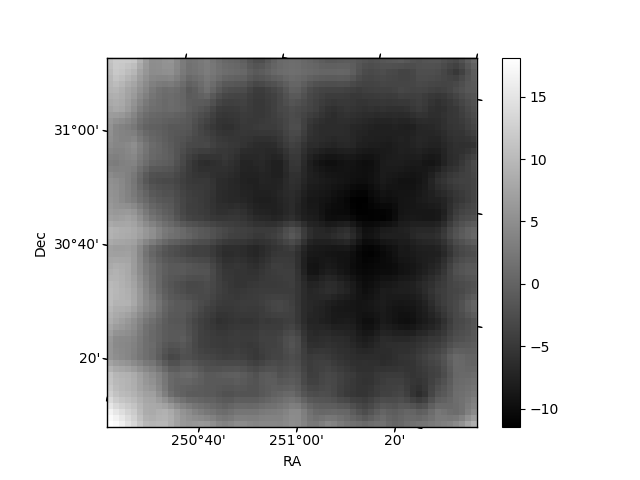
| Quadrant A | 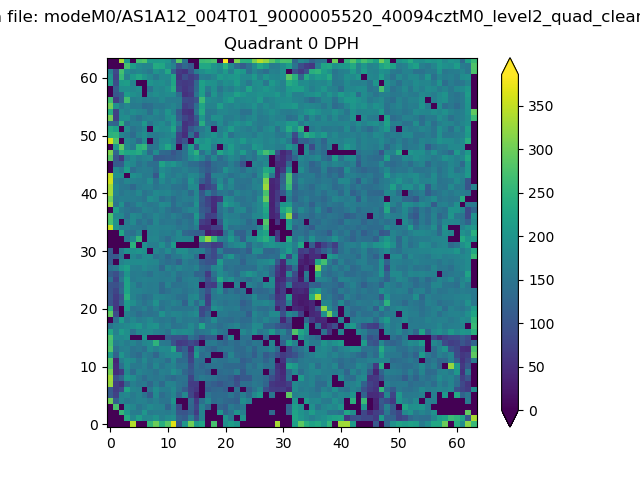 |
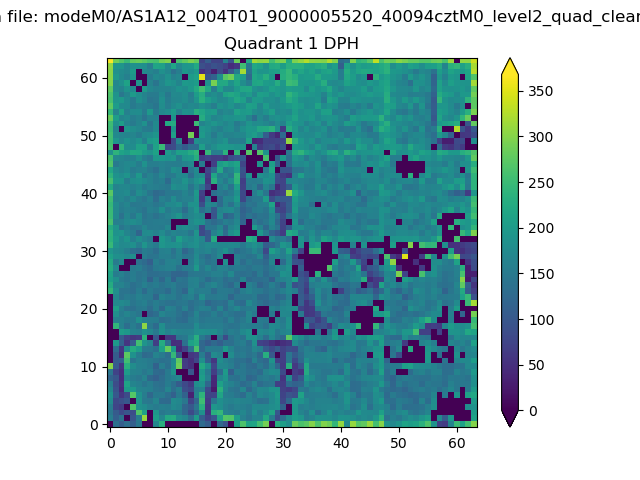 |
Quadrant B |
|---|---|---|---|
| Quadrant D | 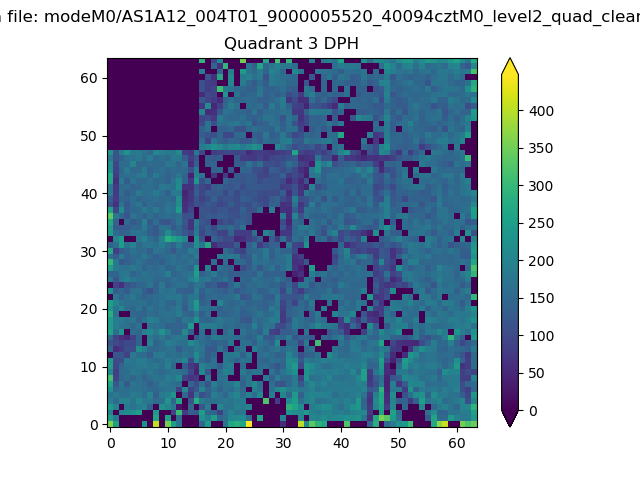 |
 |
Quadrant C |
| Plot type | Count rate plots | Images |
|---|---|---|
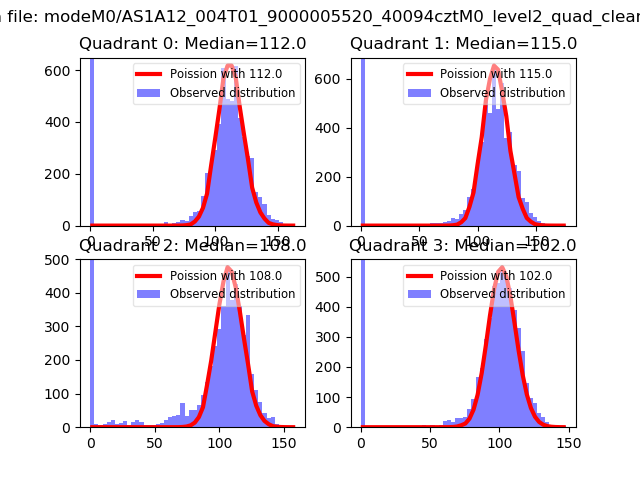
| Comparison with Poisson distribution Blue bars denote a histogram of data divided into 1 sec bins. Red curve is a Poisson curve with rate = median count rate of data. |
 |
 |
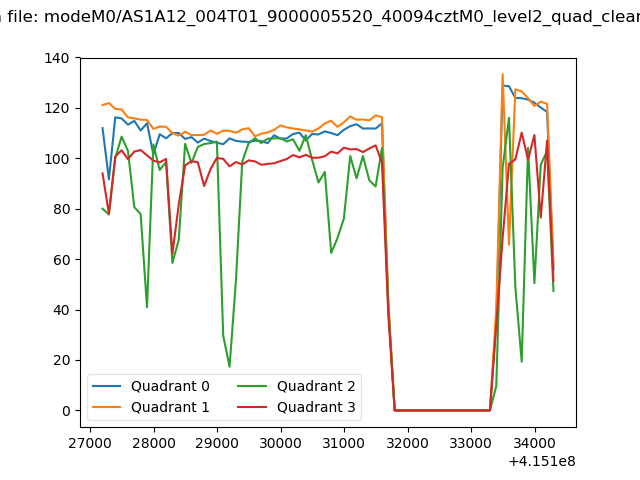
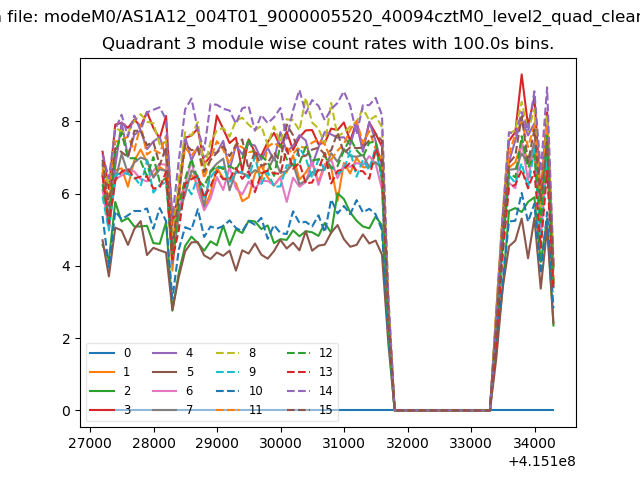
| Quadrant-wise count rates Data is divided into 100 sec bins |
 |
|
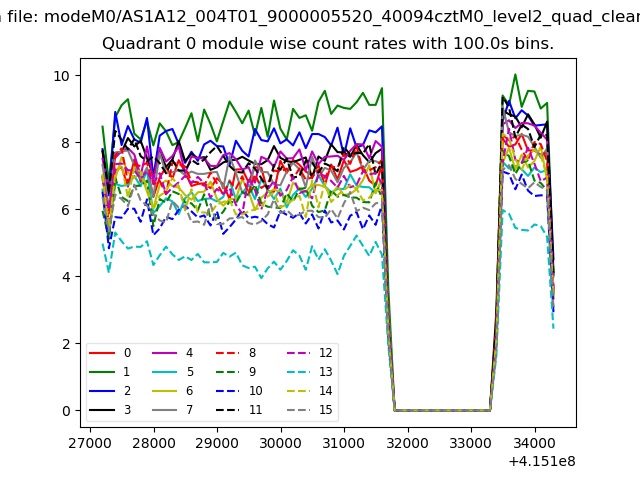
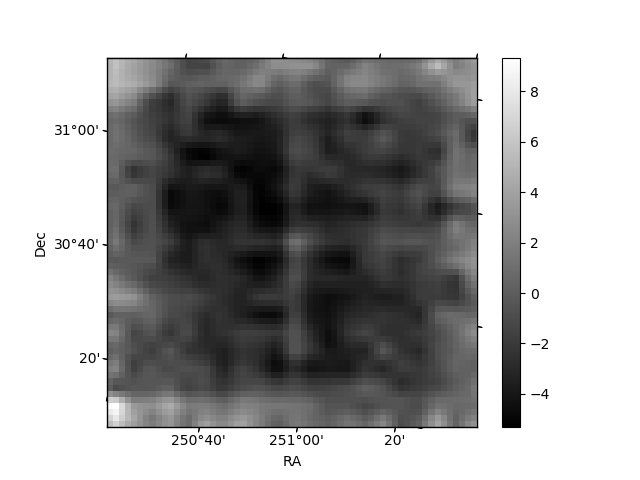
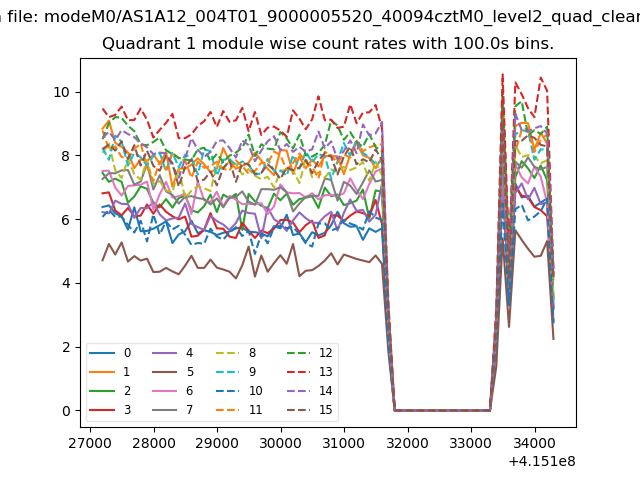
| Module-wise count rates for Quadrant A Data is divided into 100 sec bins |
 |
 |
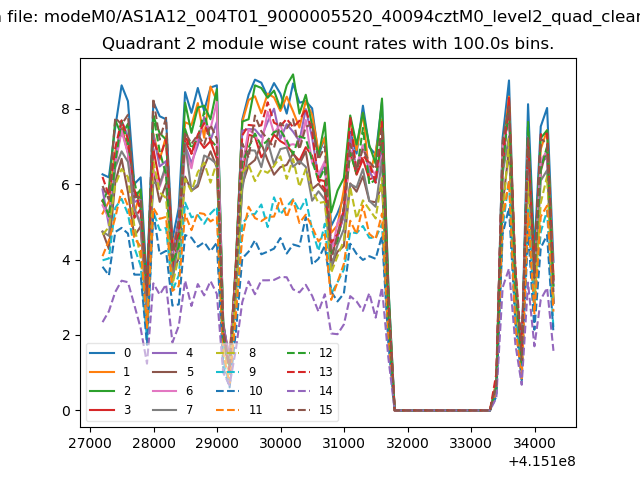
| Module-wise count rates for Quadrant B Data is divided into 100 sec bins |
 |
 |
| Module-wise count rates for Quadrant C Data is divided into 100 sec bins |
 |
 |
| Module-wise count rates for Quadrant D Data is divided into 100 sec bins |
 |
 |
| Parameter | Plot |
|---|---|
| CZT HV Monitor | 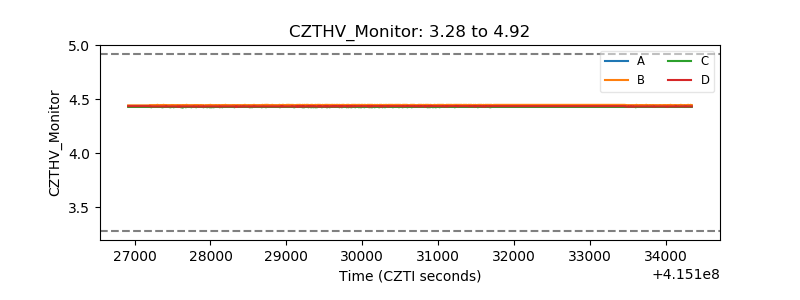 |
| D_VDD | 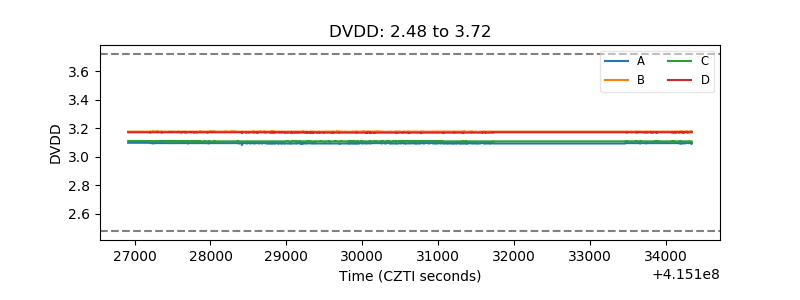 |
| Temperature 1 | 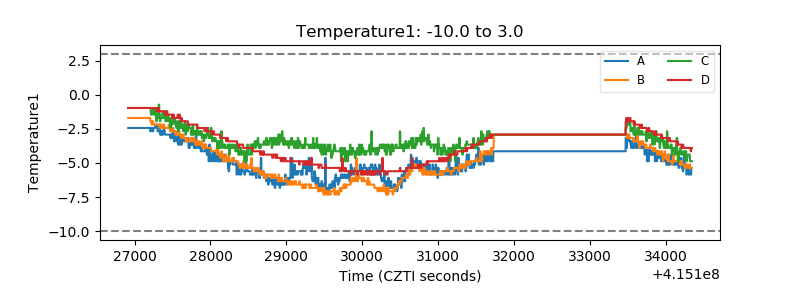 |
| Veto HV Monitor | 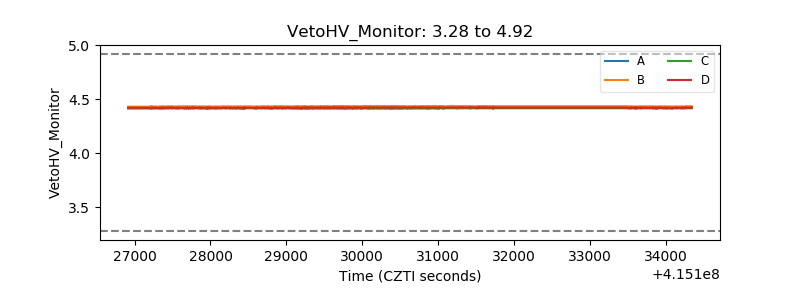 |
| Veto LLD | 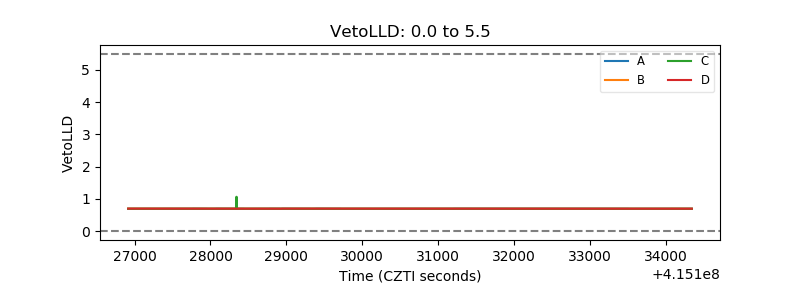 |
| Alpha Counter | 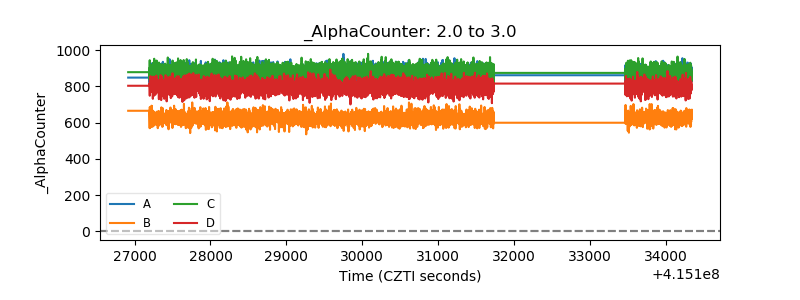 |
| _CPM_Rate | 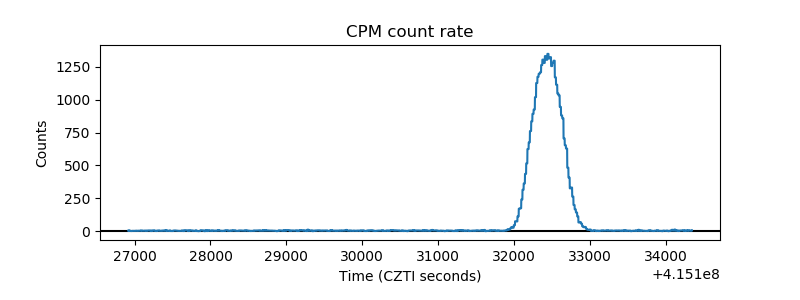 |
| CZT Counter | 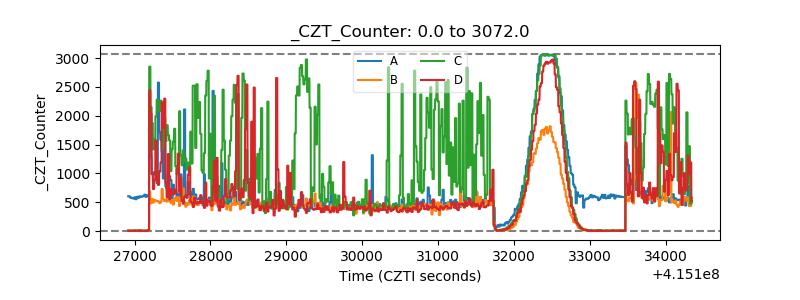 |
| +2.5 Volts monitor | 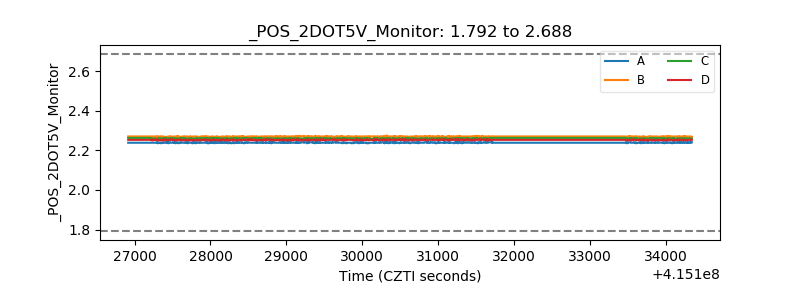 |
| +5 Volts monitor |  |
| _ROLL_ROT | 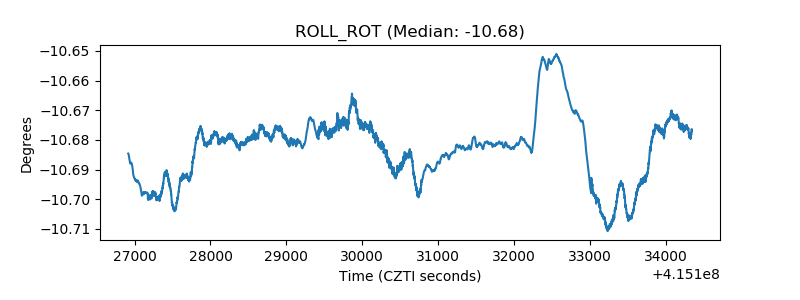 |
| _Roll_DEC | 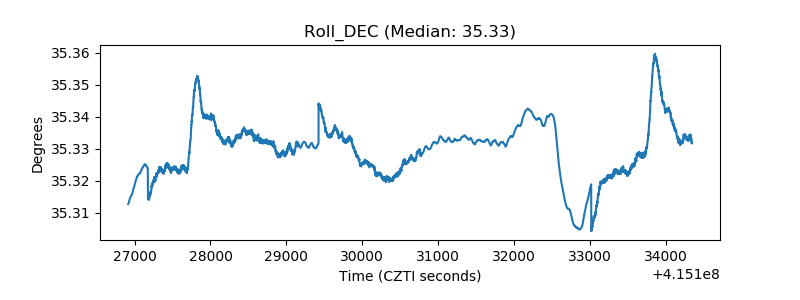 |
| _Roll_RA | 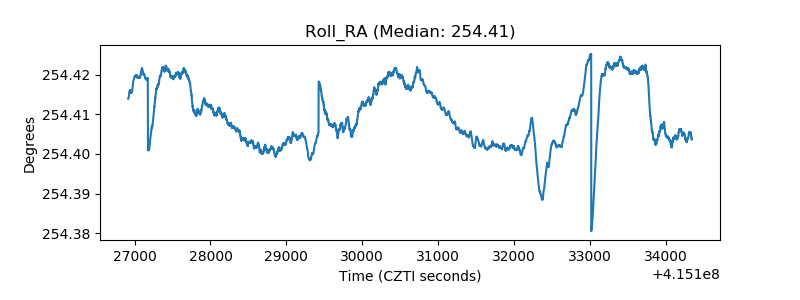 |
| Veto Counter | 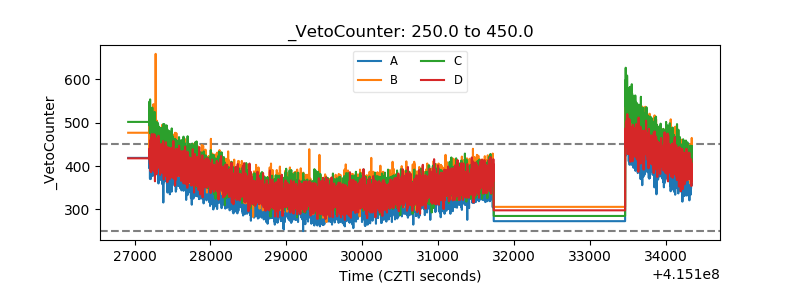 |