| Param | Original file | Final file |
|---|---|---|
| Filename | modeM0/AS1A12_004T01_9000005520_40096cztM0_level2.fits | modeM0/AS1A12_004T01_9000005520_40096cztM0_level2_quad_clean.evt |
| Size (bytes) | 447,431,040 | 85,930,560 |
| Size | 426.7 MB | 81.9 MB |
| Events in quadrant A | 2,742,843 | 606,335 |
| Events in quadrant B | 2,674,878 | 619,158 |
| Events in quadrant C | 6,295,334 | 514,434 |
| Events in quadrant D | 4,447,598 | 499,991 |
| Mode M0 | |||
|---|---|---|---|
| Quadrant | BADHDUFLAG | Total packets | Discarded packets |
| A | 0 | 11453 | 3 |
| B | 0 | 11392 | 2 |
| C | 0 | 22273 | 2 |
| D | 0 | 16860 | 2 |
| Mode M9 | |||
|---|---|---|---|
| Quadrant | BADHDUFLAG | Total packets | Discarded packets |
| A | 0 | 27 | 0 |
| B | 0 | 27 | 0 |
| C | 0 | 27 | 0 |
| D | 0 | 28 | 0 |
| Mode SS | |||
|---|---|---|---|
| Quadrant | BADHDUFLAG | Total packets | Discarded packets |
| A | 0 | 104 | 0 |
| B | 0 | 104 | 0 |
| C | 0 | 104 | 0 |
| D | 0 | 104 | 0 |
| Quadrant | Total seconds | Saturated seconds | Saturation percentage |
|---|---|---|---|
| A | 5170 | 15 | 0.290135% |
| B | 5170 | 77 | 1.489362% |
| C | 5170 | 977 | 18.897485% |
| D | 5170 | 622 | 12.030948% |
Noise dominated data is calculated using 1-second bins in cleaned event files. If a bin has >2000 counts, and if more than 50% of those come from <1% of pixels, then it is considered to be noise-dominated and hence unusable.
| Quadrant | # 1 sec bins | Bins with >0 counts | Bins with >2000 counts | High rate bins dominated by noise | Noise dominated (total time) | Noise dominated (detector-on time) | Marked lightcurve |
|---|---|---|---|---|---|---|---|
| A | 7022 | 5171 | 3 | 3 | 0.04% | 0.06% | 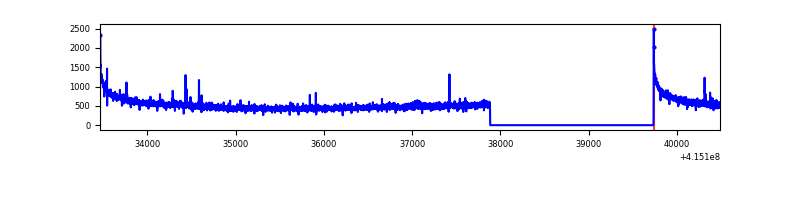 |
| B | 7022 | 5171 | 51 | 51 | 0.73% | 0.99% | 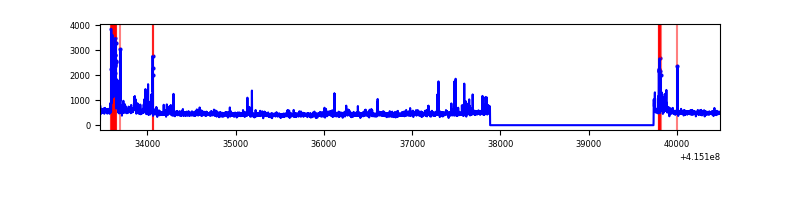 |
| C | 7022 | 5171 | 863 | 863 | 12.29% | 16.69% | 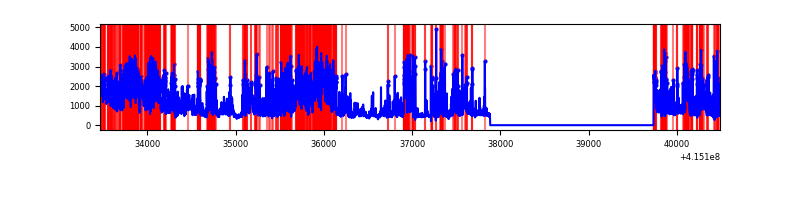 |
| D | 7022 | 5171 | 560 | 560 | 7.97% | 10.83% | 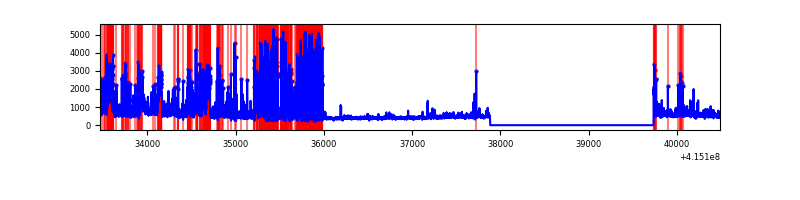 |
Top three noisy pixels from each quadrant. If the there are fewer than three noisy pixels in the level2.evt file, extra rows are filled as -1
| Pixel properties | Quadrant properties | ||||||
|---|---|---|---|---|---|---|---|
| Quadrant | DetID | PixID | Counts | Sigma | Mean | Median | Sigma |
| A | 10 | 83 | 447943 | 3783.27 | 580 | 569 | 118.3 |
| A | 9 | 143 | 17805 | 145.76 | 580 | 569 | 118.3 |
| A | 2 | 79 | 16858 | 137.75 | 580 | 569 | 118.3 |
| B | 10 | 246 | 185204 | 1656.11 | 578 | 562 | 111.5 |
| B | 4 | 171 | 107221 | 956.66 | 578 | 562 | 111.5 |
| B | 0 | 189 | 91844 | 818.73 | 578 | 562 | 111.5 |
| C | 9 | 187 | 3595866 | 28495.78 | 541 | 545 | 126.2 |
| C | 9 | 54 | 264480 | 2091.9 | 541 | 545 | 126.2 |
| C | 15 | 214 | 203920 | 1611.91 | 541 | 545 | 126.2 |
| D | 12 | 227 | 1560929 | 11753.01 | 540 | 524 | 132.8 |
| D | 13 | 249 | 446967 | 3362.62 | 540 | 524 | 132.8 |
| D | 2 | 249 | 111635 | 836.89 | 540 | 524 | 132.8 |
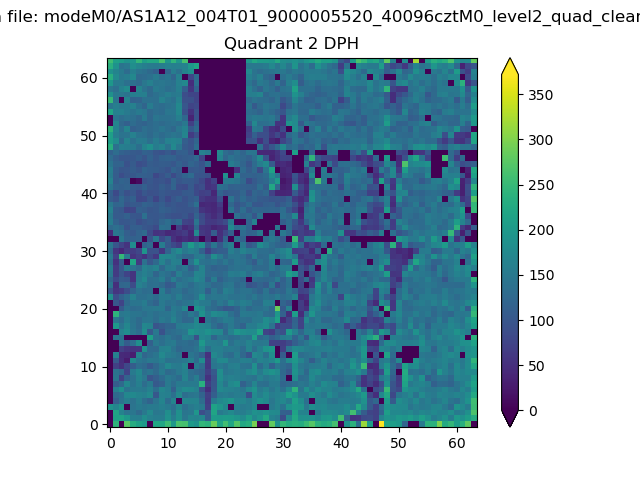
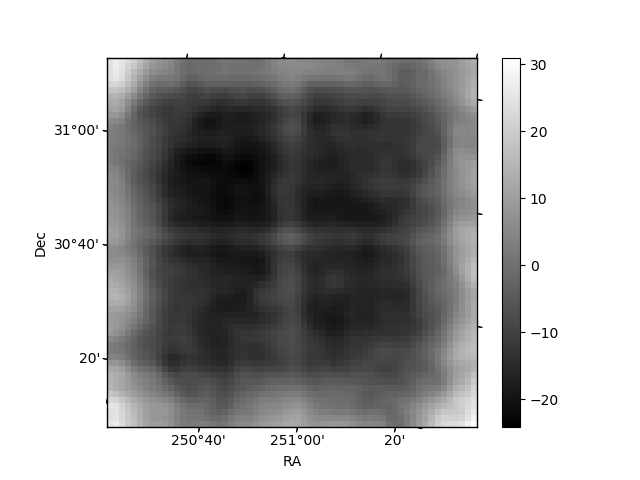
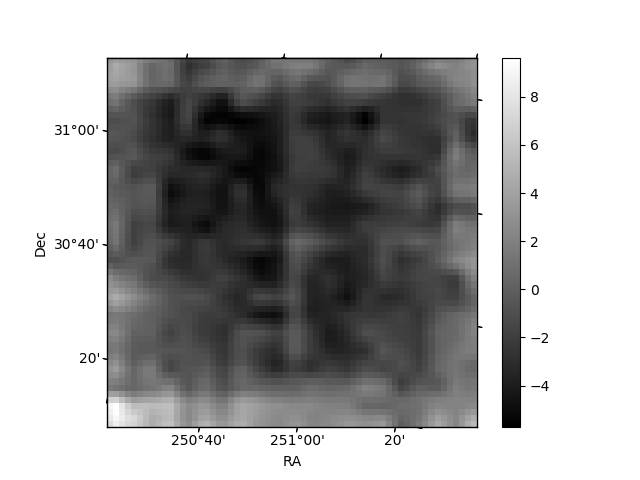
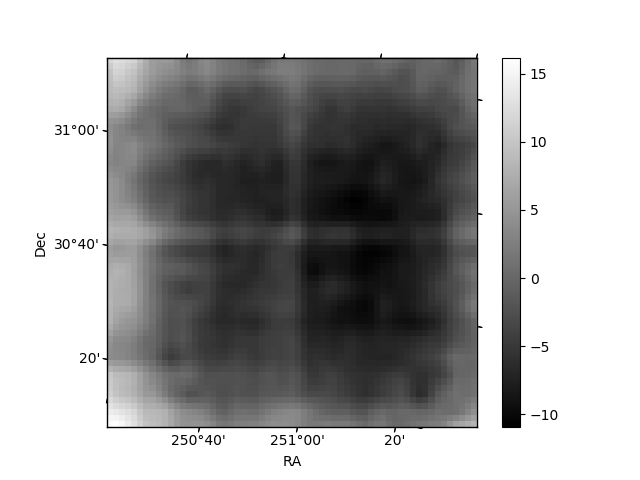
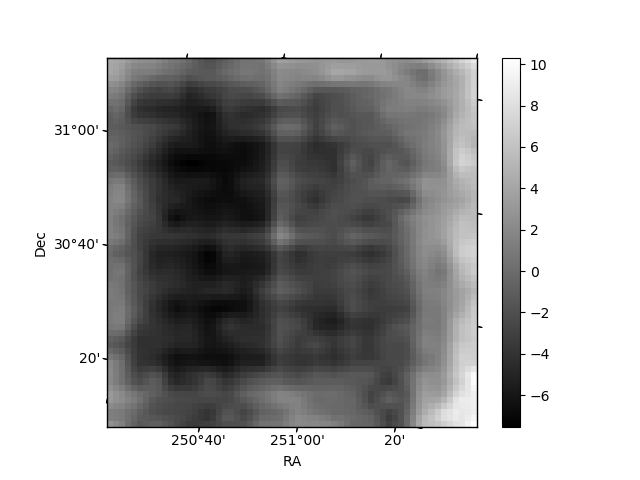
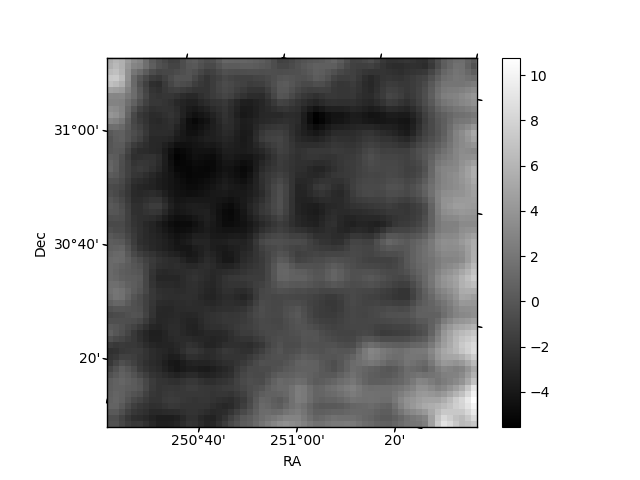
Histogram calculated using DETX and DETY for each event in the final _common_clean file
| Quadrant A | 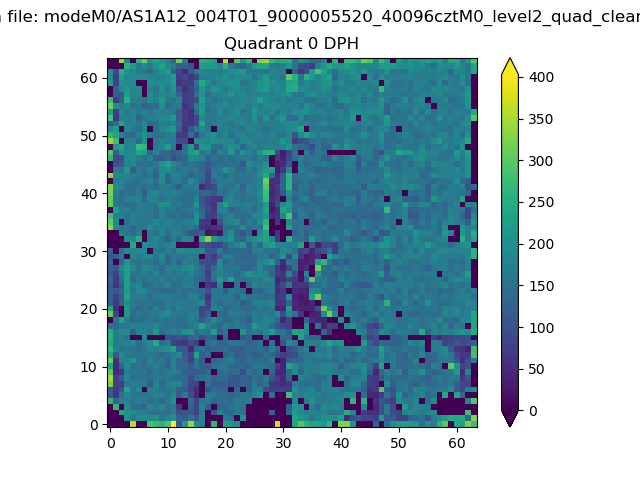 |
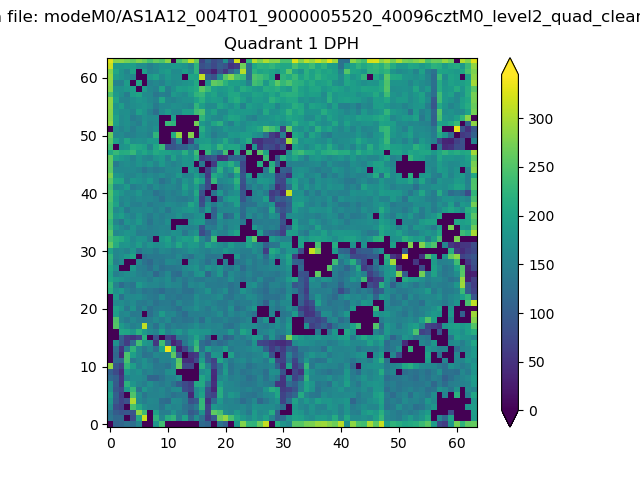 |
Quadrant B |
|---|---|---|---|
| Quadrant D | 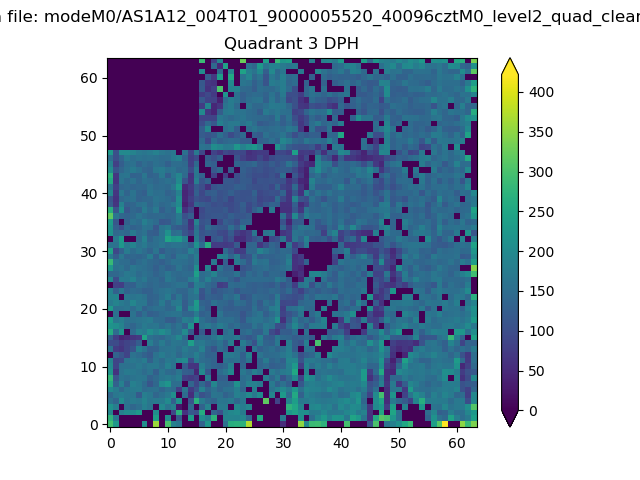 |
 |
Quadrant C |
| Plot type | Count rate plots | Images |
|---|---|---|
| Comparison with Poisson distribution Blue bars denote a histogram of data divided into 1 sec bins. Red curve is a Poisson curve with rate = median count rate of data. |
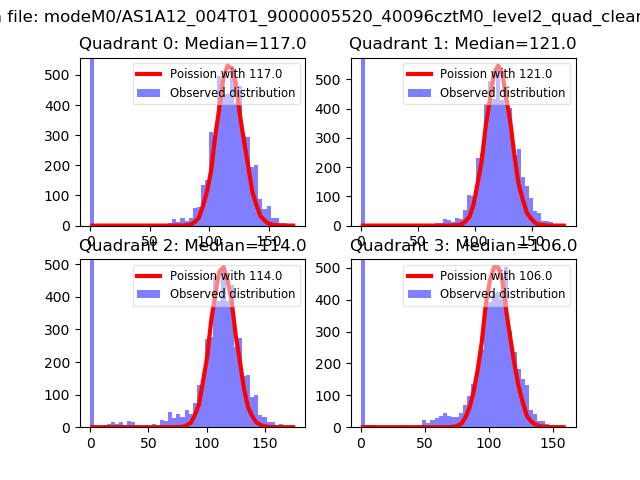 |
 |
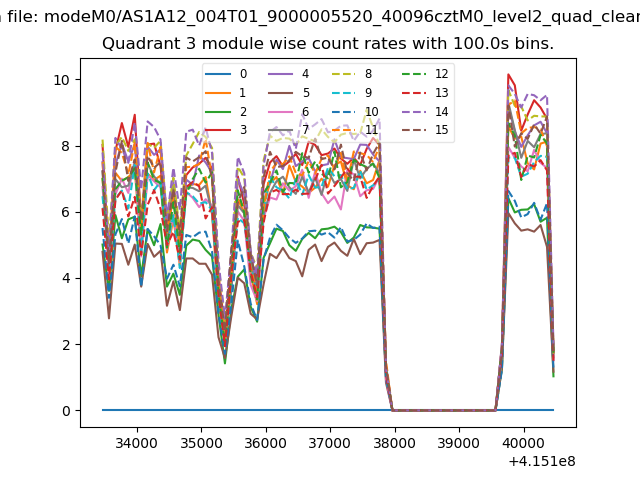
| Quadrant-wise count rates Data is divided into 100 sec bins |
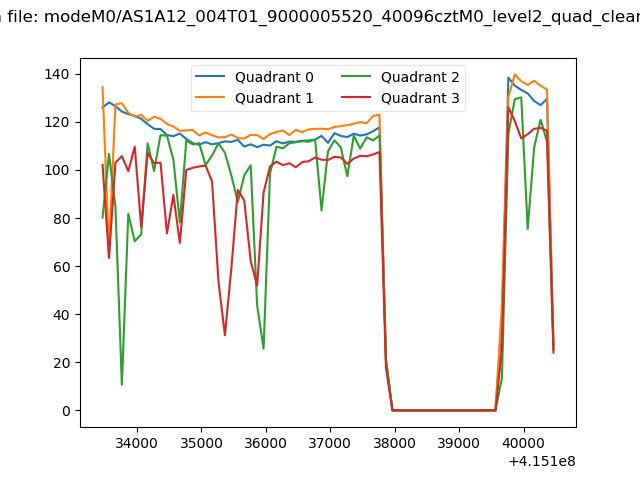 |
|
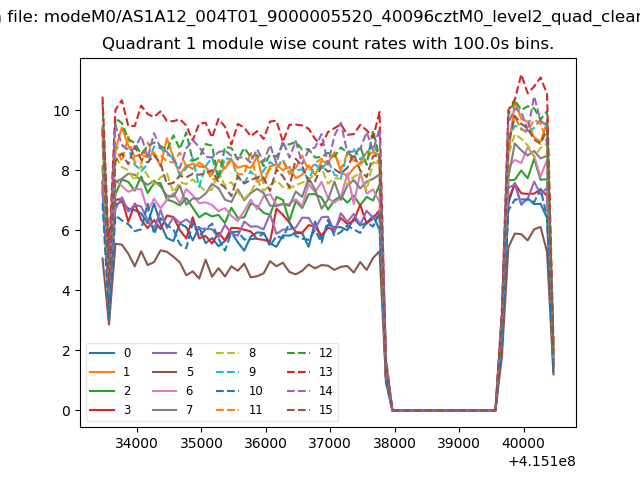
| Module-wise count rates for Quadrant A Data is divided into 100 sec bins |
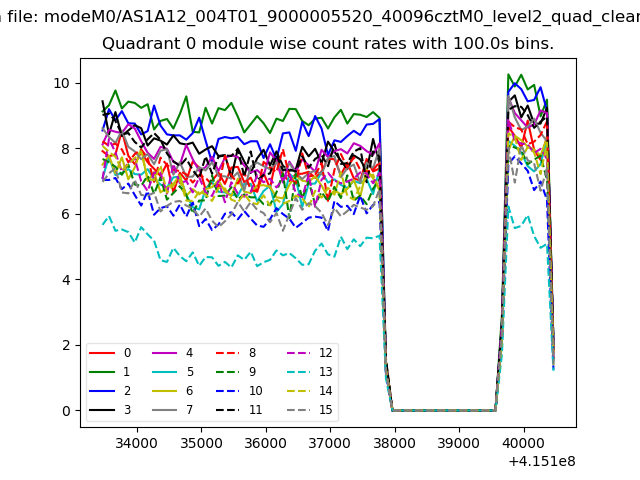 |
 |
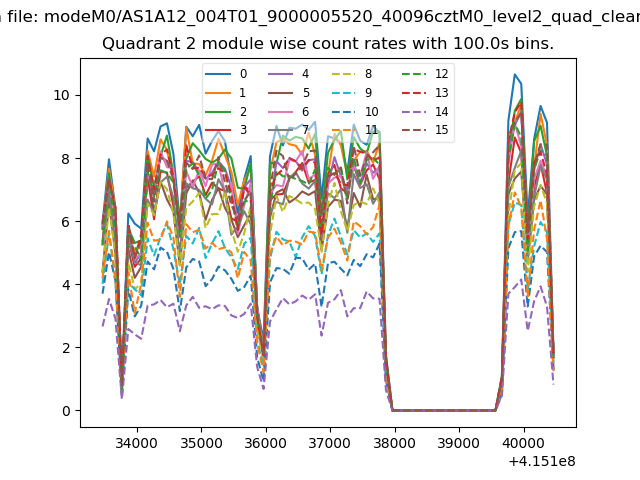
| Module-wise count rates for Quadrant B Data is divided into 100 sec bins |
 |
 |
| Module-wise count rates for Quadrant C Data is divided into 100 sec bins |
 |
 |
| Module-wise count rates for Quadrant D Data is divided into 100 sec bins |
 |
 |
| Parameter | Plot |
|---|---|
| CZT HV Monitor | 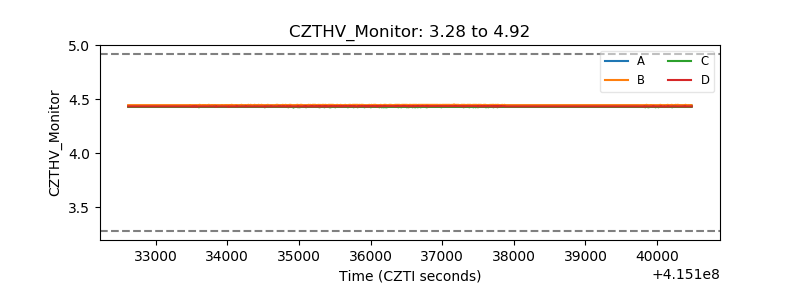 |
| D_VDD | 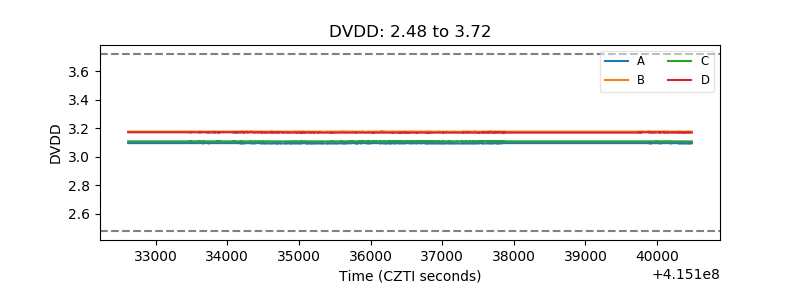 |
| Temperature 1 | 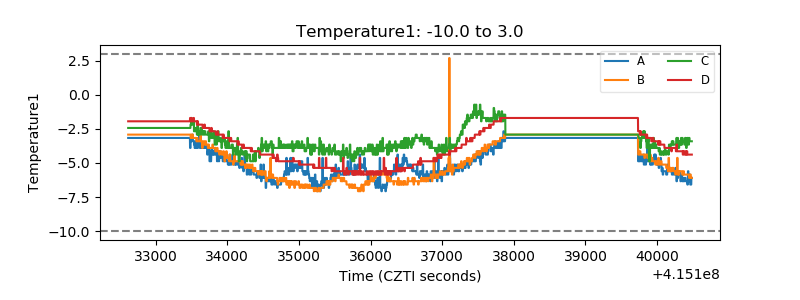 |
| Veto HV Monitor | 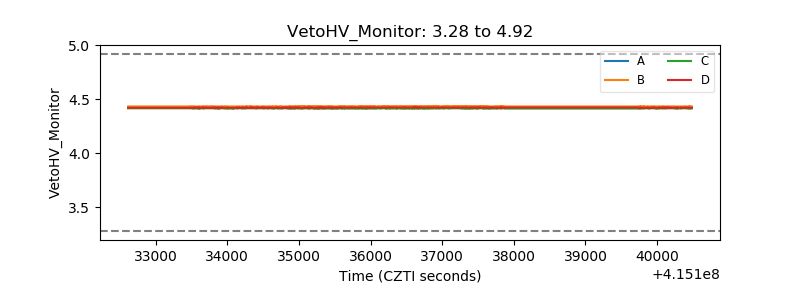 |
| Veto LLD | 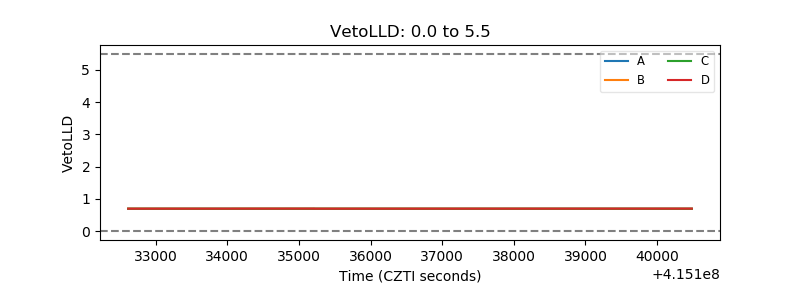 |
| Alpha Counter | 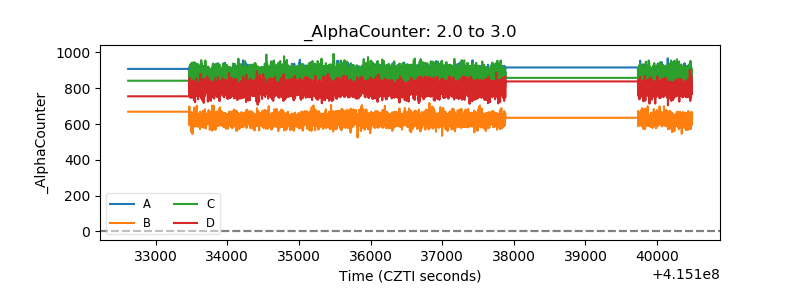 |
| _CPM_Rate | 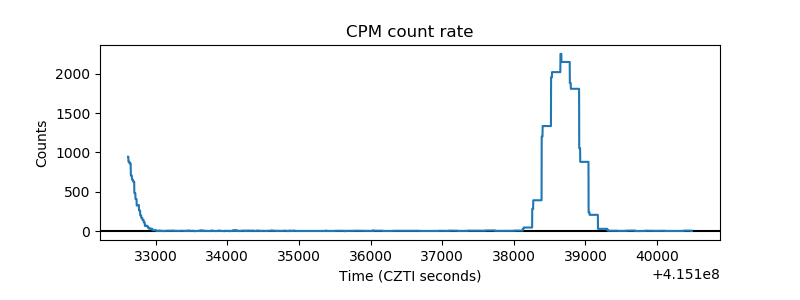 |
| CZT Counter | 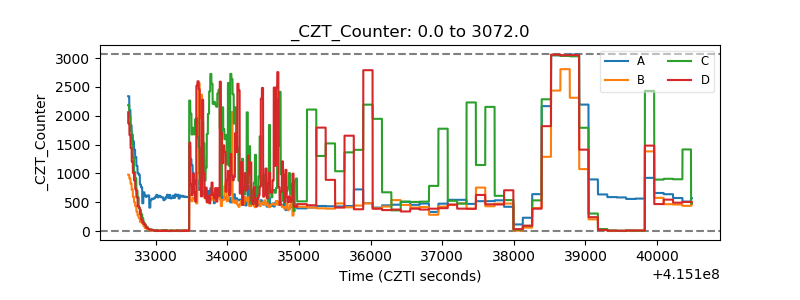 |
| +2.5 Volts monitor | 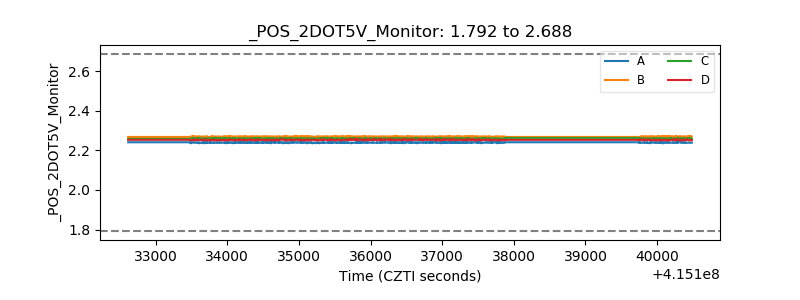 |
| +5 Volts monitor | 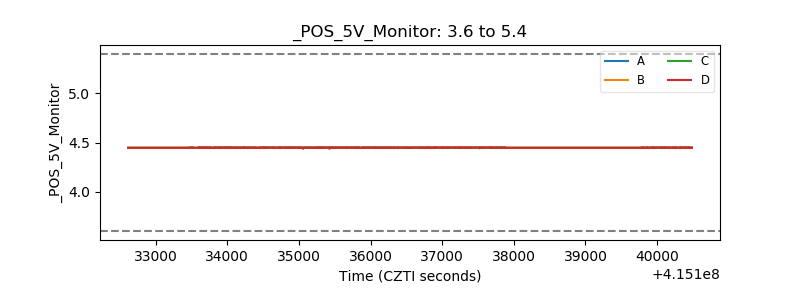 |
| _ROLL_ROT | 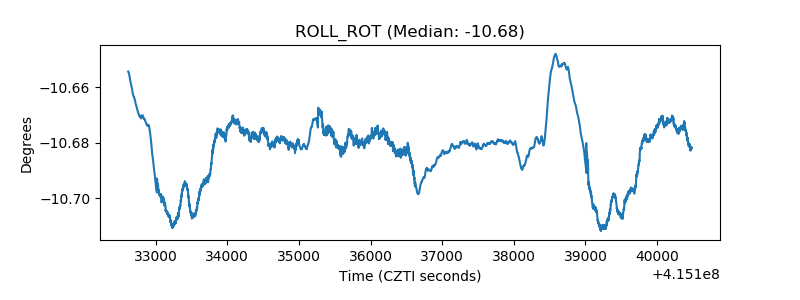 |
| _Roll_DEC | 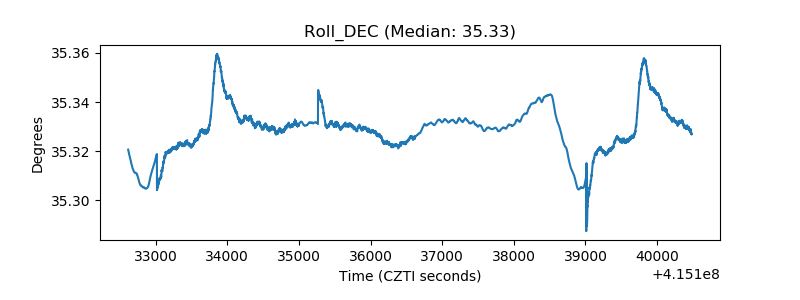 |
| _Roll_RA | 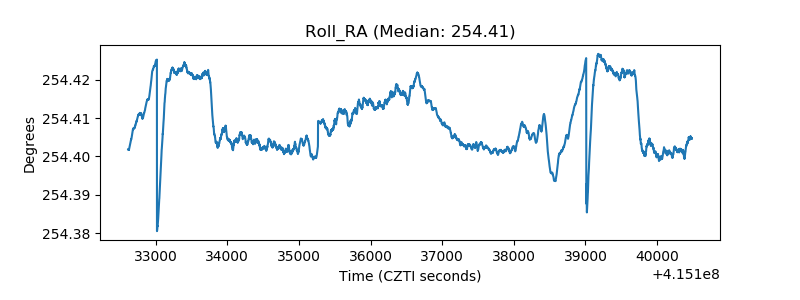 |
| Veto Counter | 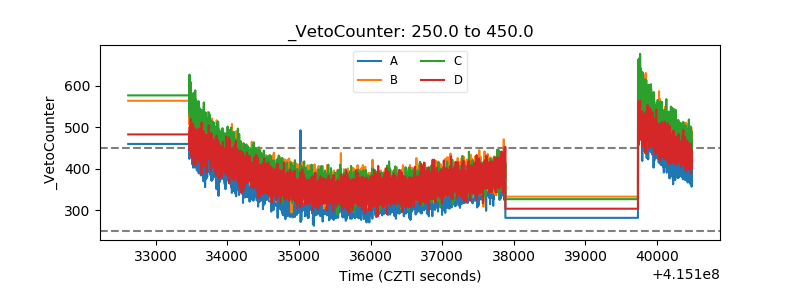 |