| Param | Original file | Final file |
|---|---|---|
| Filename | modeM0/AS1A12_004T01_9000005520_40097cztM0_level2.fits | modeM0/AS1A12_004T01_9000005520_40097cztM0_level2_quad_clean.evt |
| Size (bytes) | 391,910,400 | 90,604,800 |
| Size | 373.8 MB | 86.4 MB |
| Events in quadrant A | 2,747,920 | 622,804 |
| Events in quadrant B | 2,493,910 | 649,832 |
| Events in quadrant C | 5,780,477 | 551,111 |
| Events in quadrant D | 3,088,125 | 562,449 |
| Mode M0 | |||
|---|---|---|---|
| Quadrant | BADHDUFLAG | Total packets | Discarded packets |
| A | 0 | 11345 | 3 |
| B | 0 | 10682 | 2 |
| C | 0 | 20624 | 2 |
| D | 0 | 12629 | 2 |
| Mode M9 | |||
|---|---|---|---|
| Quadrant | BADHDUFLAG | Total packets | Discarded packets |
| A | 0 | 37 | 0 |
| B | 0 | 37 | 0 |
| C | 0 | 37 | 0 |
| D | 0 | 37 | 0 |
| Mode SS | |||
|---|---|---|---|
| Quadrant | BADHDUFLAG | Total packets | Discarded packets |
| A | 0 | 104 | 0 |
| B | 0 | 104 | 0 |
| C | 0 | 104 | 0 |
| D | 0 | 104 | 0 |
| Quadrant | Total seconds | Saturated seconds | Saturation percentage |
|---|---|---|---|
| A | 5102 | 11 | 0.215602% |
| B | 5102 | 19 | 0.372403% |
| C | 5102 | 769 | 15.072521% |
| D | 5102 | 107 | 2.097217% |
Noise dominated data is calculated using 1-second bins in cleaned event files. If a bin has >2000 counts, and if more than 50% of those come from <1% of pixels, then it is considered to be noise-dominated and hence unusable.
| Quadrant | # 1 sec bins | Bins with >0 counts | Bins with >2000 counts | High rate bins dominated by noise | Noise dominated (total time) | Noise dominated (detector-on time) | Marked lightcurve |
|---|---|---|---|---|---|---|---|
| A | 7075 | 5103 | 3 | 3 | 0.04% | 0.06% | 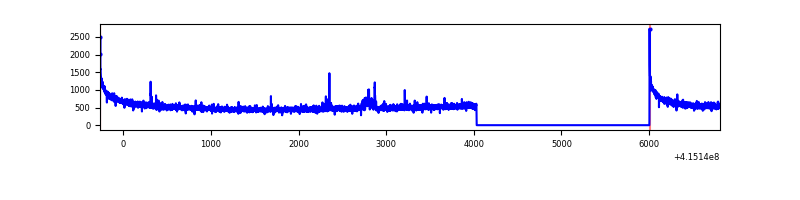 |
| B | 7075 | 5103 | 10 | 10 | 0.14% | 0.20% | 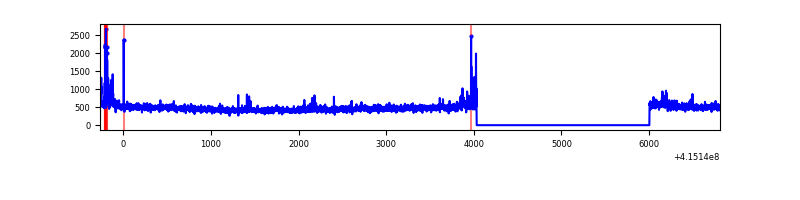 |
| C | 7075 | 5103 | 729 | 729 | 10.30% | 14.29% | 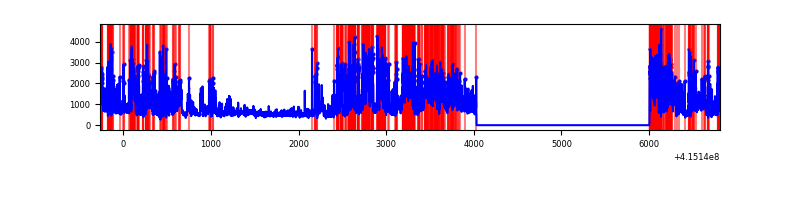 |
| D | 7075 | 5103 | 93 | 93 | 1.31% | 1.82% | 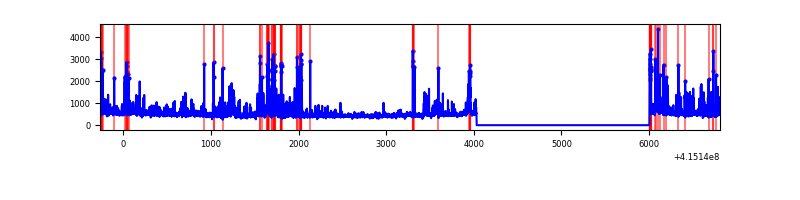 |
Top three noisy pixels from each quadrant. If the there are fewer than three noisy pixels in the level2.evt file, extra rows are filled as -1
| Pixel properties | Quadrant properties | ||||||
|---|---|---|---|---|---|---|---|
| Quadrant | DetID | PixID | Counts | Sigma | Mean | Median | Sigma |
| A | 10 | 83 | 435730 | 3661.2 | 585 | 574 | 118.9 |
| A | 9 | 143 | 36194 | 299.69 | 585 | 574 | 118.9 |
| A | 2 | 79 | 9943 | 78.83 | 585 | 574 | 118.9 |
| B | 4 | 171 | 86162 | 758.88 | 588 | 572 | 112.8 |
| B | 0 | 189 | 77369 | 680.92 | 588 | 572 | 112.8 |
| B | 0 | 230 | 22700 | 196.2 | 588 | 572 | 112.8 |
| C | 9 | 187 | 2941281 | 22919.23 | 551 | 556 | 128.3 |
| C | 14 | 254 | 367900 | 2862.98 | 551 | 556 | 128.3 |
| C | 15 | 214 | 203317 | 1580.27 | 551 | 556 | 128.3 |
| D | 12 | 227 | 333234 | 2376.57 | 570 | 554 | 140.0 |
| D | 13 | 171 | 148909 | 1059.81 | 570 | 554 | 140.0 |
| D | 1 | 47 | 120284 | 855.32 | 570 | 554 | 140.0 |
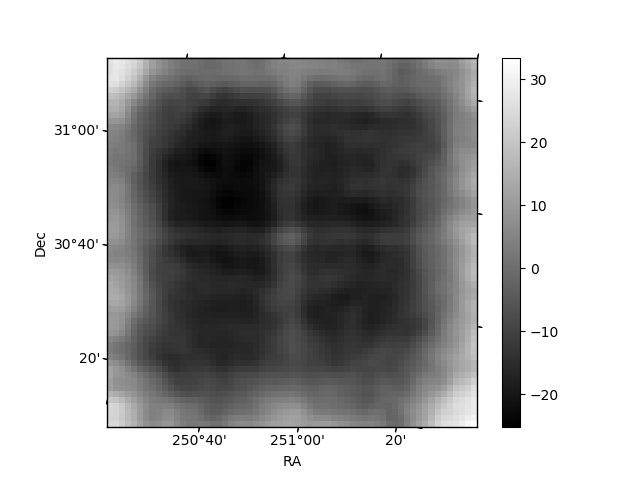
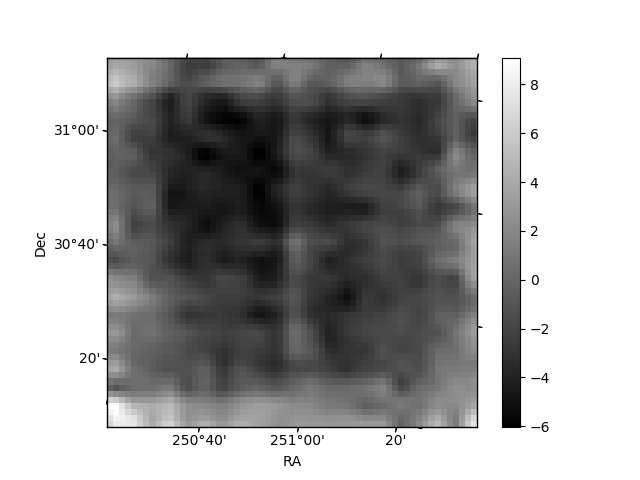
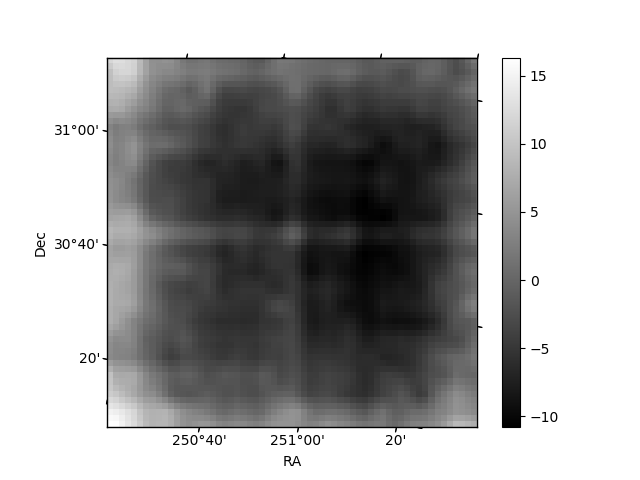
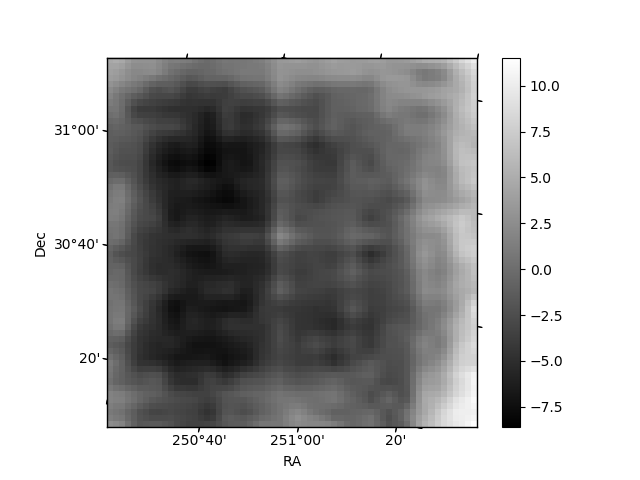
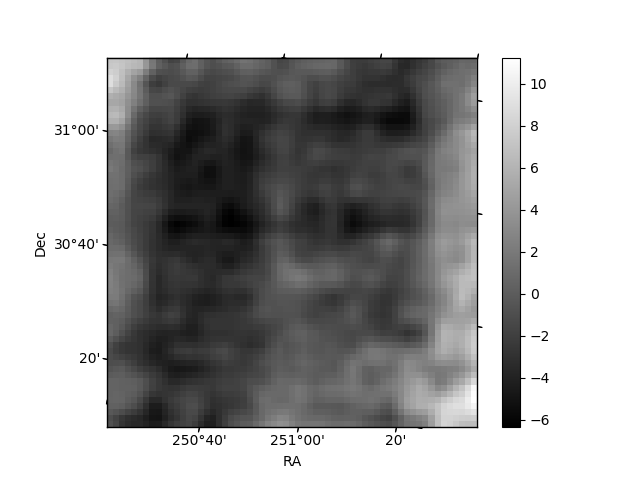
Histogram calculated using DETX and DETY for each event in the final _common_clean file
| Quadrant A | 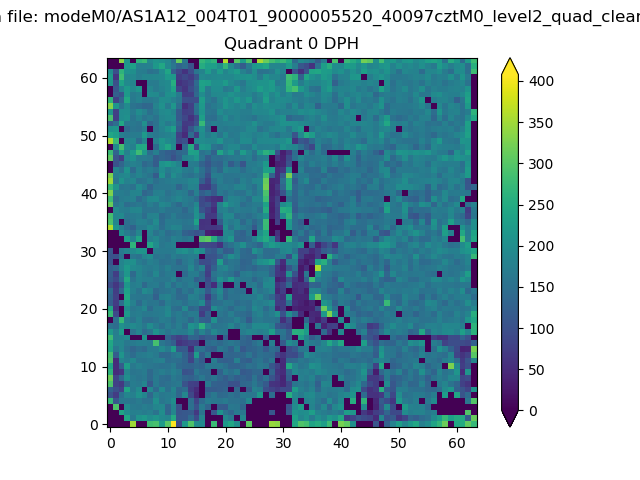 |
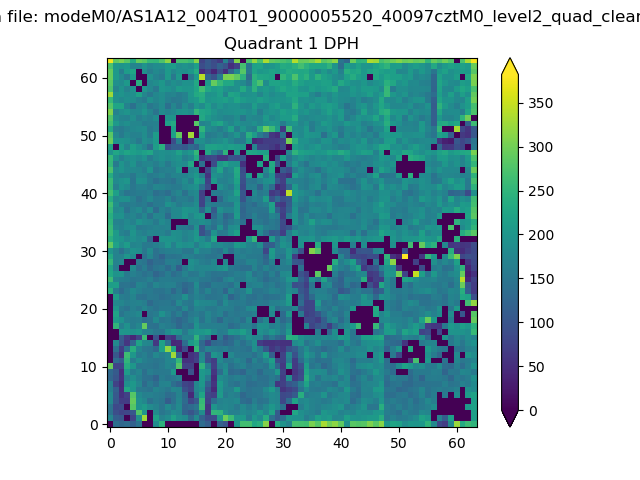 |
Quadrant B |
|---|---|---|---|
| Quadrant D | 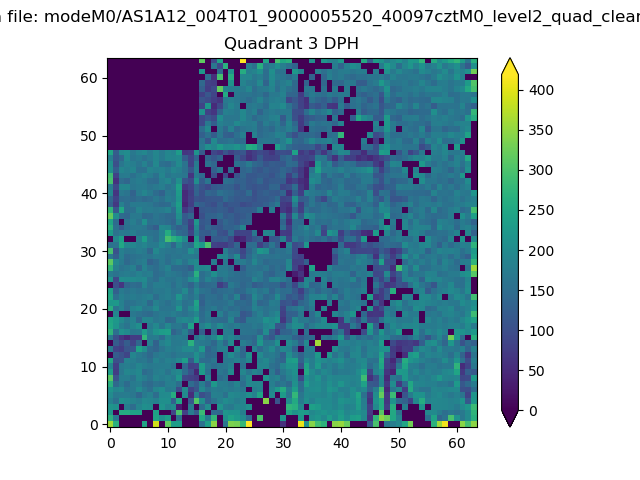 |
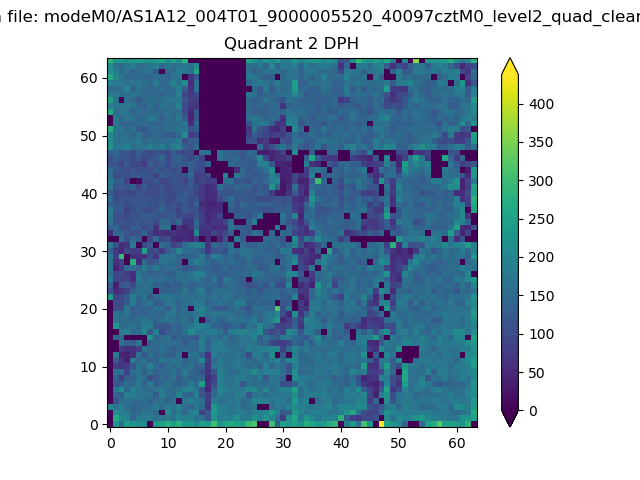 |
Quadrant C |
| Plot type | Count rate plots | Images |
|---|---|---|
| Comparison with Poisson distribution Blue bars denote a histogram of data divided into 1 sec bins. Red curve is a Poisson curve with rate = median count rate of data. |
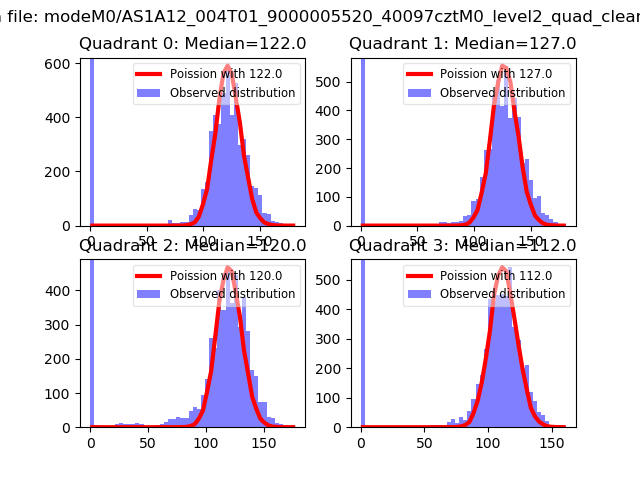 |
 |
| Quadrant-wise count rates Data is divided into 100 sec bins |
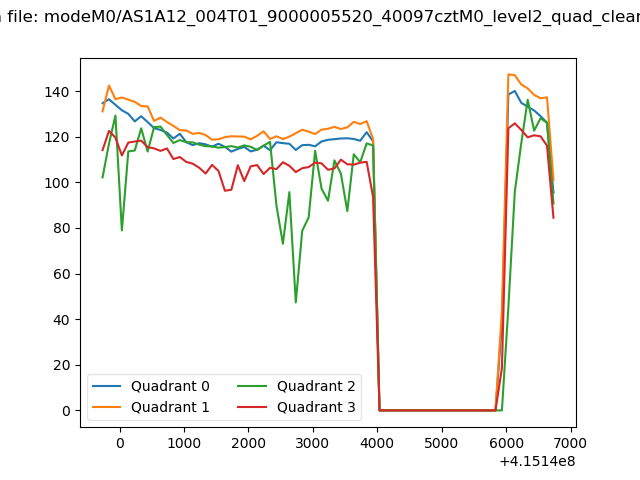 |
|
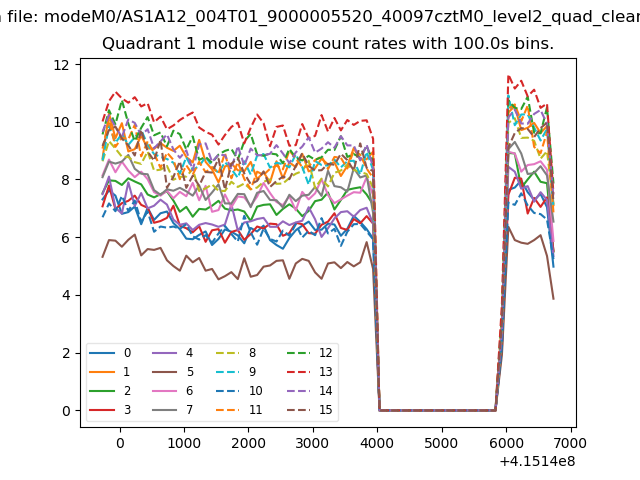
| Module-wise count rates for Quadrant A Data is divided into 100 sec bins |
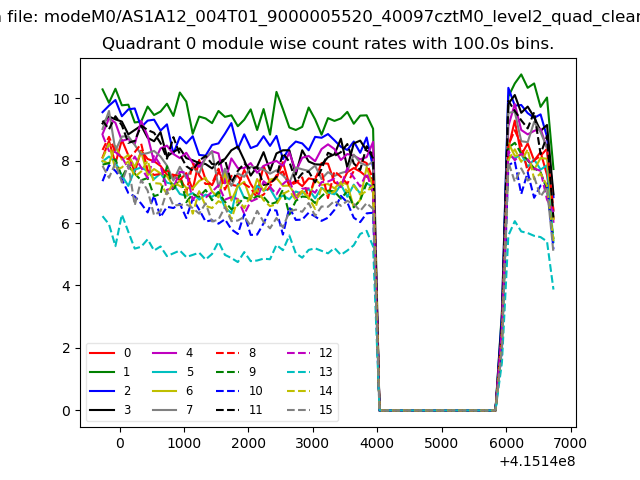 |
 |
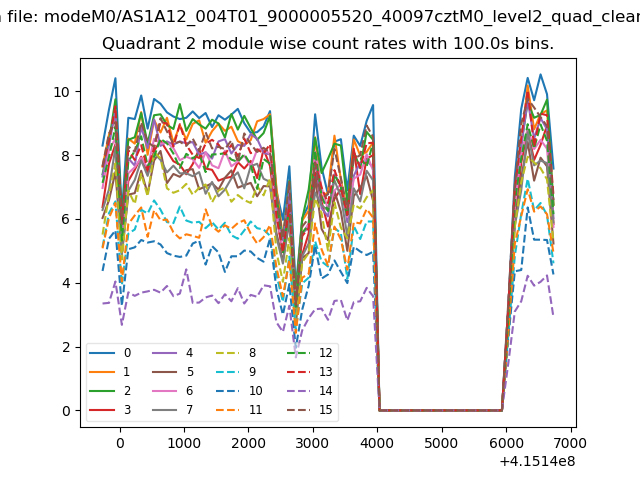
| Module-wise count rates for Quadrant B Data is divided into 100 sec bins |
 |
 |
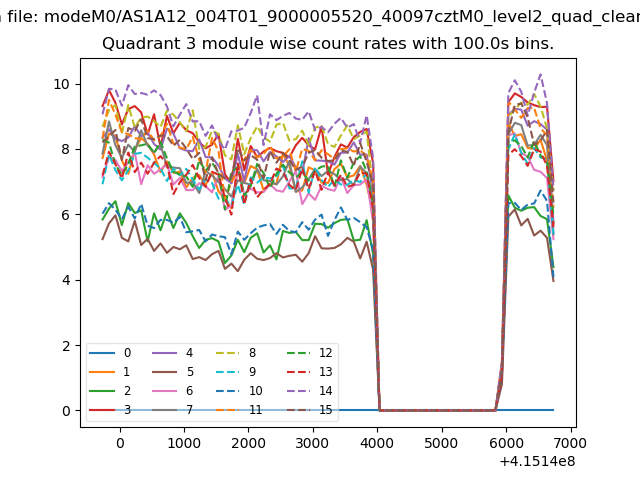
| Module-wise count rates for Quadrant C Data is divided into 100 sec bins |
 |
 |
| Module-wise count rates for Quadrant D Data is divided into 100 sec bins |
 |
 |
| Parameter | Plot |
|---|---|
| CZT HV Monitor | 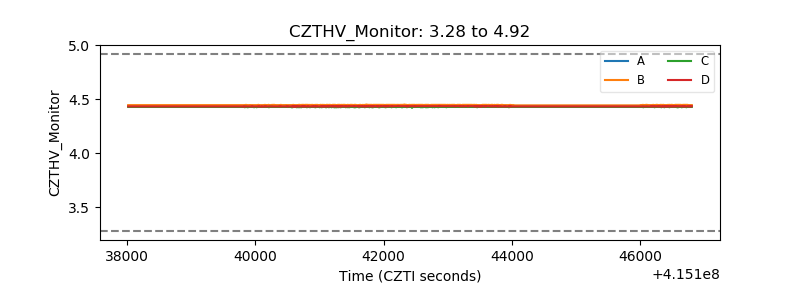 |
| D_VDD | 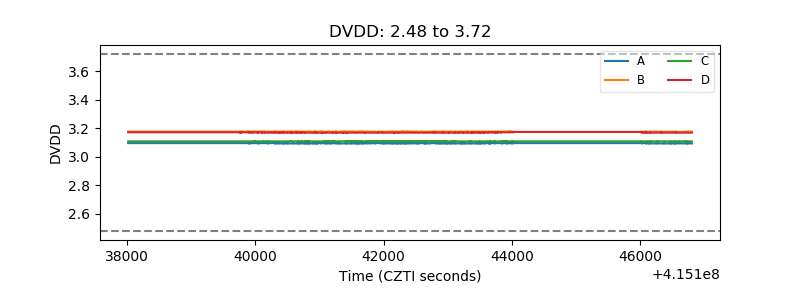 |
| Temperature 1 | 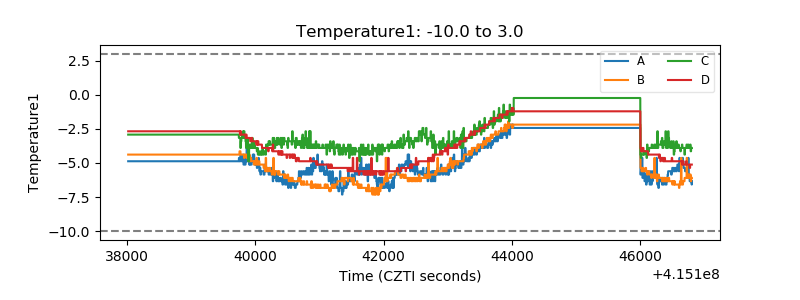 |
| Veto HV Monitor | 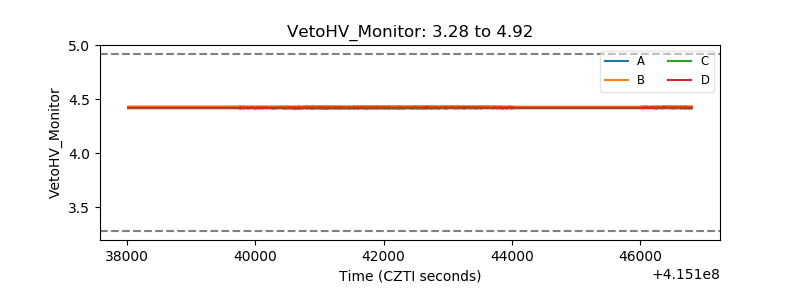 |
| Veto LLD | 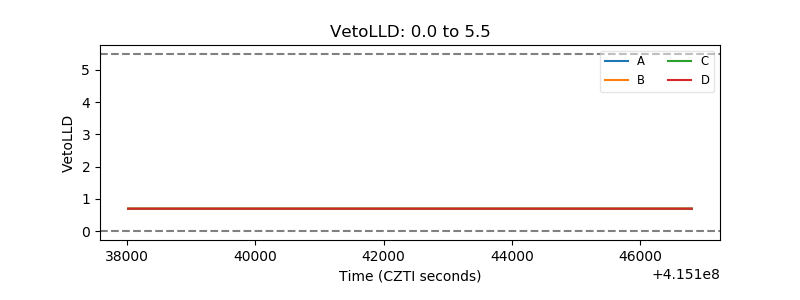 |
| Alpha Counter |  |
| _CPM_Rate | 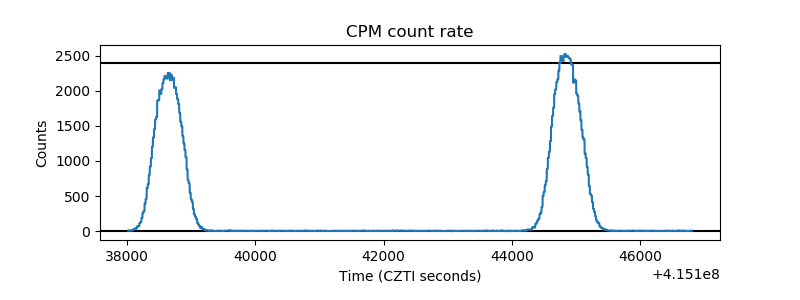 |
| CZT Counter | 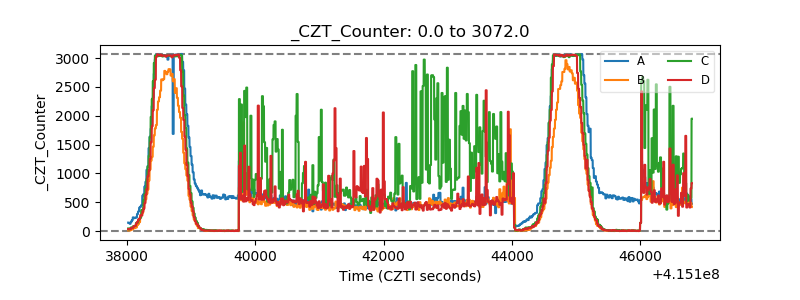 |
| +2.5 Volts monitor | 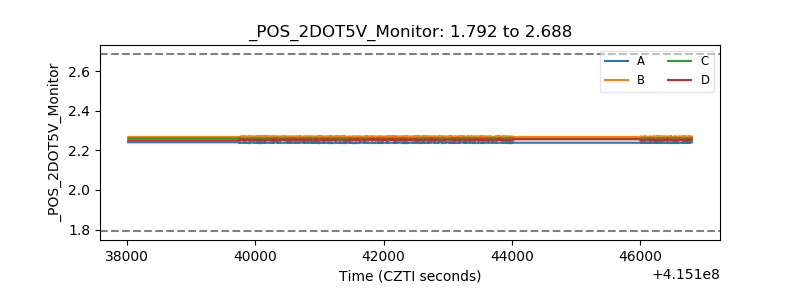 |
| +5 Volts monitor | 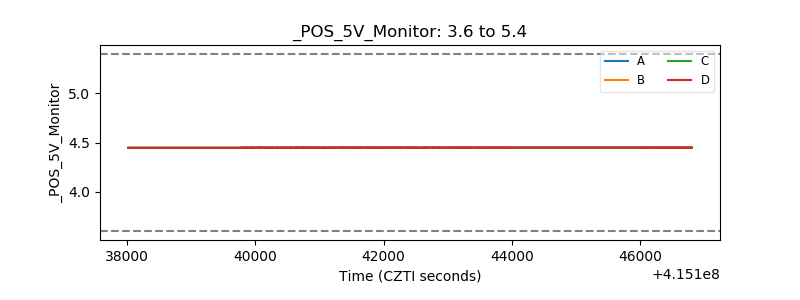 |
| _ROLL_ROT | 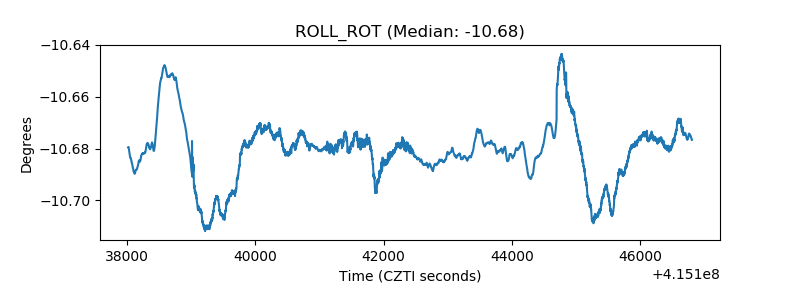 |
| _Roll_DEC | 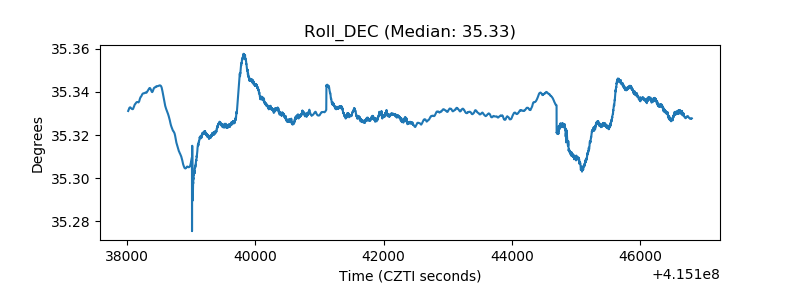 |
| _Roll_RA | 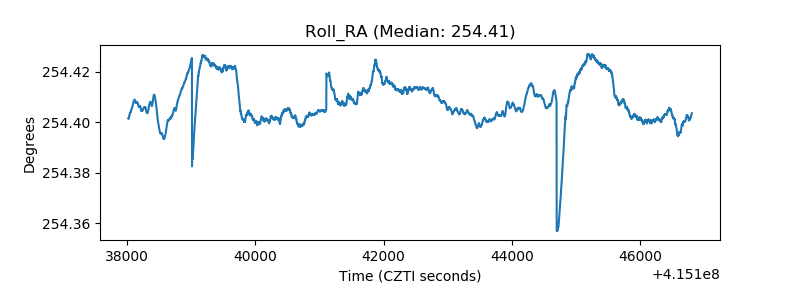 |
| Veto Counter | 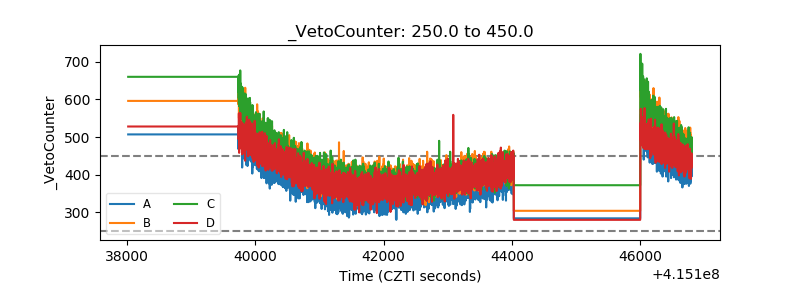 |