| Param | Original file | Final file |
|---|---|---|
| Filename | modeM0/AS1A12_004T01_9000005520_40098cztM0_level2.fits | modeM0/AS1A12_004T01_9000005520_40098cztM0_level2_quad_clean.evt |
| Size (bytes) | 371,701,440 | 91,137,600 |
| Size | 354.5 MB | 86.9 MB |
| Events in quadrant A | 2,699,968 | 627,517 |
| Events in quadrant B | 2,461,192 | 658,360 |
| Events in quadrant C | 5,119,138 | 566,860 |
| Events in quadrant D | 3,083,079 | 550,534 |
| Mode M0 | |||
|---|---|---|---|
| Quadrant | BADHDUFLAG | Total packets | Discarded packets |
| A | 0 | 11156 | 3 |
| B | 0 | 10568 | 2 |
| C | 0 | 18627 | 2 |
| D | 0 | 12786 | 2 |
| Mode M9 | |||
|---|---|---|---|
| Quadrant | BADHDUFLAG | Total packets | Discarded packets |
| A | 0 | 40 | 0 |
| B | 0 | 40 | 0 |
| C | 0 | 40 | 0 |
| D | 0 | 40 | 0 |
| Mode SS | |||
|---|---|---|---|
| Quadrant | BADHDUFLAG | Total packets | Discarded packets |
| A | 0 | 106 | 0 |
| B | 0 | 106 | 0 |
| C | 0 | 106 | 0 |
| D | 0 | 106 | 0 |
| Quadrant | Total seconds | Saturated seconds | Saturation percentage |
|---|---|---|---|
| A | 5085 | 8 | 0.157325% |
| B | 5085 | 6 | 0.117994% |
| C | 5085 | 605 | 11.897738% |
| D | 5085 | 203 | 3.992134% |
Noise dominated data is calculated using 1-second bins in cleaned event files. If a bin has >2000 counts, and if more than 50% of those come from <1% of pixels, then it is considered to be noise-dominated and hence unusable.
| Quadrant | # 1 sec bins | Bins with >0 counts | Bins with >2000 counts | High rate bins dominated by noise | Noise dominated (total time) | Noise dominated (detector-on time) | Marked lightcurve |
|---|---|---|---|---|---|---|---|
| A | 9151 | 5087 | 4 | 4 | 0.04% | 0.08% | 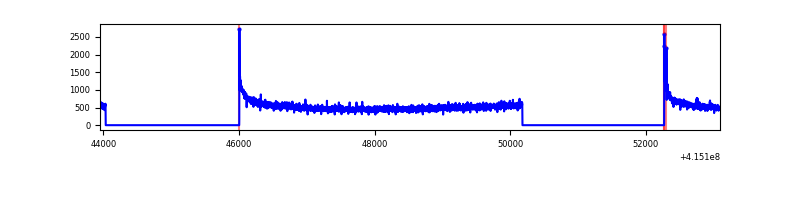 |
| B | 9151 | 5087 | 1 | 1 | 0.01% | 0.02% | 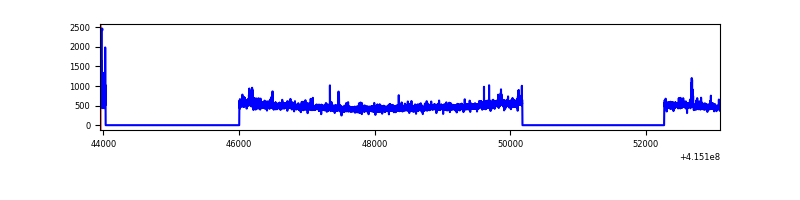 |
| C | 9151 | 5087 | 557 | 557 | 6.09% | 10.95% | 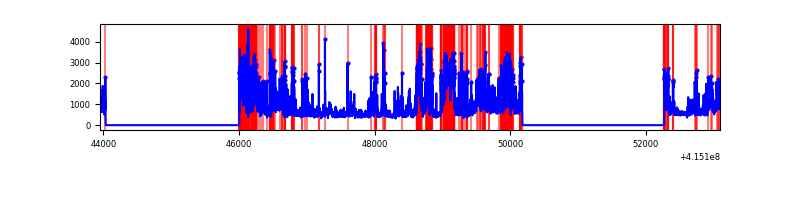 |
| D | 9151 | 5087 | 182 | 182 | 1.99% | 3.58% | 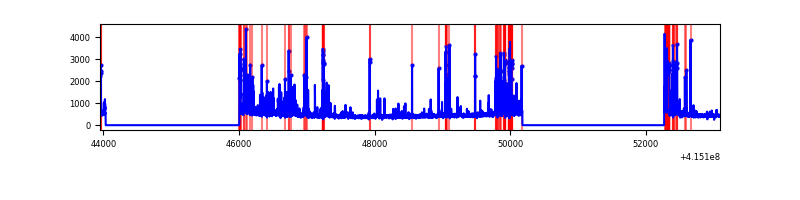 |
Top three noisy pixels from each quadrant. If the there are fewer than three noisy pixels in the level2.evt file, extra rows are filled as -1
| Pixel properties | Quadrant properties | ||||||
|---|---|---|---|---|---|---|---|
| Quadrant | DetID | PixID | Counts | Sigma | Mean | Median | Sigma |
| A | 10 | 83 | 433531 | 3657.82 | 583 | 573 | 118.4 |
| A | 13 | 248 | 6420 | 49.4 | 583 | 573 | 118.4 |
| A | 13 | 254 | 6200 | 47.54 | 583 | 573 | 118.4 |
| B | 0 | 189 | 107460 | 957.82 | 590 | 575 | 111.6 |
| B | 4 | 171 | 24614 | 215.42 | 590 | 575 | 111.6 |
| B | 12 | 111 | 13736 | 117.94 | 590 | 575 | 111.6 |
| C | 9 | 187 | 2666870 | 20784.81 | 552 | 557 | 128.3 |
| C | 15 | 214 | 203470 | 1581.78 | 552 | 557 | 128.3 |
| C | 0 | 10 | 46179 | 355.64 | 552 | 557 | 128.3 |
| D | 12 | 227 | 434313 | 3218.05 | 554 | 541 | 134.8 |
| D | 12 | 218 | 176709 | 1306.95 | 554 | 541 | 134.8 |
| D | 13 | 249 | 108900 | 803.89 | 554 | 541 | 134.8 |
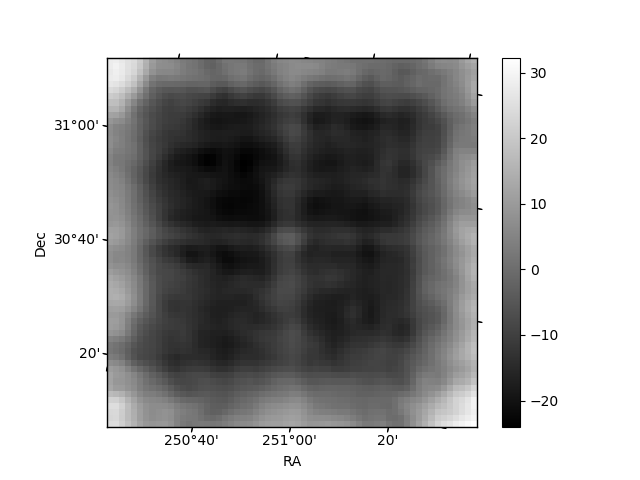
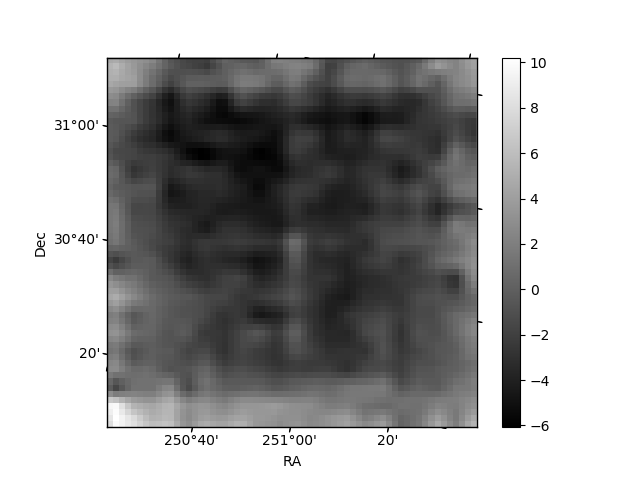
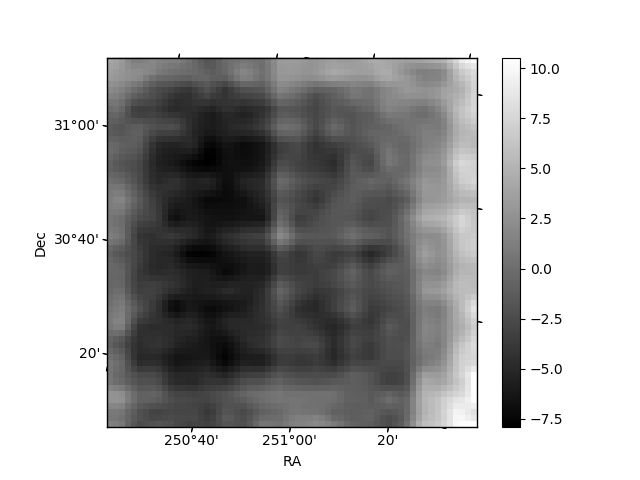
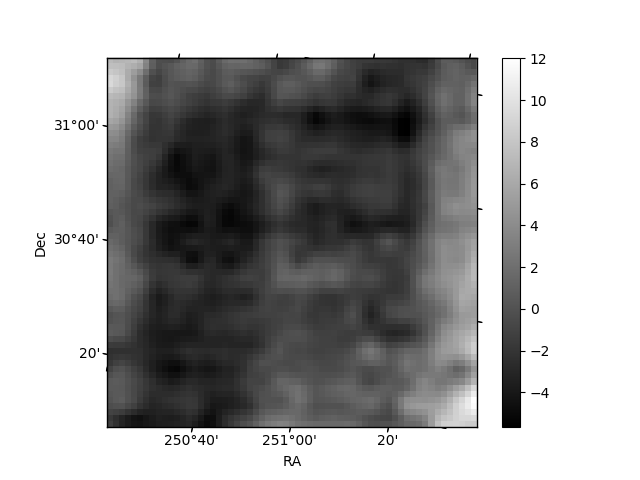
Histogram calculated using DETX and DETY for each event in the final _common_clean file
| Quadrant A | 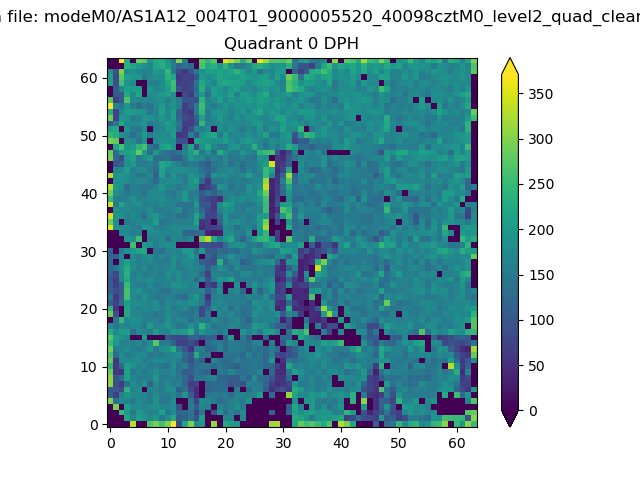 |
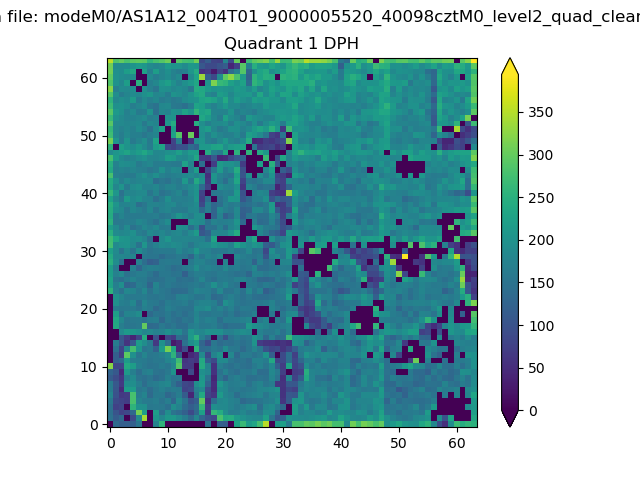 |
Quadrant B |
|---|---|---|---|
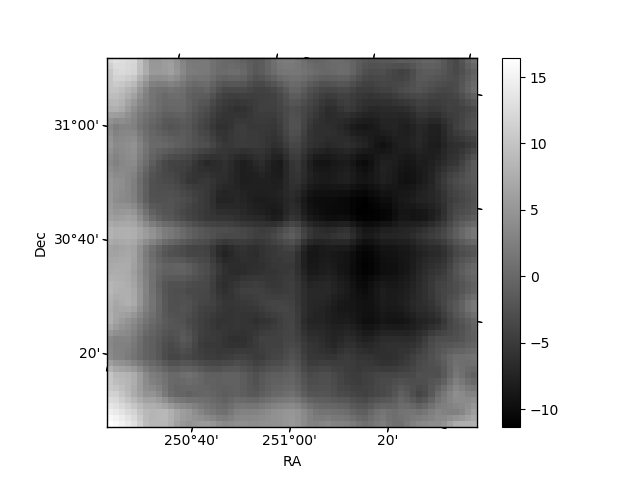
| Quadrant D | 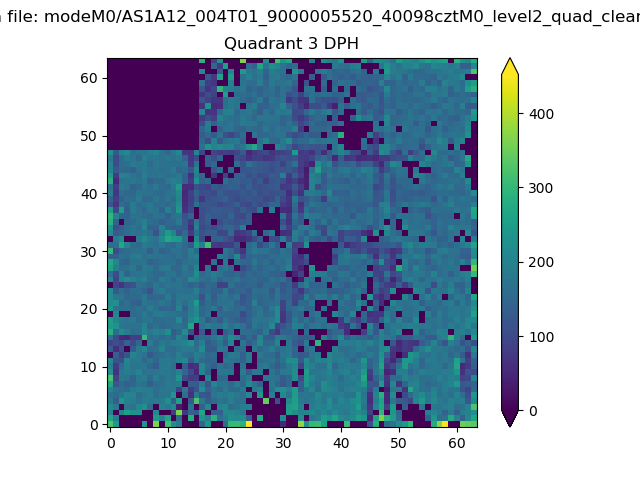 |
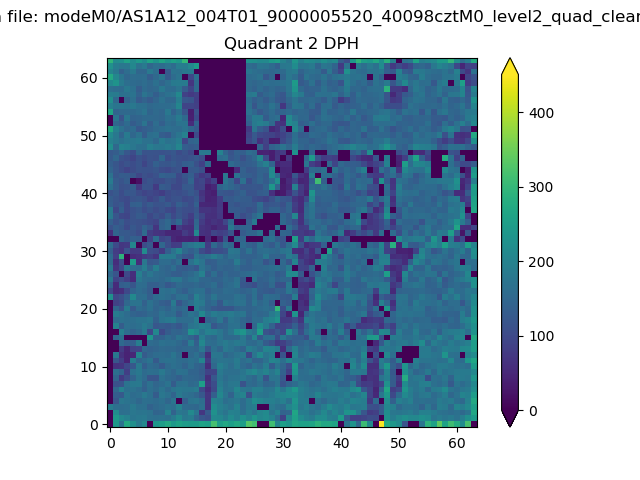 |
Quadrant C |
| Plot type | Count rate plots | Images |
|---|---|---|
| Comparison with Poisson distribution Blue bars denote a histogram of data divided into 1 sec bins. Red curve is a Poisson curve with rate = median count rate of data. |
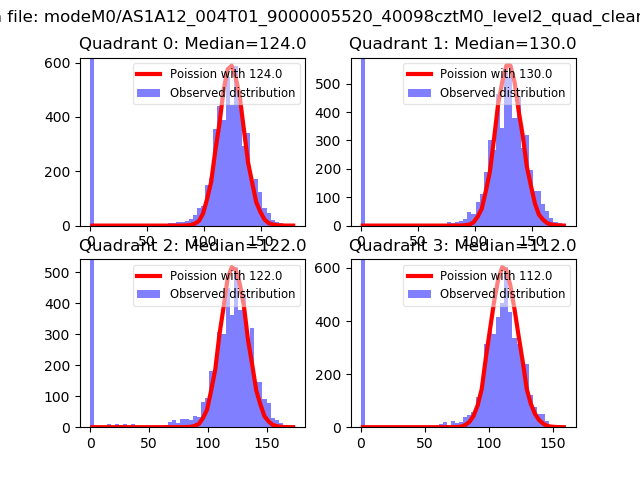 |
 |
| Quadrant-wise count rates Data is divided into 100 sec bins |
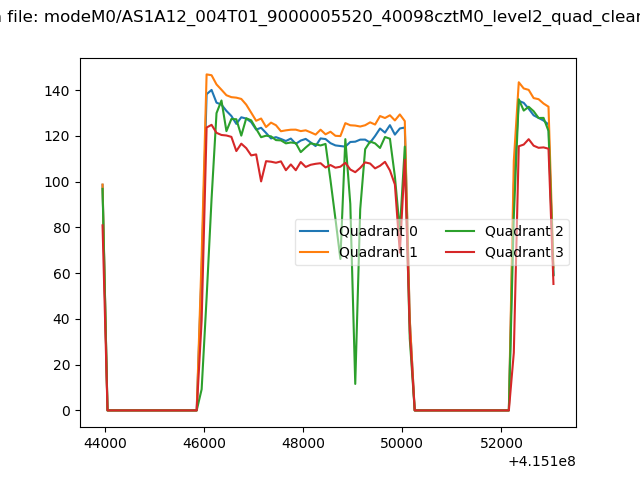 |
|
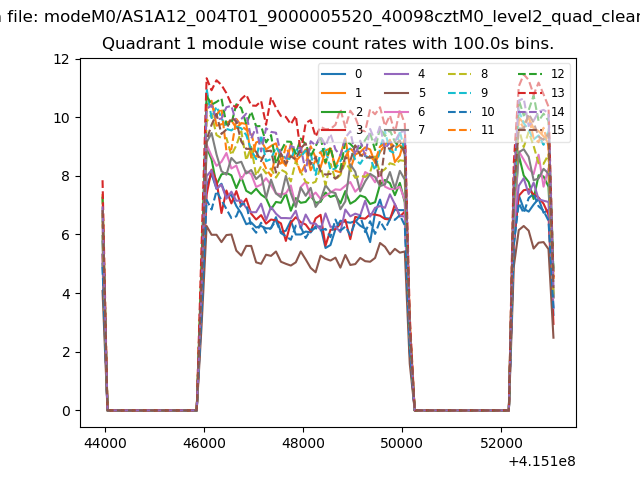
| Module-wise count rates for Quadrant A Data is divided into 100 sec bins |
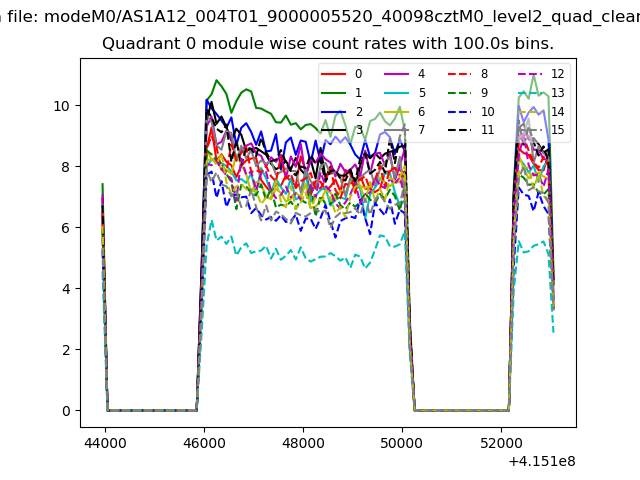 |
 |
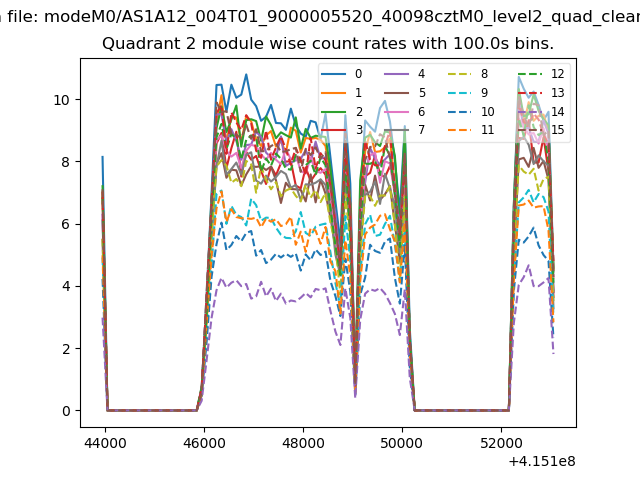
| Module-wise count rates for Quadrant B Data is divided into 100 sec bins |
 |
 |
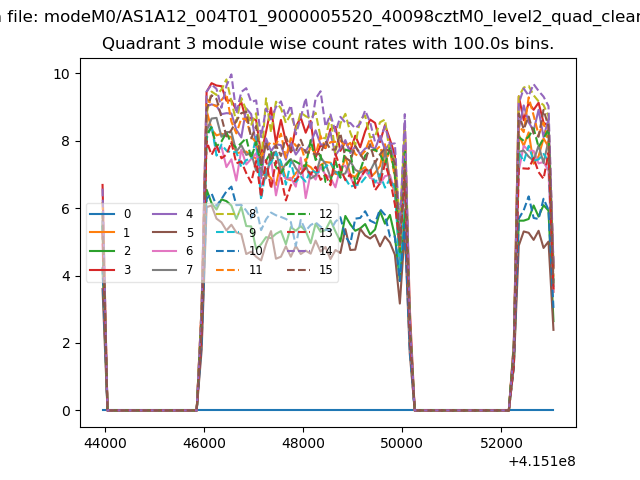
| Module-wise count rates for Quadrant C Data is divided into 100 sec bins |
 |
 |
| Module-wise count rates for Quadrant D Data is divided into 100 sec bins |
 |
 |
| Parameter | Plot |
|---|---|
| CZT HV Monitor | 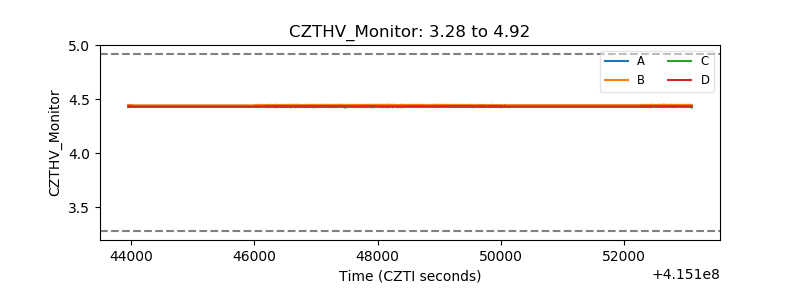 |
| D_VDD | 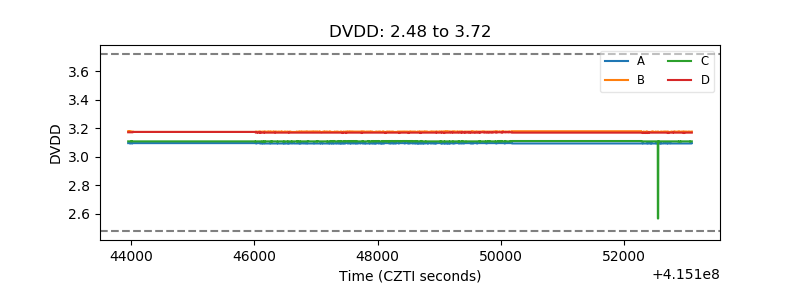 |
| Temperature 1 | 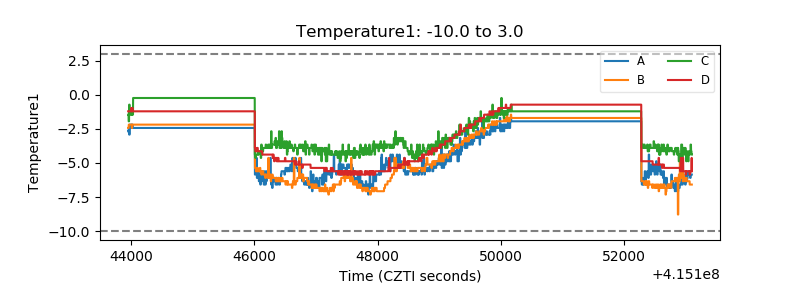 |
| Veto HV Monitor | 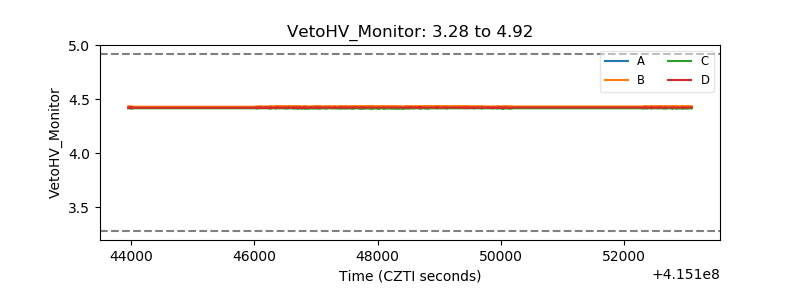 |
| Veto LLD | 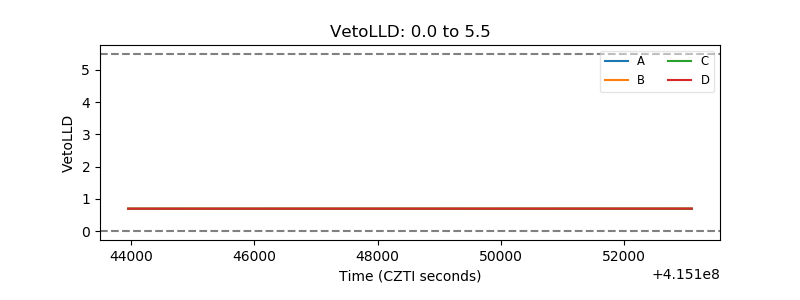 |
| Alpha Counter | 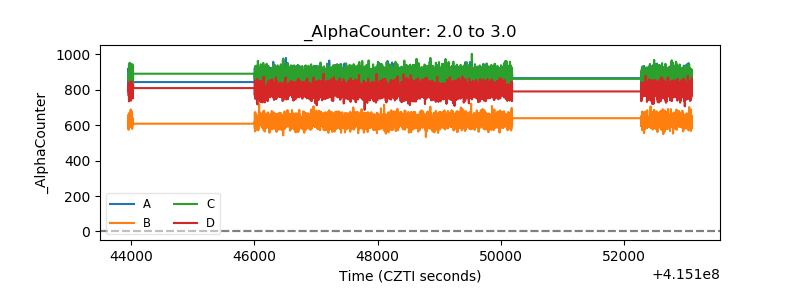 |
| _CPM_Rate | 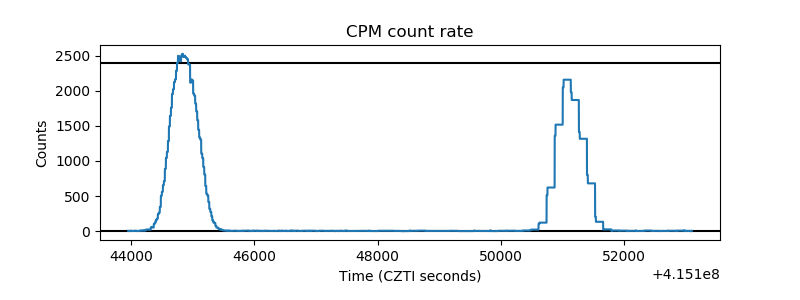 |
| CZT Counter | 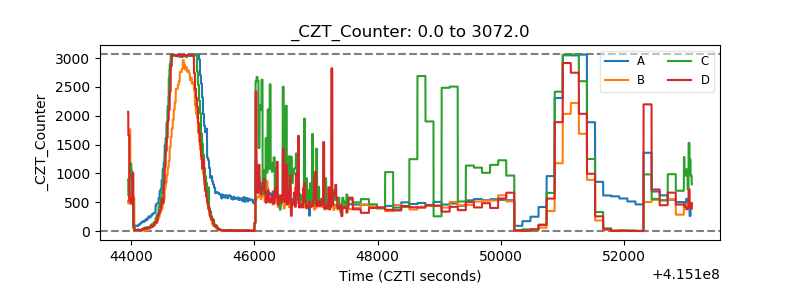 |
| +2.5 Volts monitor | 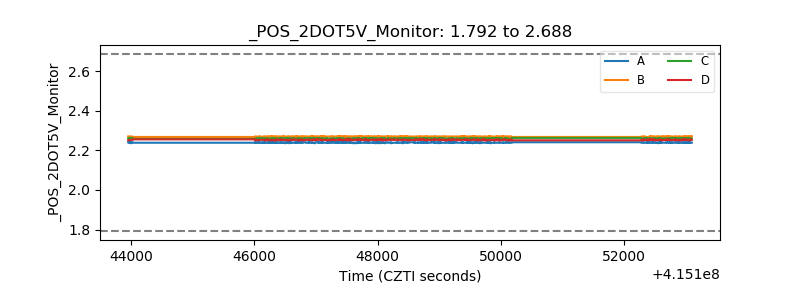 |
| +5 Volts monitor | 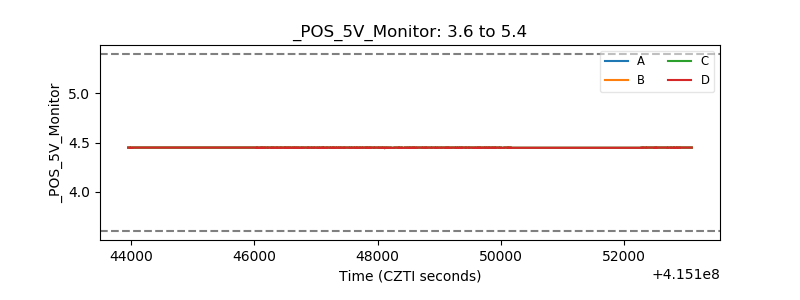 |
| _ROLL_ROT | 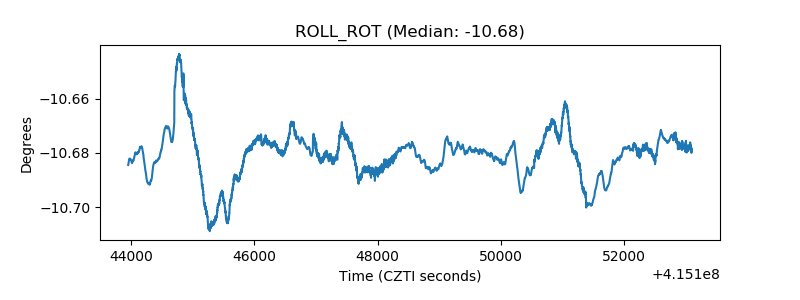 |
| _Roll_DEC | 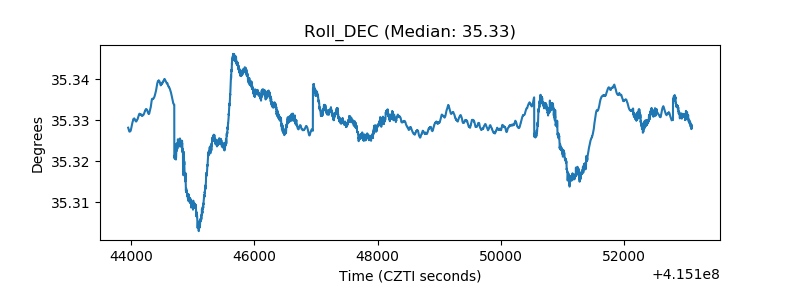 |
| _Roll_RA | 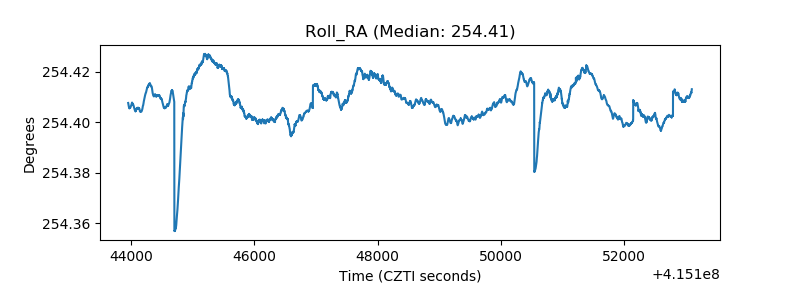 |
| Veto Counter | 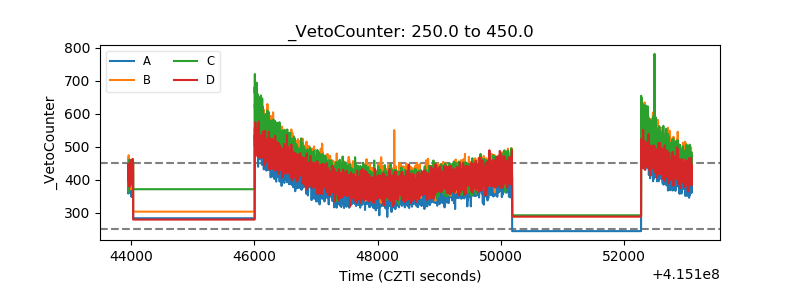 |