| Param | Original file | Final file |
|---|---|---|
| Filename | modeM0/AS1A12_004T01_9000005520_40099cztM0_level2.fits | modeM0/AS1A12_004T01_9000005520_40099cztM0_level2_quad_clean.evt |
| Size (bytes) | 335,767,680 | 85,723,200 |
| Size | 320.2 MB | 81.8 MB |
| Events in quadrant A | 2,562,749 | 578,153 |
| Events in quadrant B | 2,341,886 | 611,418 |
| Events in quadrant C | 3,579,823 | 569,800 |
| Events in quadrant D | 3,570,045 | 499,011 |
| Mode M0 | |||
|---|---|---|---|
| Quadrant | BADHDUFLAG | Total packets | Discarded packets |
| A | 0 | 10604 | 3 |
| B | 0 | 10109 | 2 |
| C | 0 | 13770 | 2 |
| D | 0 | 14002 | 2 |
| Mode M9 | |||
|---|---|---|---|
| Quadrant | BADHDUFLAG | Total packets | Discarded packets |
| A | 0 | 43 | 0 |
| B | 0 | 43 | 0 |
| C | 0 | 43 | 0 |
| D | 0 | 43 | 0 |
| Mode SS | |||
|---|---|---|---|
| Quadrant | BADHDUFLAG | Total packets | Discarded packets |
| A | 0 | 100 | 0 |
| B | 0 | 100 | 0 |
| C | 0 | 100 | 0 |
| D | 0 | 100 | 0 |
| Quadrant | Total seconds | Saturated seconds | Saturation percentage |
|---|---|---|---|
| A | 4811 | 15 | 0.311785% |
| B | 4811 | 5 | 0.103928% |
| C | 4811 | 121 | 2.515070% |
| D | 4811 | 298 | 6.194138% |
Noise dominated data is calculated using 1-second bins in cleaned event files. If a bin has >2000 counts, and if more than 50% of those come from <1% of pixels, then it is considered to be noise-dominated and hence unusable.
| Quadrant | # 1 sec bins | Bins with >0 counts | Bins with >2000 counts | High rate bins dominated by noise | Noise dominated (total time) | Noise dominated (detector-on time) | Marked lightcurve |
|---|---|---|---|---|---|---|---|
| A | 9058 | 4813 | 8 | 8 | 0.09% | 0.17% | 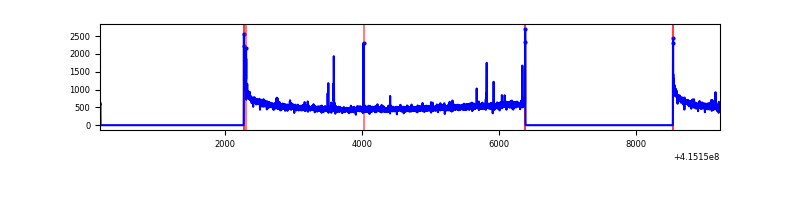 |
| B | 9058 | 4813 | 0 | 0 | 0.00% | 0.00% | 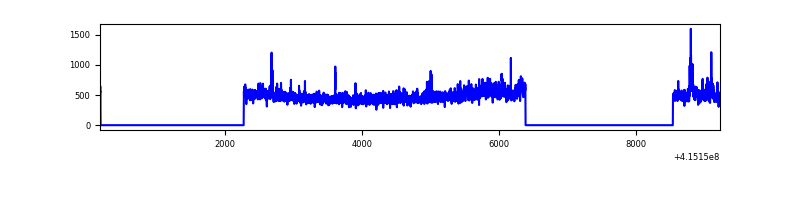 |
| C | 9058 | 4813 | 144 | 144 | 1.59% | 2.99% | 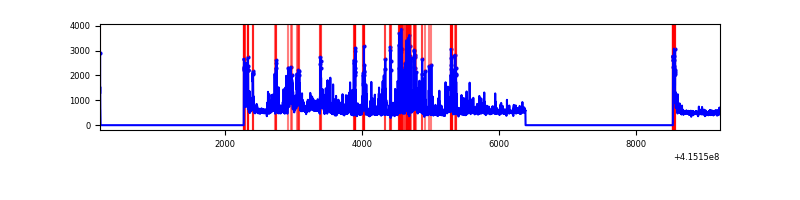 |
| D | 9058 | 4813 | 295 | 295 | 3.26% | 6.13% |  |
Top three noisy pixels from each quadrant. If the there are fewer than three noisy pixels in the level2.evt file, extra rows are filled as -1
| Pixel properties | Quadrant properties | ||||||
|---|---|---|---|---|---|---|---|
| Quadrant | DetID | PixID | Counts | Sigma | Mean | Median | Sigma |
| A | 10 | 83 | 414489 | 3746.96 | 541 | 532 | 110.5 |
| A | 13 | 248 | 16052 | 140.48 | 541 | 532 | 110.5 |
| A | 9 | 143 | 15751 | 137.76 | 541 | 532 | 110.5 |
| B | 0 | 189 | 147952 | 1420.44 | 546 | 533 | 103.8 |
| B | 10 | 246 | 31488 | 298.26 | 546 | 533 | 103.8 |
| B | 4 | 171 | 13578 | 125.69 | 546 | 533 | 103.8 |
| C | 9 | 187 | 1175232 | 9535.6 | 529 | 533 | 123.2 |
| C | 15 | 214 | 201610 | 1632.24 | 529 | 533 | 123.2 |
| C | 0 | 10 | 100237 | 809.35 | 529 | 533 | 123.2 |
| D | 12 | 227 | 1209325 | 9731.57 | 508 | 494 | 124.2 |
| D | 12 | 218 | 168778 | 1354.75 | 508 | 494 | 124.2 |
| D | 9 | 19 | 78348 | 626.76 | 508 | 494 | 124.2 |
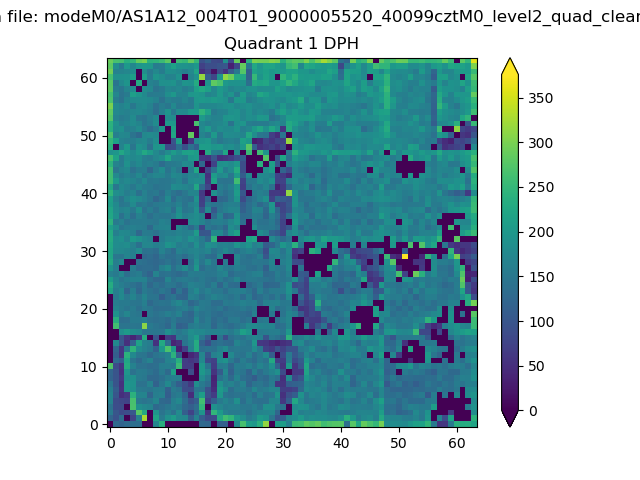
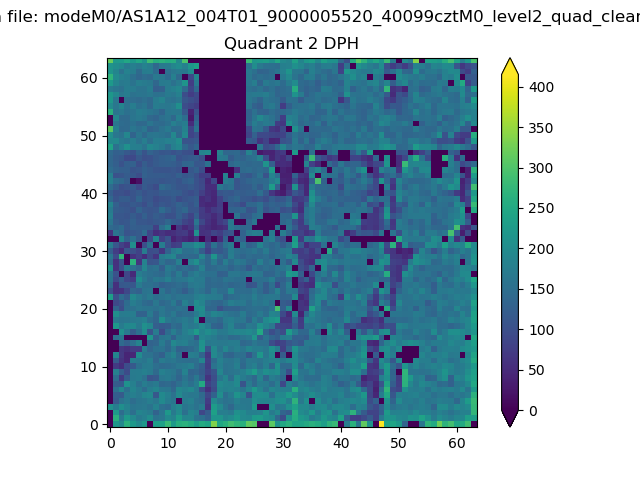
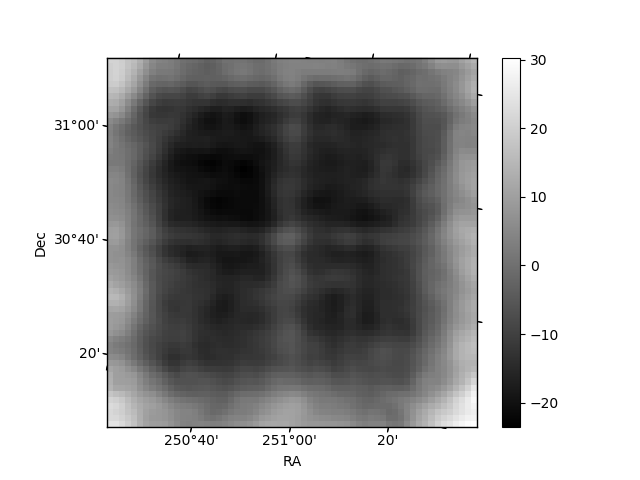
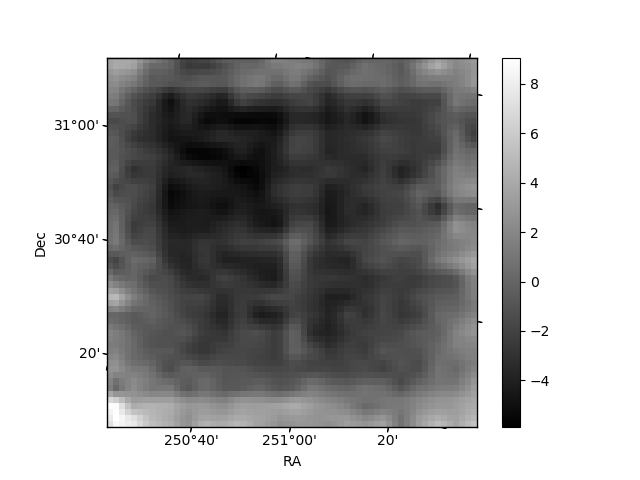
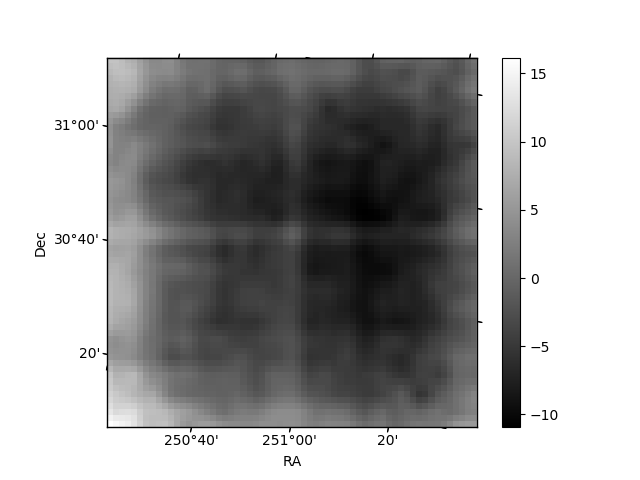
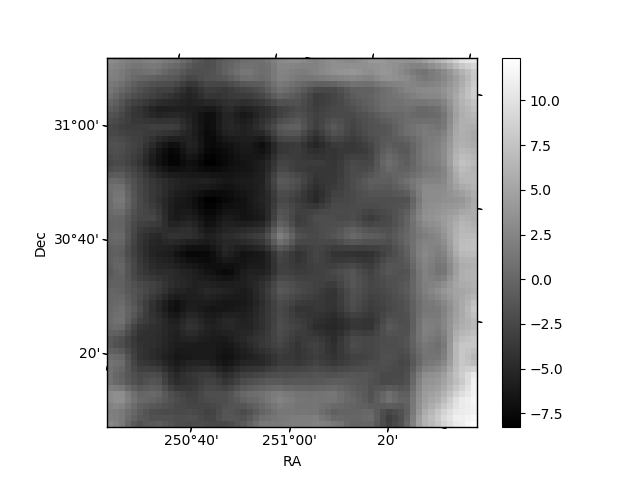
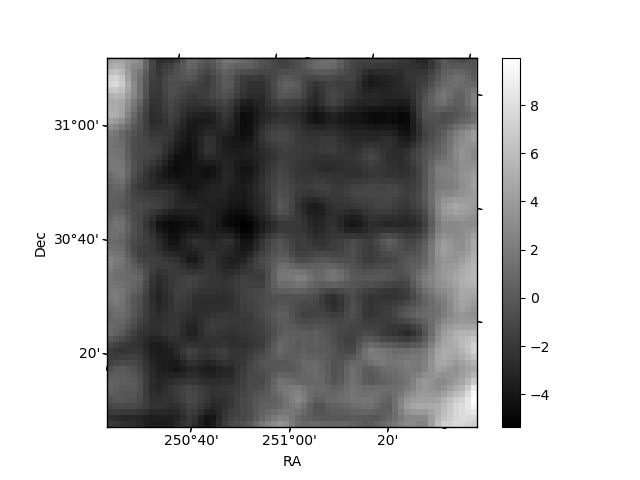
Histogram calculated using DETX and DETY for each event in the final _common_clean file
| Quadrant A | 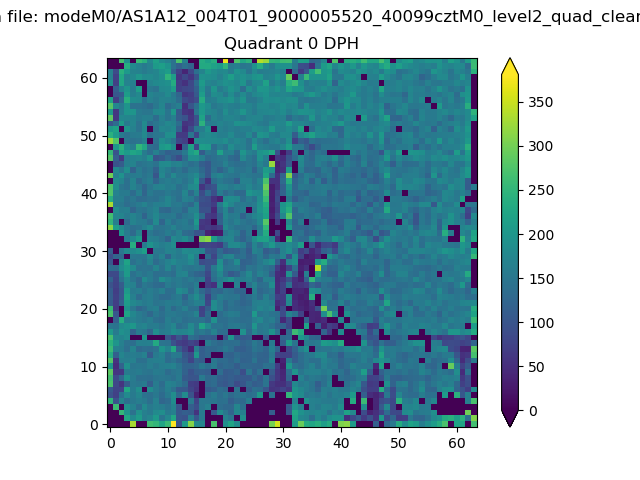 |
 |
Quadrant B |
|---|---|---|---|
| Quadrant D | 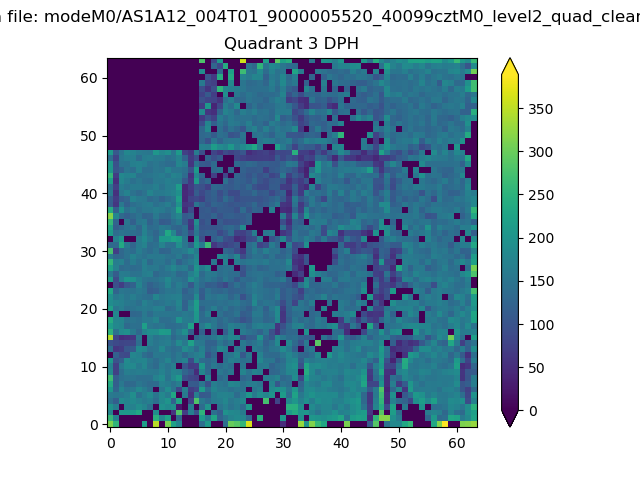 |
 |
Quadrant C |
| Plot type | Count rate plots | Images |
|---|---|---|
| Comparison with Poisson distribution Blue bars denote a histogram of data divided into 1 sec bins. Red curve is a Poisson curve with rate = median count rate of data. |
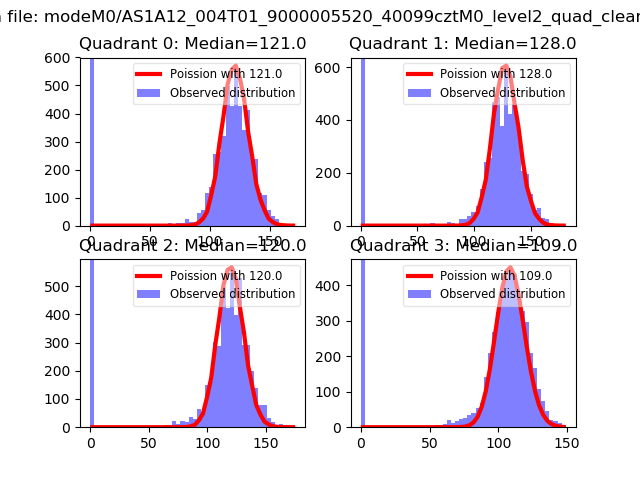 |
 |
| Quadrant-wise count rates Data is divided into 100 sec bins |
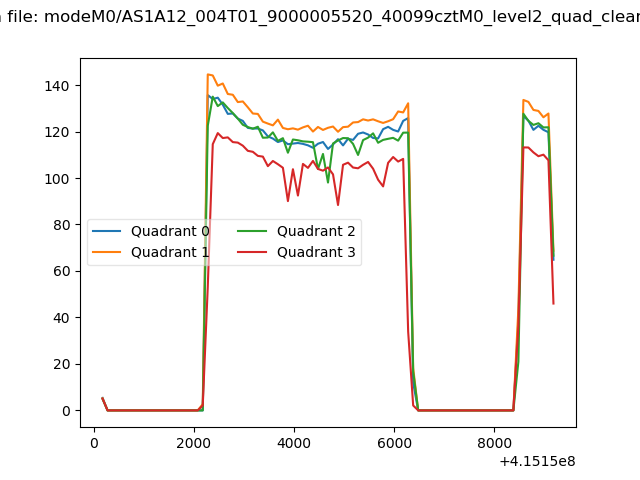 |
|
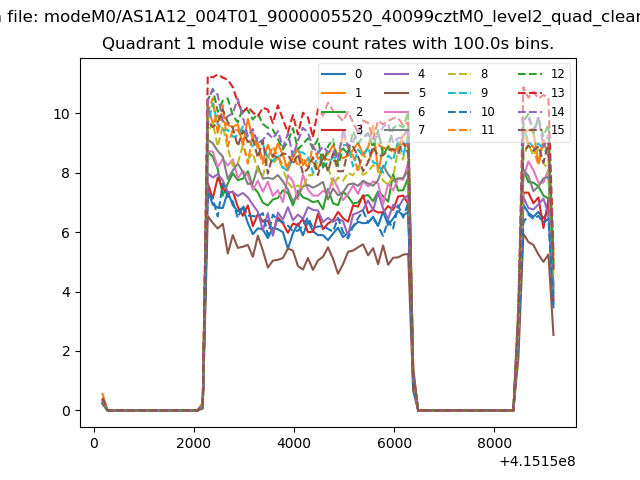
| Module-wise count rates for Quadrant A Data is divided into 100 sec bins |
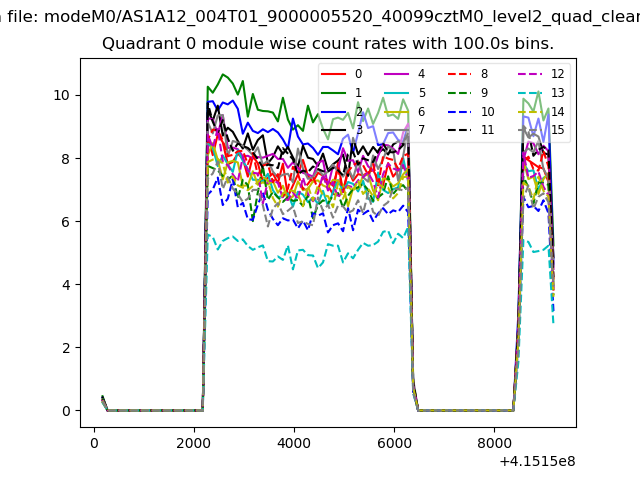 |
 |
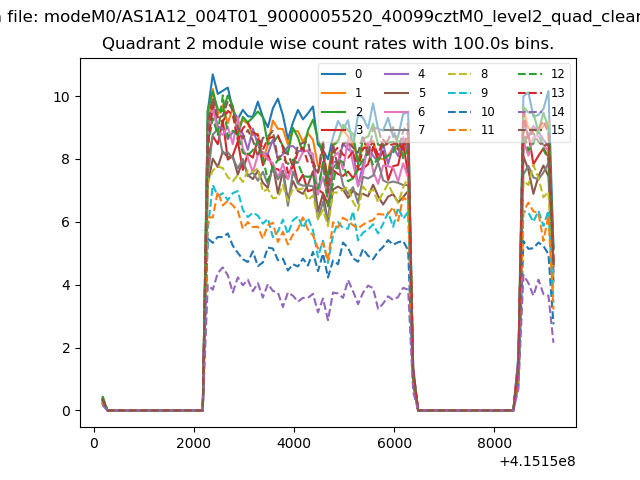
| Module-wise count rates for Quadrant B Data is divided into 100 sec bins |
 |
 |
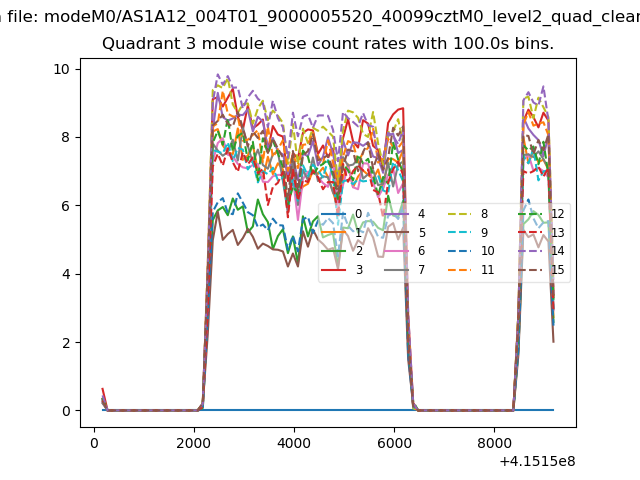
| Module-wise count rates for Quadrant C Data is divided into 100 sec bins |
 |
 |
| Module-wise count rates for Quadrant D Data is divided into 100 sec bins |
 |
 |
| Parameter | Plot |
|---|---|
| CZT HV Monitor | 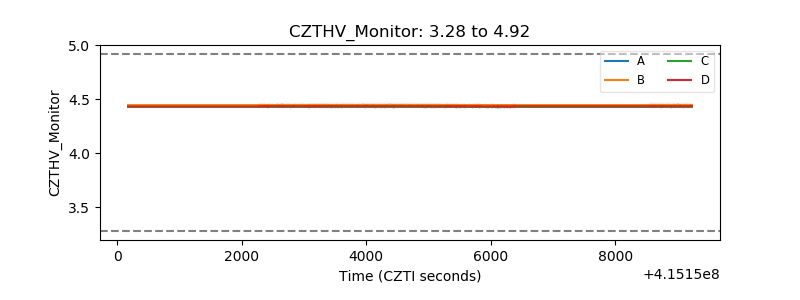 |
| D_VDD | 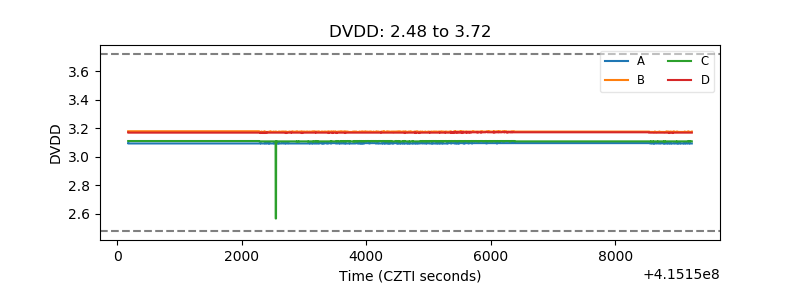 |
| Temperature 1 | 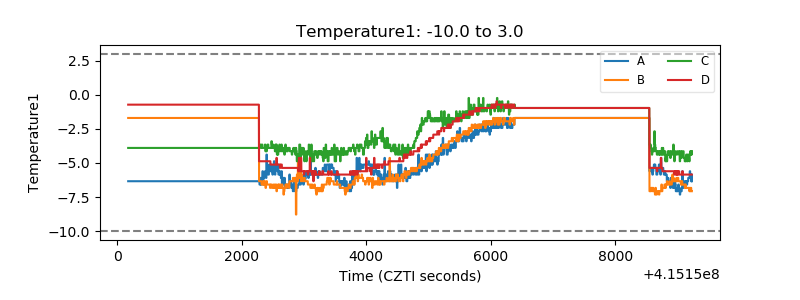 |
| Veto HV Monitor | 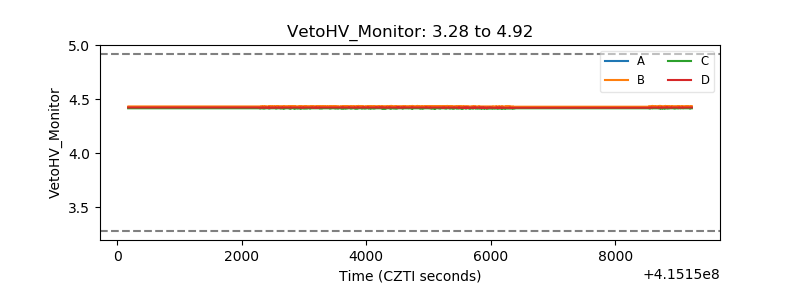 |
| Veto LLD | 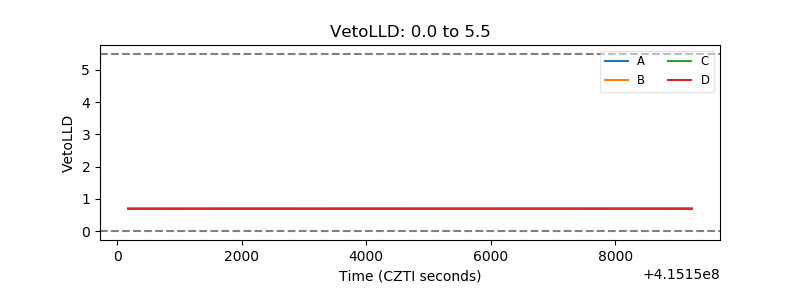 |
| Alpha Counter | 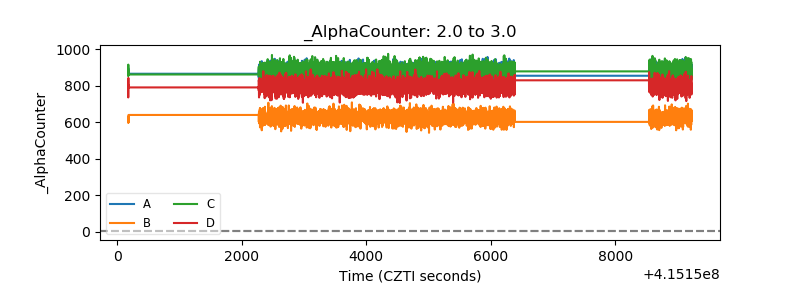 |
| _CPM_Rate | 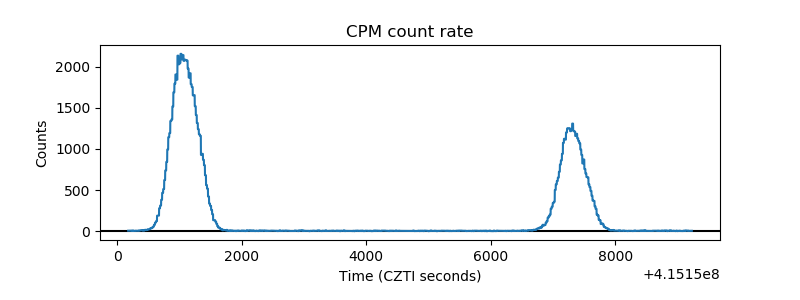 |
| CZT Counter | 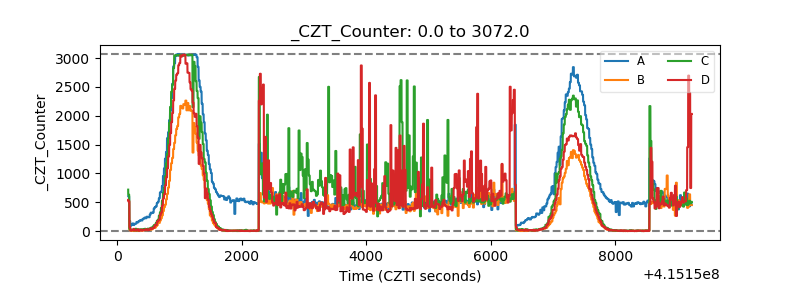 |
| +2.5 Volts monitor |  |
| +5 Volts monitor |  |
| _ROLL_ROT | 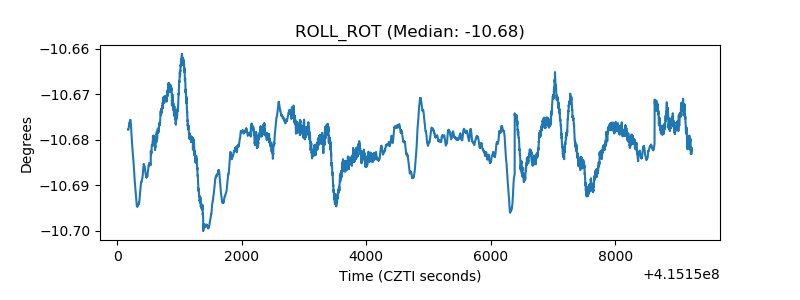 |
| _Roll_DEC | 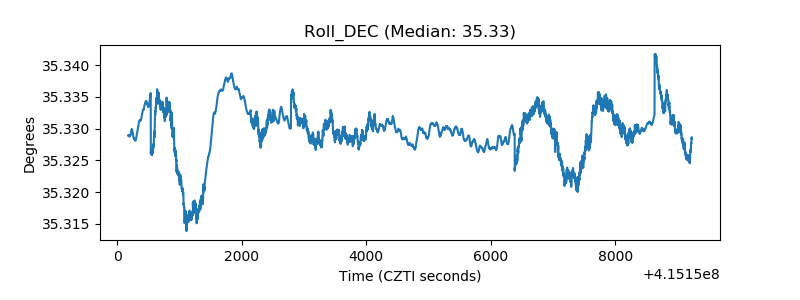 |
| _Roll_RA | 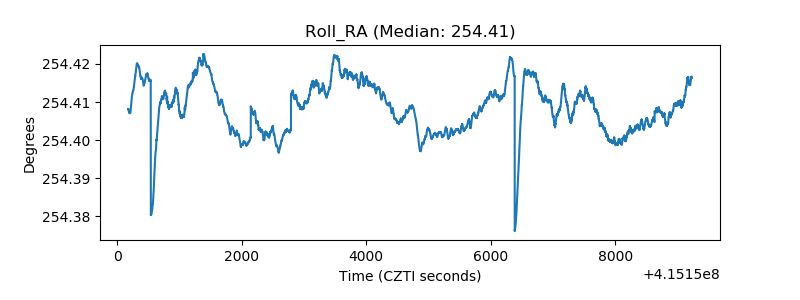 |
| Veto Counter | 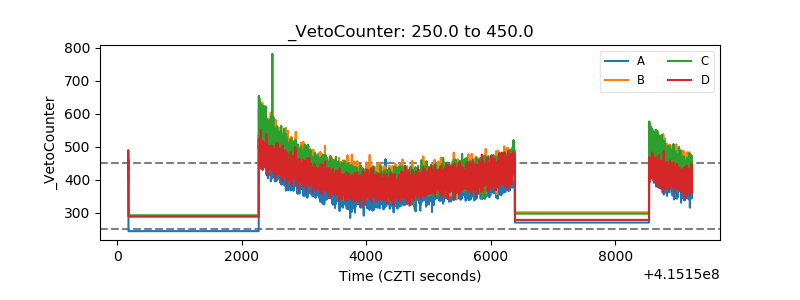 |