| Param | Original file | Final file |
|---|---|---|
| Filename | modeM0/AS1A12_004T01_9000005520_40100cztM0_level2.fits | modeM0/AS1A12_004T01_9000005520_40100cztM0_level2_quad_clean.evt |
| Size (bytes) | 388,126,080 | 89,236,800 |
| Size | 370.1 MB | 85.1 MB |
| Events in quadrant A | 2,695,328 | 604,479 |
| Events in quadrant B | 2,540,862 | 632,429 |
| Events in quadrant C | 4,402,632 | 577,051 |
| Events in quadrant D | 4,322,934 | 523,355 |
| Mode M0 | |||
|---|---|---|---|
| Quadrant | BADHDUFLAG | Total packets | Discarded packets |
| A | 0 | 11273 | 3 |
| B | 0 | 11121 | 2 |
| C | 0 | 16581 | 2 |
| D | 0 | 16486 | 2 |
| Mode M9 | |||
|---|---|---|---|
| Quadrant | BADHDUFLAG | Total packets | Discarded packets |
| A | 0 | 34 | 0 |
| B | 0 | 34 | 0 |
| C | 0 | 34 | 0 |
| D | 0 | 35 | 0 |
| Mode SS | |||
|---|---|---|---|
| Quadrant | BADHDUFLAG | Total packets | Discarded packets |
| A | 0 | 104 | 0 |
| B | 0 | 104 | 0 |
| C | 0 | 104 | 0 |
| D | 0 | 104 | 0 |
| Quadrant | Total seconds | Saturated seconds | Saturation percentage |
|---|---|---|---|
| A | 5216 | 9 | 0.172546% |
| B | 5216 | 12 | 0.230061% |
| C | 5216 | 295 | 5.655675% |
| D | 5216 | 306 | 5.866564% |
Noise dominated data is calculated using 1-second bins in cleaned event files. If a bin has >2000 counts, and if more than 50% of those come from <1% of pixels, then it is considered to be noise-dominated and hence unusable.
| Quadrant | # 1 sec bins | Bins with >0 counts | Bins with >2000 counts | High rate bins dominated by noise | Noise dominated (total time) | Noise dominated (detector-on time) | Marked lightcurve |
|---|---|---|---|---|---|---|---|
| A | 7339 | 5217 | 3 | 3 | 0.04% | 0.06% | 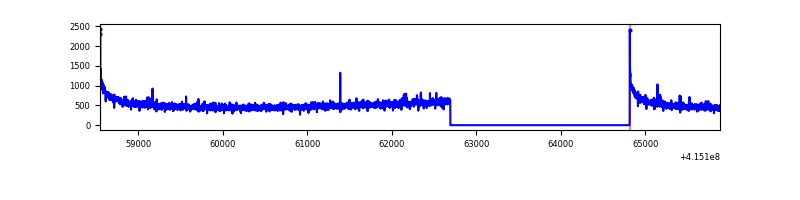 |
| B | 7339 | 5217 | 2 | 2 | 0.03% | 0.04% | 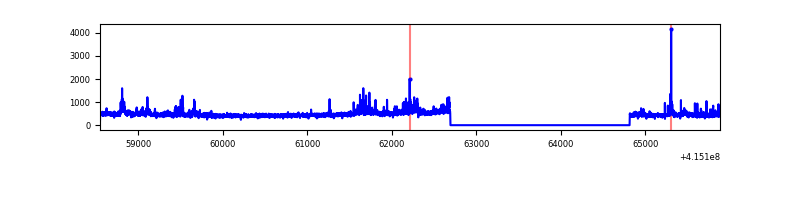 |
| C | 7339 | 5217 | 268 | 268 | 3.65% | 5.14% | 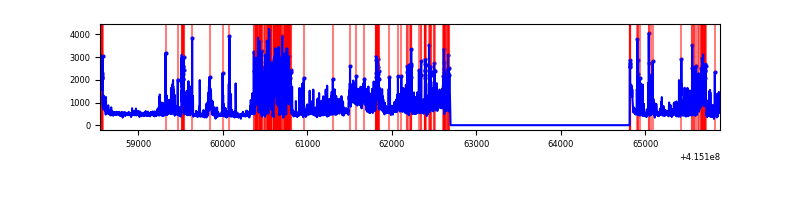 |
| D | 7339 | 5217 | 334 | 334 | 4.55% | 6.40% | 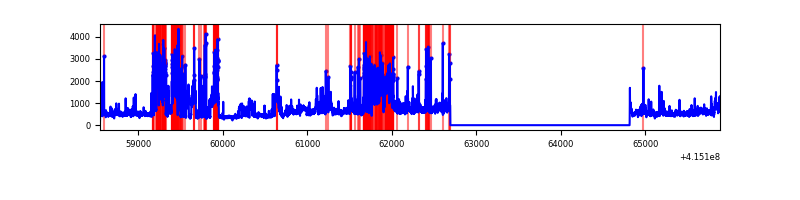 |
Top three noisy pixels from each quadrant. If the there are fewer than three noisy pixels in the level2.evt file, extra rows are filled as -1
| Pixel properties | Quadrant properties | ||||||
|---|---|---|---|---|---|---|---|
| Quadrant | DetID | PixID | Counts | Sigma | Mean | Median | Sigma |
| A | 10 | 83 | 450450 | 3849.78 | 573 | 561 | 116.9 |
| A | 15 | 223 | 15918 | 131.41 | 573 | 561 | 116.9 |
| A | 2 | 79 | 8963 | 71.9 | 573 | 561 | 116.9 |
| B | 0 | 189 | 189435 | 1701.77 | 574 | 560 | 111.0 |
| B | 4 | 171 | 66053 | 590.09 | 574 | 560 | 111.0 |
| B | 10 | 246 | 27477 | 242.52 | 574 | 560 | 111.0 |
| C | 9 | 187 | 1865577 | 14580.31 | 551 | 555 | 127.9 |
| C | 15 | 214 | 215356 | 1679.26 | 551 | 555 | 127.9 |
| C | 0 | 10 | 124831 | 971.56 | 551 | 555 | 127.9 |
| D | 12 | 227 | 2036112 | 15224.23 | 544 | 528 | 133.7 |
| D | 13 | 249 | 76620 | 569.09 | 544 | 528 | 133.7 |
| D | 1 | 47 | 54187 | 401.31 | 544 | 528 | 133.7 |
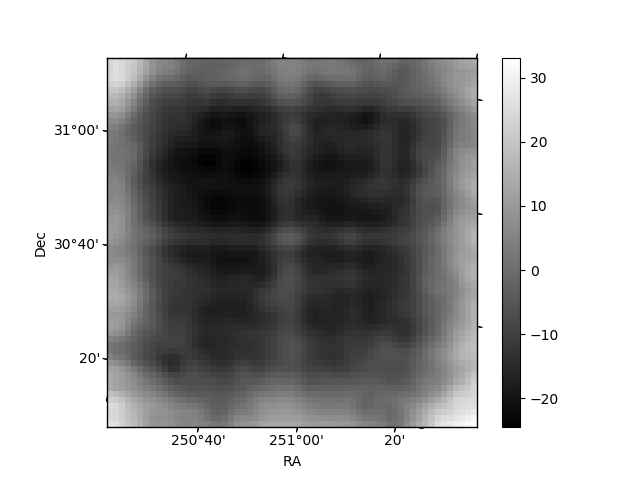
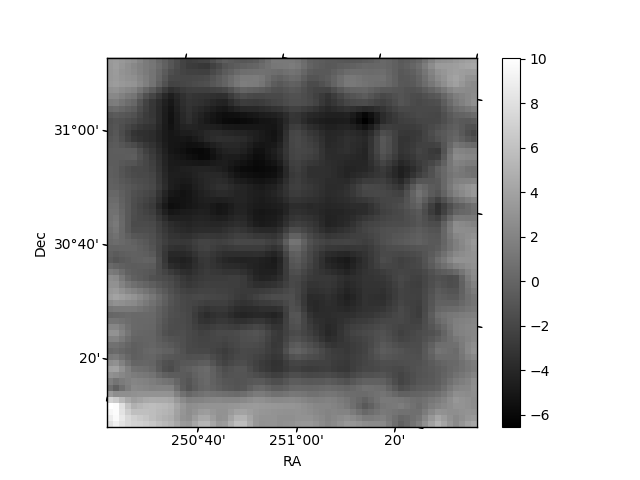
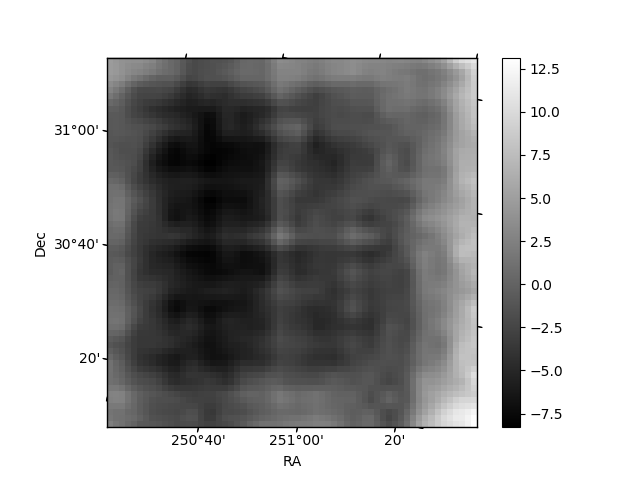
Histogram calculated using DETX and DETY for each event in the final _common_clean file
| Quadrant A | 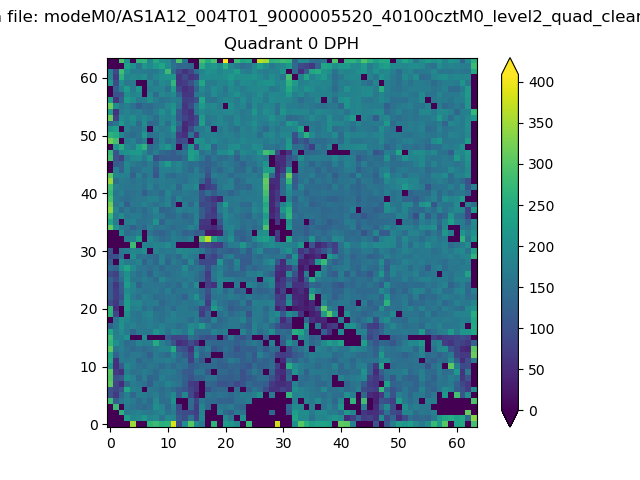 |
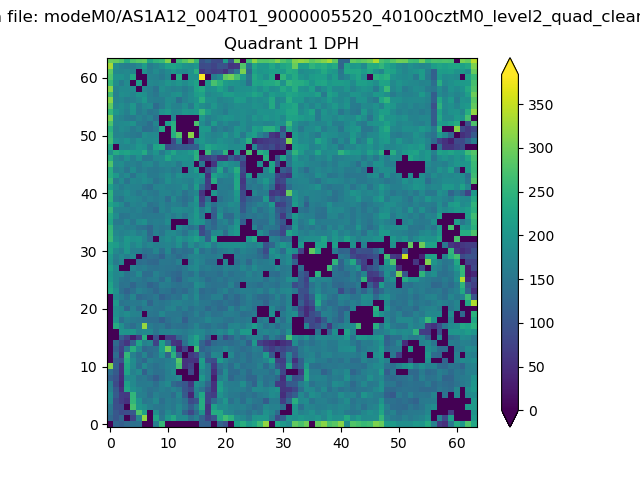 |
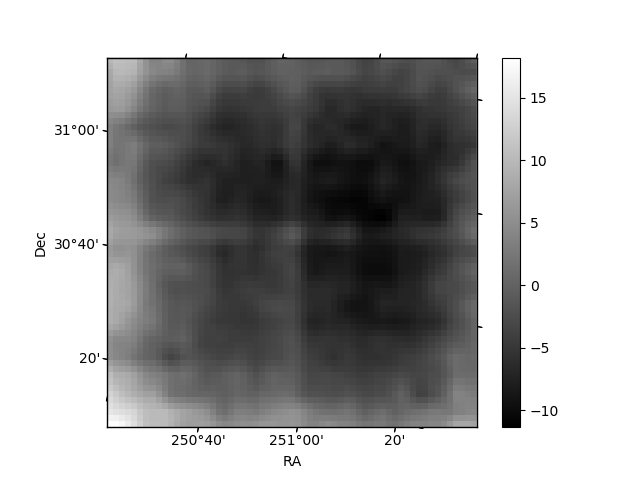
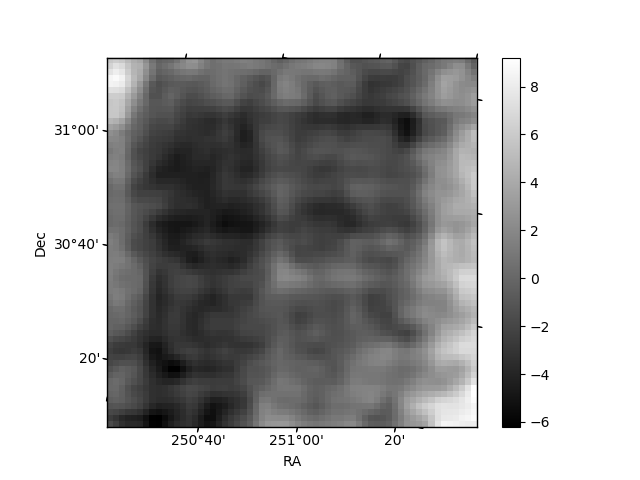
Quadrant B |
|---|---|---|---|
| Quadrant D | 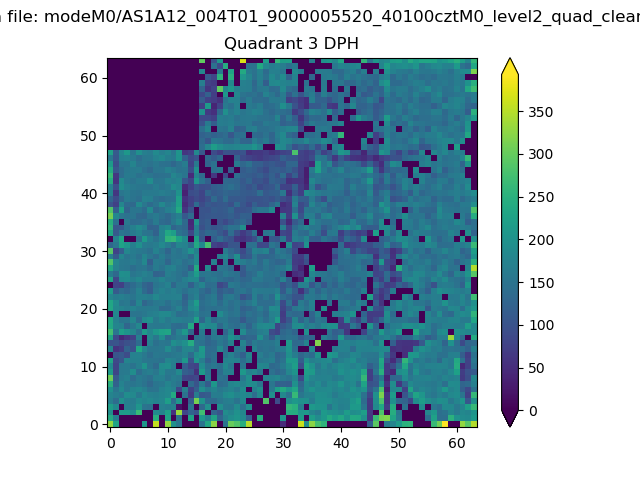 |
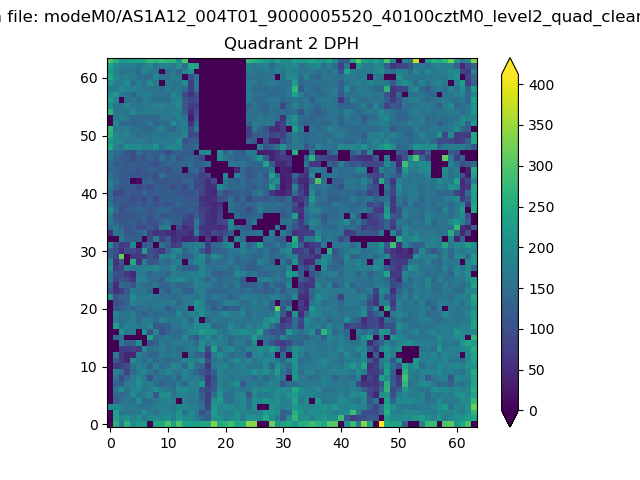 |
Quadrant C |
| Plot type | Count rate plots | Images |
|---|---|---|
| Comparison with Poisson distribution Blue bars denote a histogram of data divided into 1 sec bins. Red curve is a Poisson curve with rate = median count rate of data. |
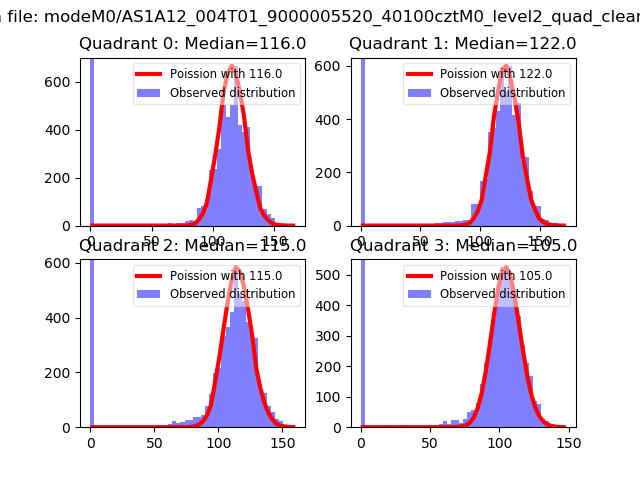 |
 |
| Quadrant-wise count rates Data is divided into 100 sec bins |
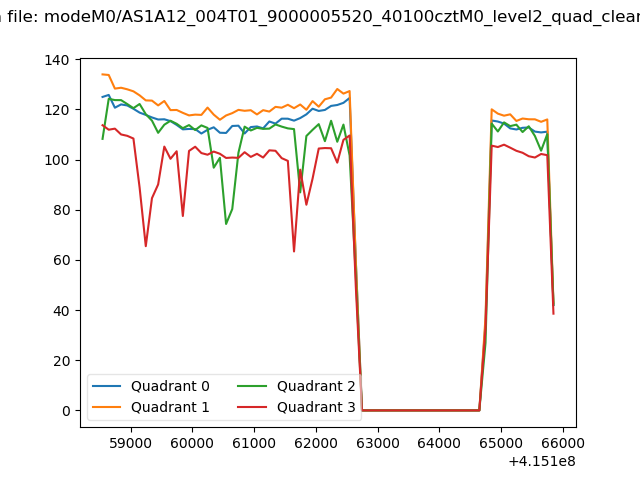 |
|
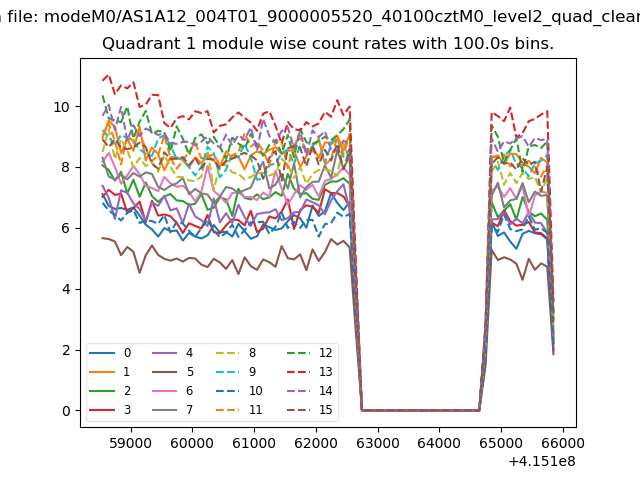
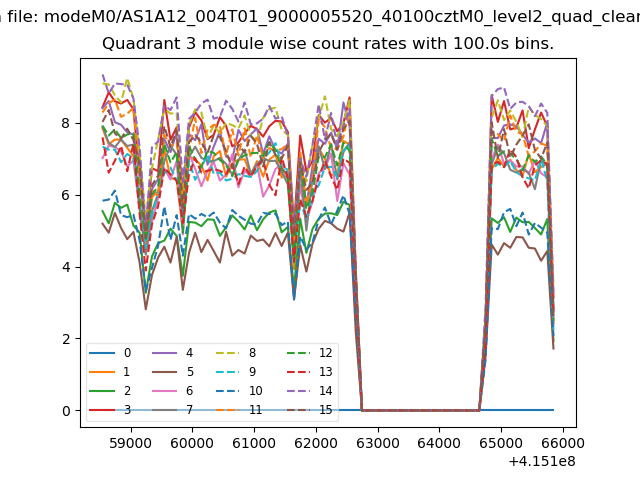
| Module-wise count rates for Quadrant A Data is divided into 100 sec bins |
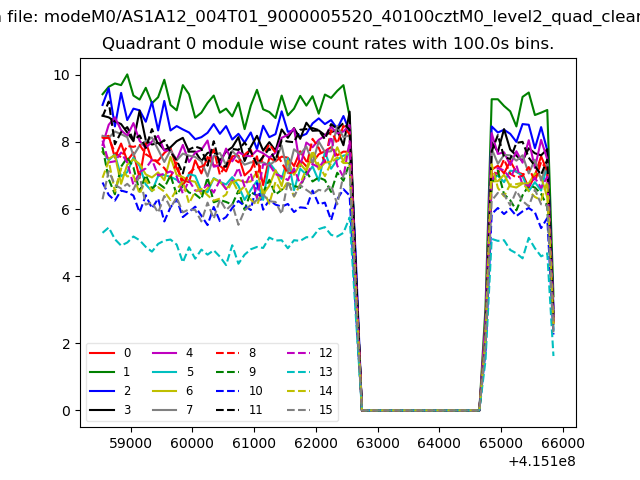 |
 |
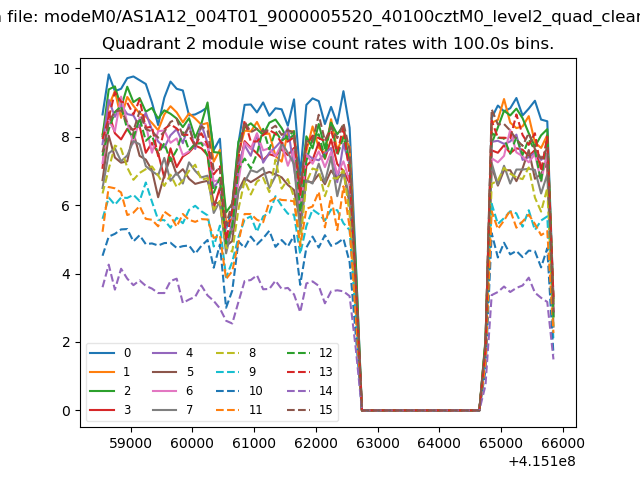
| Module-wise count rates for Quadrant B Data is divided into 100 sec bins |
 |
 |
| Module-wise count rates for Quadrant C Data is divided into 100 sec bins |
 |
 |
| Module-wise count rates for Quadrant D Data is divided into 100 sec bins |
 |
 |
| Parameter | Plot |
|---|---|
| CZT HV Monitor | 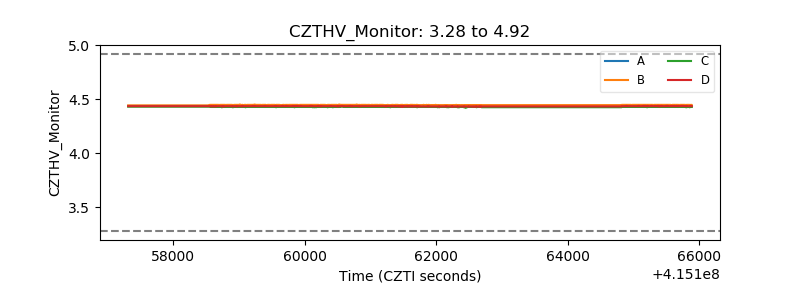 |
| D_VDD | 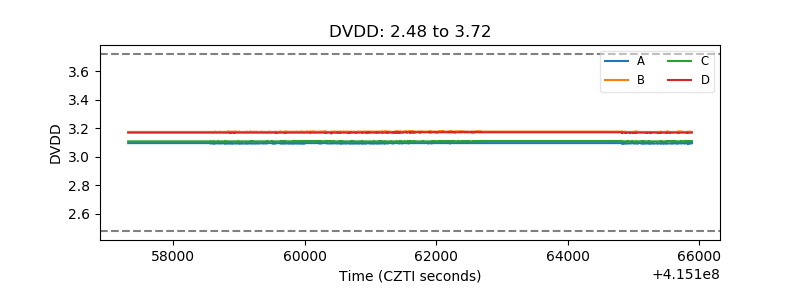 |
| Temperature 1 | 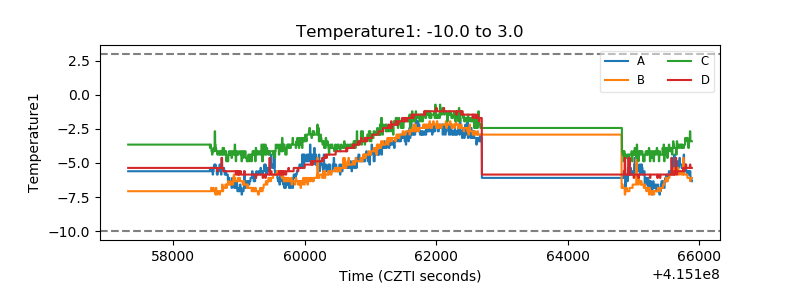 |
| Veto HV Monitor | 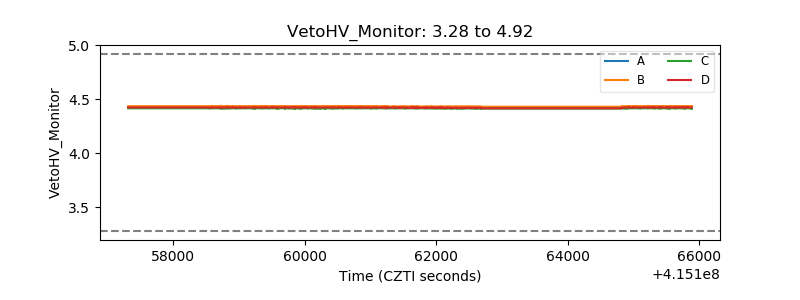 |
| Veto LLD | 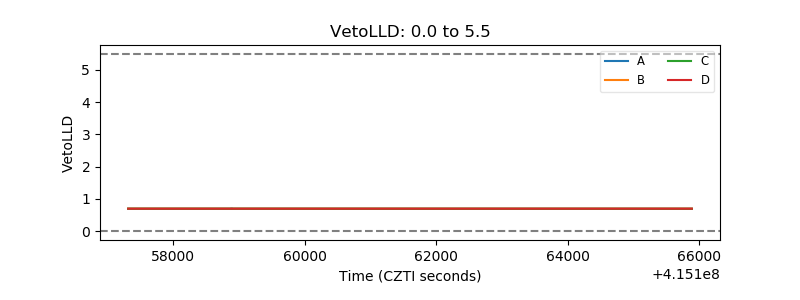 |
| Alpha Counter | 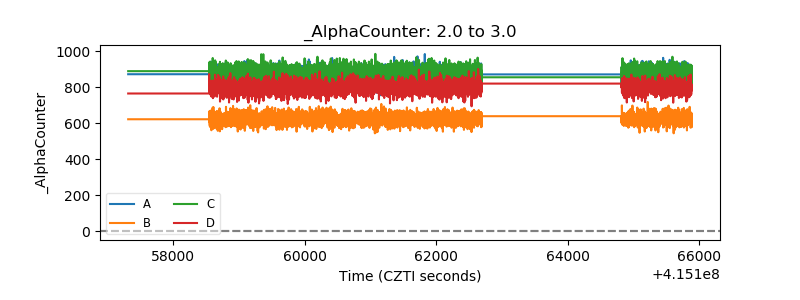 |
| _CPM_Rate | 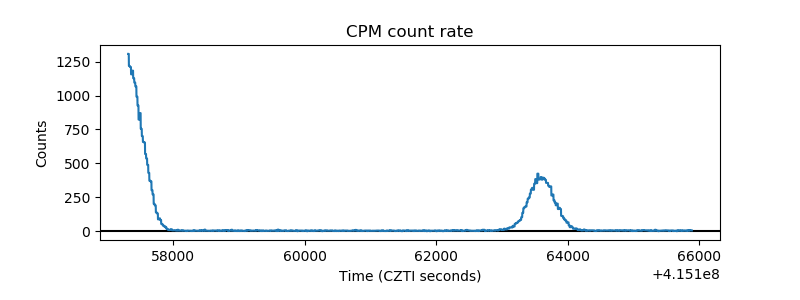 |
| CZT Counter | 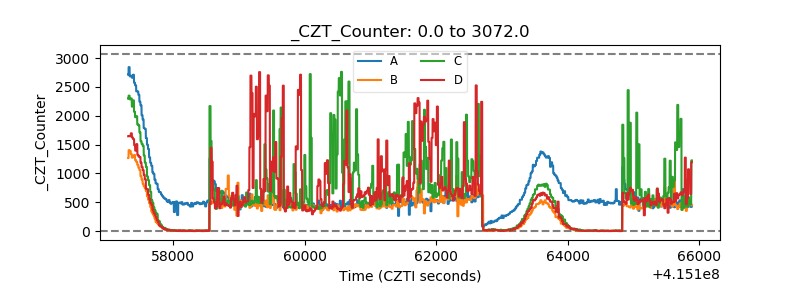 |
| +2.5 Volts monitor | 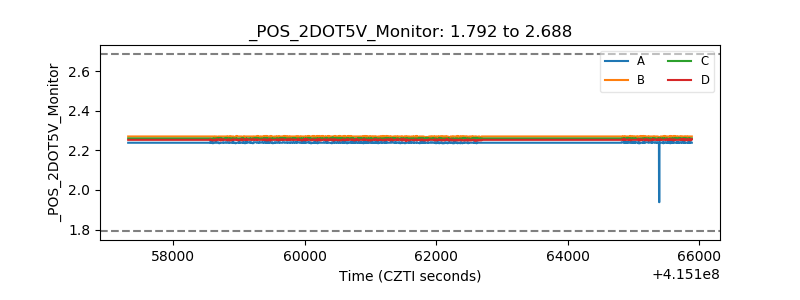 |
| +5 Volts monitor |  |
| _ROLL_ROT | 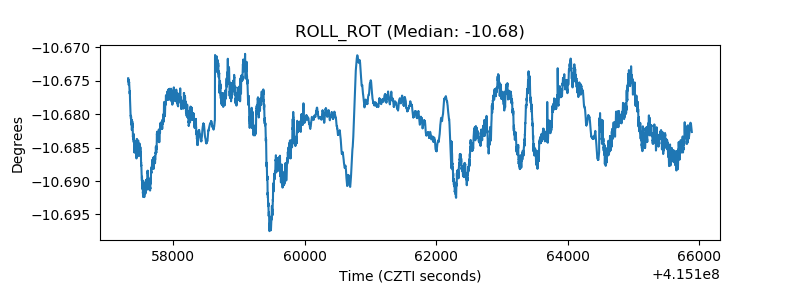 |
| _Roll_DEC | 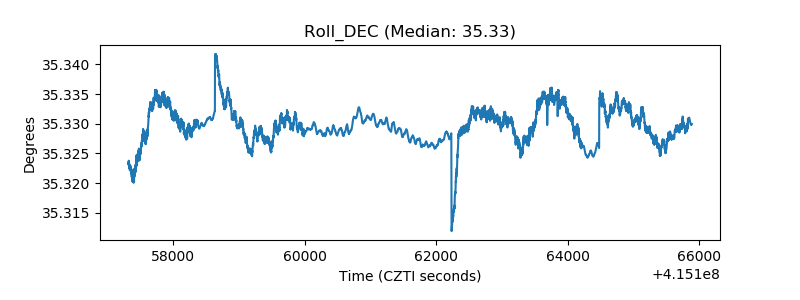 |
| _Roll_RA | 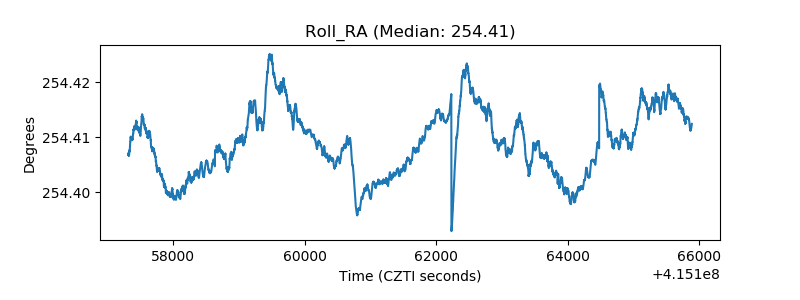 |
| Veto Counter | 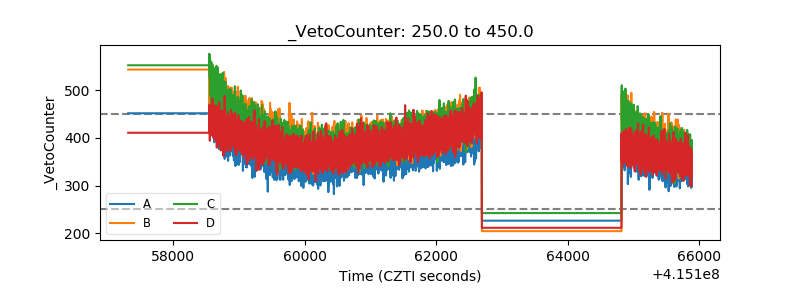 |