| Param | Original file | Final file |
|---|---|---|
| Filename | modeM0/AS1A12_004T01_9000005520_40102cztM0_level2.fits | modeM0/AS1A12_004T01_9000005520_40102cztM0_level2_quad_clean.evt |
| Size (bytes) | 360,676,800 | 90,740,160 |
| Size | 344.0 MB | 86.5 MB |
| Events in quadrant A | 2,795,161 | 609,806 |
| Events in quadrant B | 2,883,697 | 624,961 |
| Events in quadrant C | 3,505,305 | 593,278 |
| Events in quadrant D | 3,735,451 | 532,296 |
| Mode M0 | |||
|---|---|---|---|
| Quadrant | BADHDUFLAG | Total packets | Discarded packets |
| A | 0 | 11608 | 2 |
| B | 0 | 12358 | 1 |
| C | 0 | 13917 | 1 |
| D | 0 | 14957 | 1 |
| Mode M9 | |||
|---|---|---|---|
| Quadrant | BADHDUFLAG | Total packets | Discarded packets |
| A | 0 | 17 | 0 |
| B | 0 | 17 | 0 |
| C | 0 | 17 | 0 |
| D | 0 | 17 | 0 |
| Mode SS | |||
|---|---|---|---|
| Quadrant | BADHDUFLAG | Total packets | Discarded packets |
| A | 0 | 110 | 0 |
| B | 0 | 110 | 0 |
| C | 0 | 110 | 0 |
| D | 0 | 110 | 0 |
| Quadrant | Total seconds | Saturated seconds | Saturation percentage |
|---|---|---|---|
| A | 5544 | 10 | 0.180375% |
| B | 5544 | 8 | 0.144300% |
| C | 5544 | 94 | 1.695527% |
| D | 5544 | 241 | 4.347042% |
Noise dominated data is calculated using 1-second bins in cleaned event files. If a bin has >2000 counts, and if more than 50% of those come from <1% of pixels, then it is considered to be noise-dominated and hence unusable.
| Quadrant | # 1 sec bins | Bins with >0 counts | Bins with >2000 counts | High rate bins dominated by noise | Noise dominated (total time) | Noise dominated (detector-on time) | Marked lightcurve |
|---|---|---|---|---|---|---|---|
| A | 7155 | 5545 | 4 | 4 | 0.06% | 0.07% | 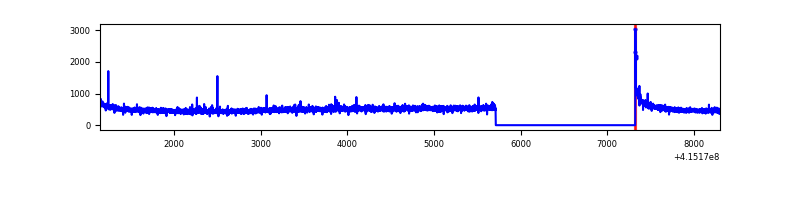 |
| B | 7155 | 5545 | 1 | 1 | 0.01% | 0.02% | 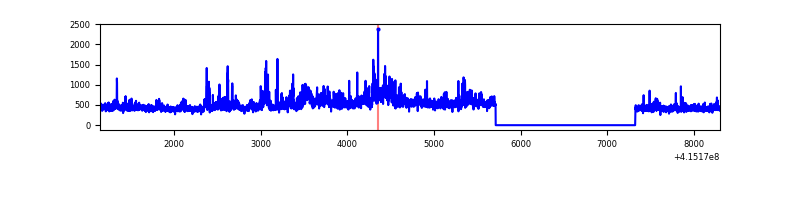 |
| C | 7155 | 5545 | 100 | 100 | 1.40% | 1.80% | 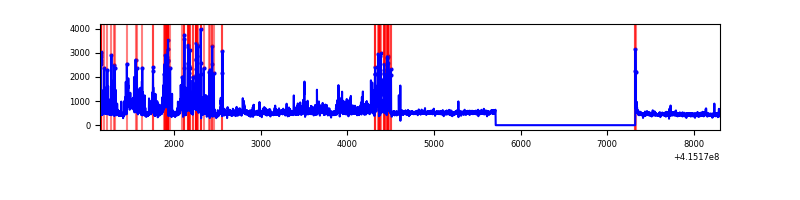 |
| D | 7155 | 5545 | 236 | 236 | 3.30% | 4.26% | 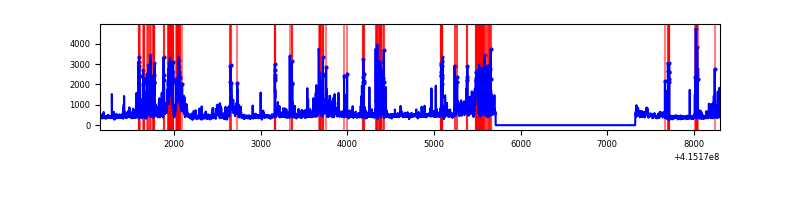 |
Top three noisy pixels from each quadrant. If the there are fewer than three noisy pixels in the level2.evt file, extra rows are filled as -1
| Pixel properties | Quadrant properties | ||||||
|---|---|---|---|---|---|---|---|
| Quadrant | DetID | PixID | Counts | Sigma | Mean | Median | Sigma |
| A | 10 | 83 | 426522 | 3432.04 | 605 | 594 | 124.1 |
| A | 12 | 189 | 12212 | 93.62 | 605 | 594 | 124.1 |
| A | 2 | 79 | 8178 | 61.11 | 605 | 594 | 124.1 |
| B | 0 | 189 | 412512 | 3511.67 | 601 | 584 | 117.3 |
| B | 10 | 246 | 48957 | 412.38 | 601 | 584 | 117.3 |
| B | 4 | 171 | 27919 | 233.03 | 601 | 584 | 117.3 |
| C | 9 | 187 | 957355 | 6916.63 | 587 | 591 | 138.3 |
| C | 15 | 214 | 228208 | 1645.49 | 587 | 591 | 138.3 |
| C | 0 | 10 | 14811 | 102.8 | 587 | 591 | 138.3 |
| D | 12 | 227 | 739635 | 5160.3 | 580 | 562 | 143.2 |
| D | 12 | 0 | 342941 | 2390.53 | 580 | 562 | 143.2 |
| D | 13 | 249 | 240913 | 1678.16 | 580 | 562 | 143.2 |
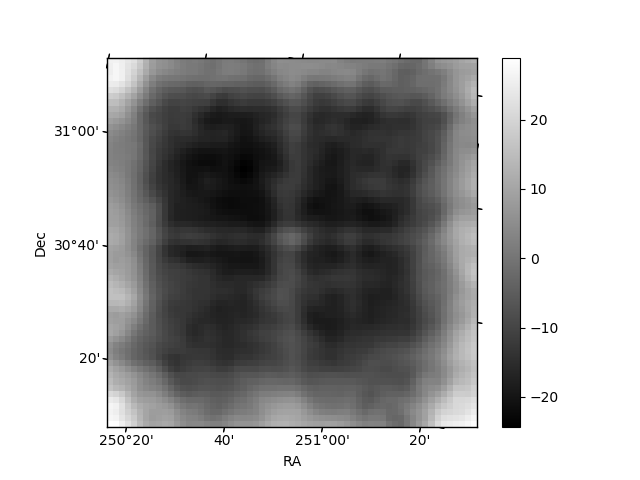
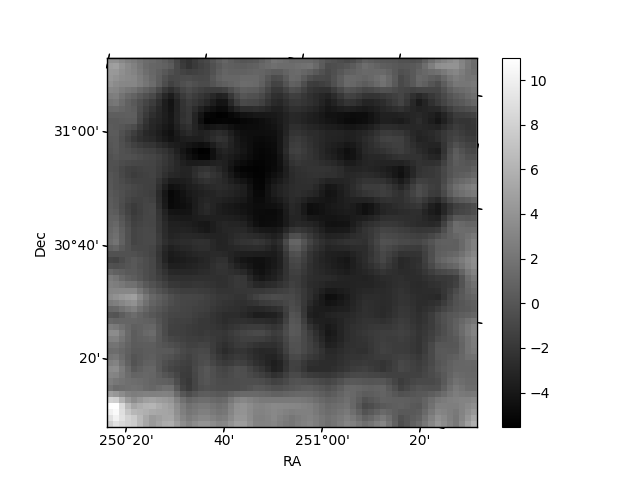
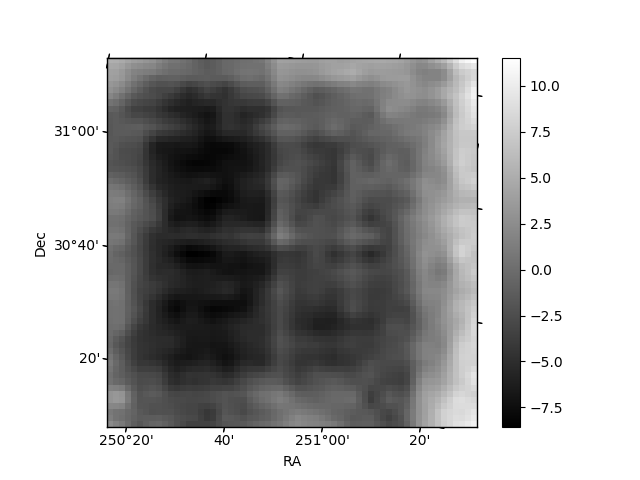
Histogram calculated using DETX and DETY for each event in the final _common_clean file
| Quadrant A | 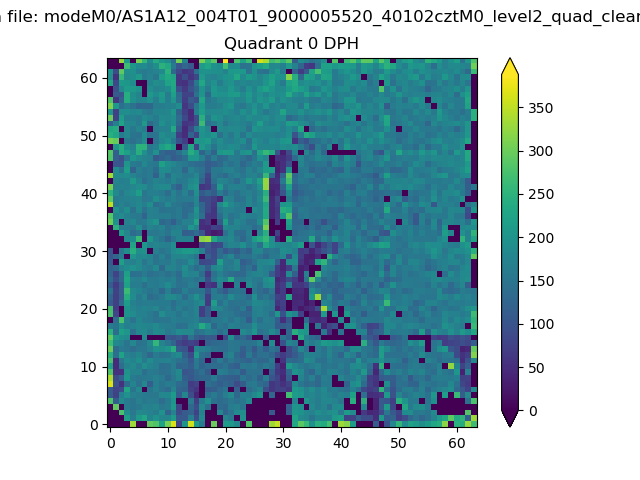 |
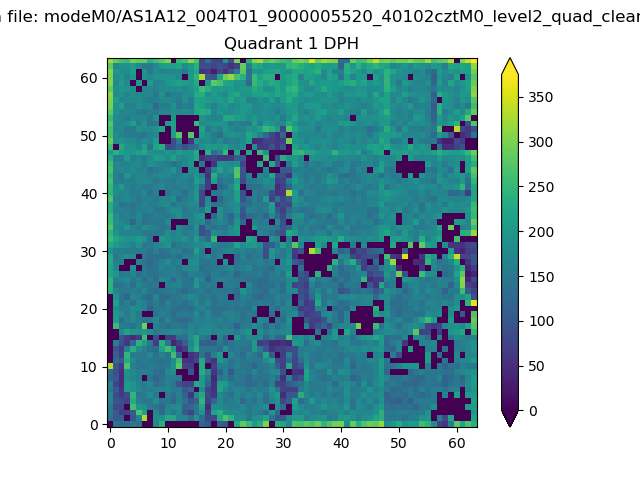 |
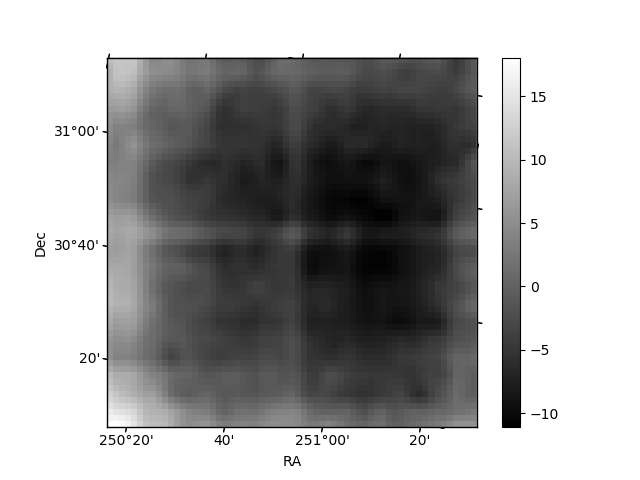
Quadrant B |
|---|---|---|---|
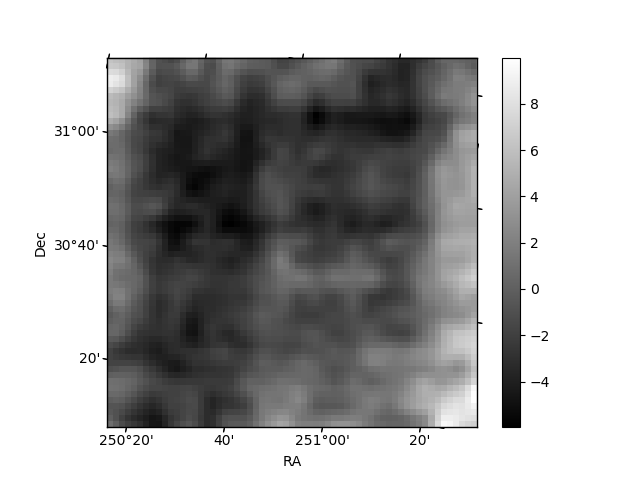
| Quadrant D | 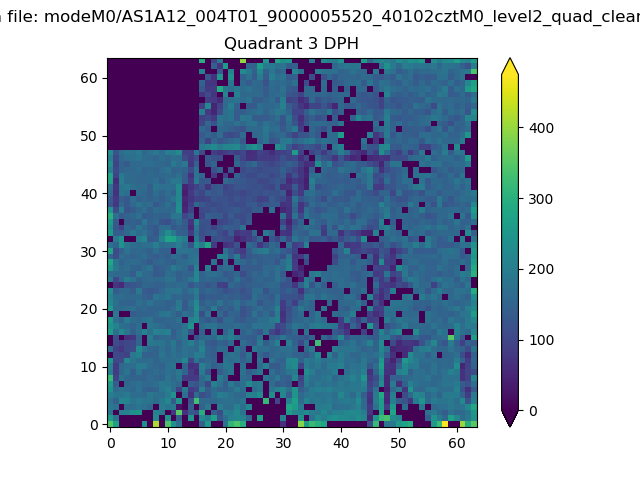 |
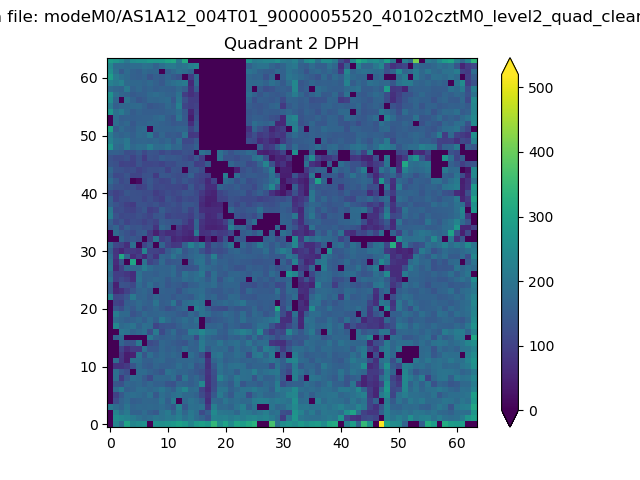 |
Quadrant C |
| Plot type | Count rate plots | Images |
|---|---|---|
| Comparison with Poisson distribution Blue bars denote a histogram of data divided into 1 sec bins. Red curve is a Poisson curve with rate = median count rate of data. |
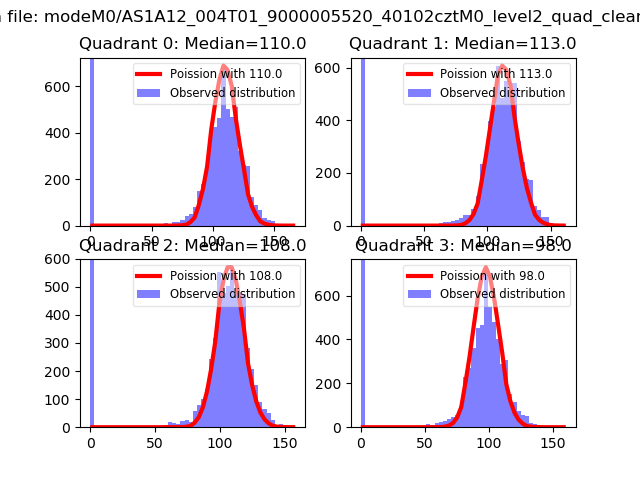 |
 |
| Quadrant-wise count rates Data is divided into 100 sec bins |
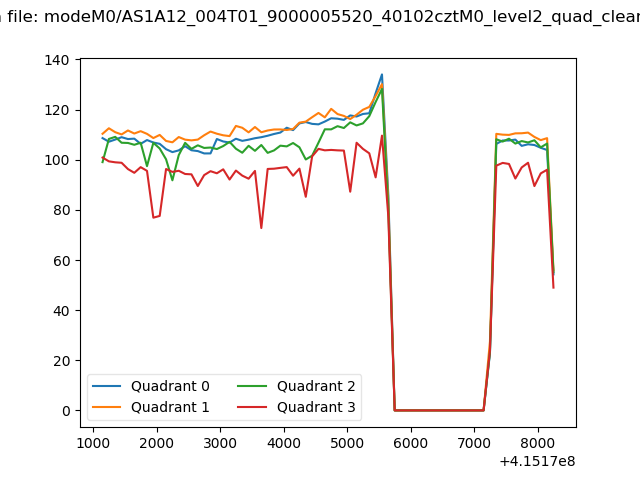 |
|
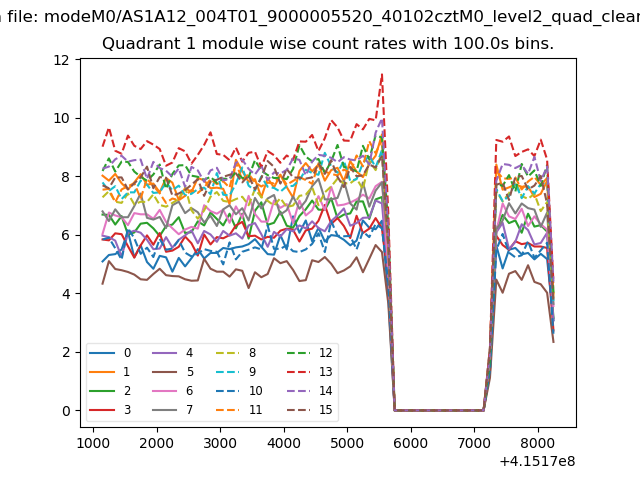
| Module-wise count rates for Quadrant A Data is divided into 100 sec bins |
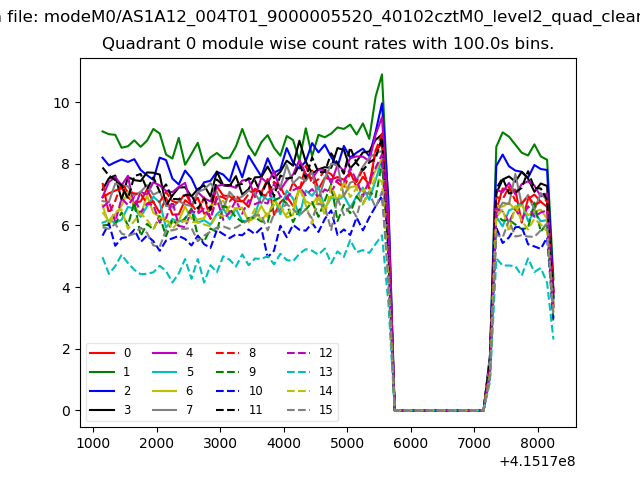 |
 |
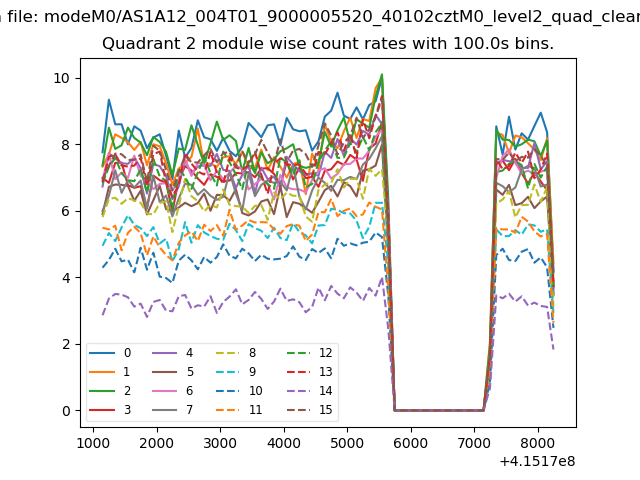
| Module-wise count rates for Quadrant B Data is divided into 100 sec bins |
 |
 |
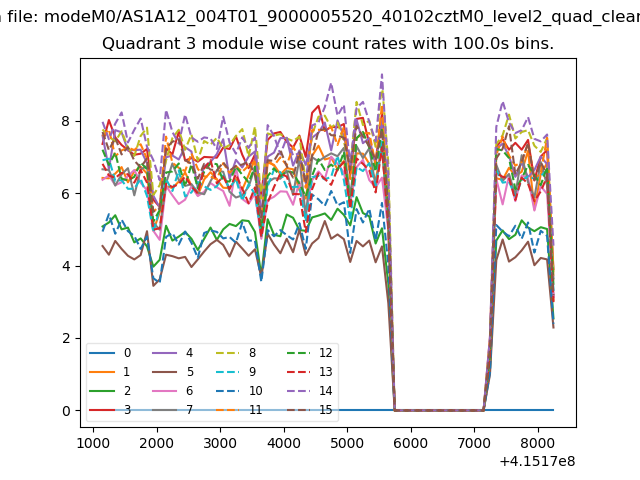
| Module-wise count rates for Quadrant C Data is divided into 100 sec bins |
 |
 |
| Module-wise count rates for Quadrant D Data is divided into 100 sec bins |
 |
 |
| Parameter | Plot |
|---|---|
| CZT HV Monitor | 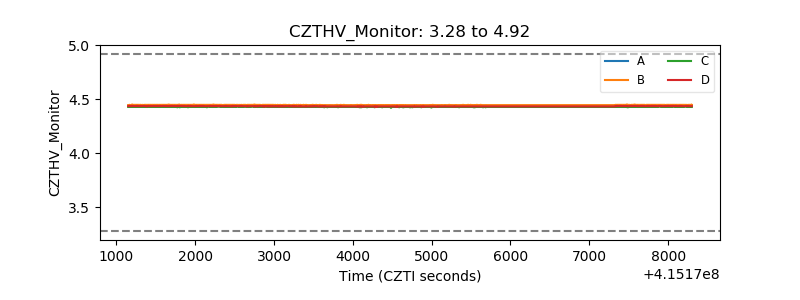 |
| D_VDD | 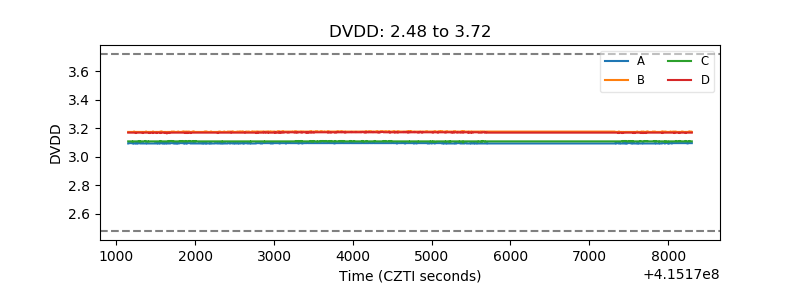 |
| Temperature 1 | 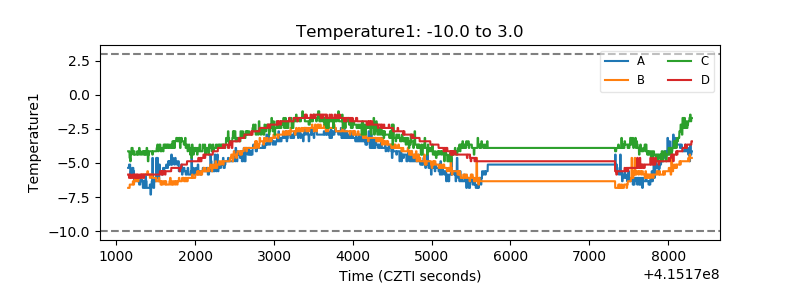 |
| Veto HV Monitor | 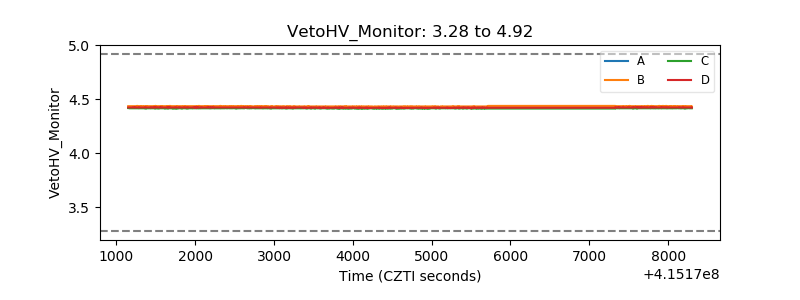 |
| Veto LLD | 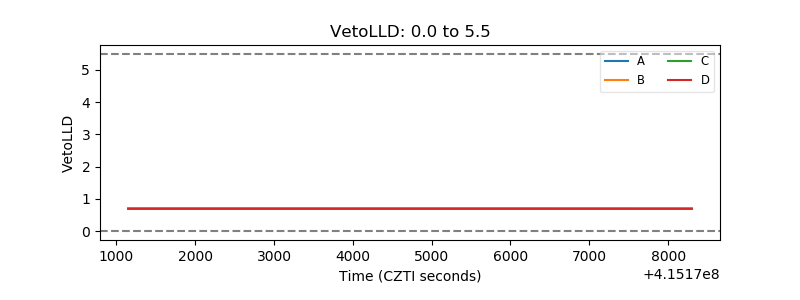 |
| Alpha Counter | 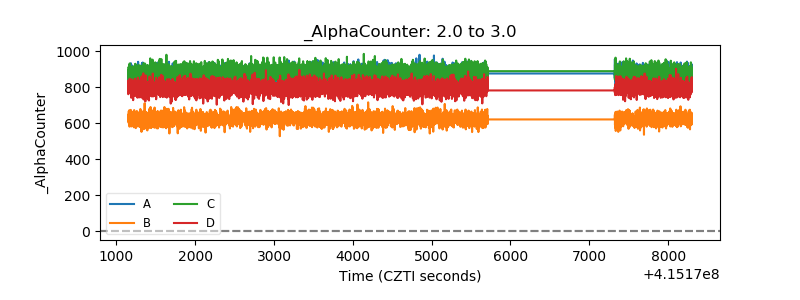 |
| _CPM_Rate | 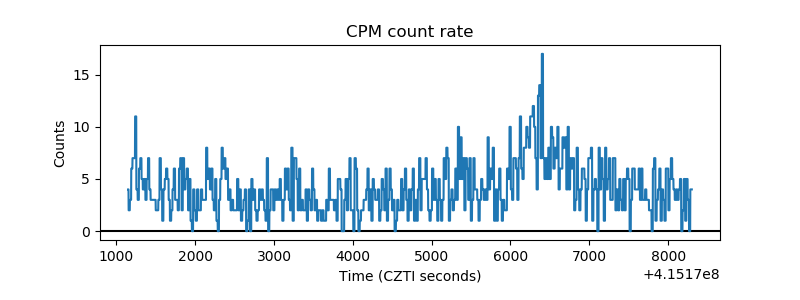 |
| CZT Counter | 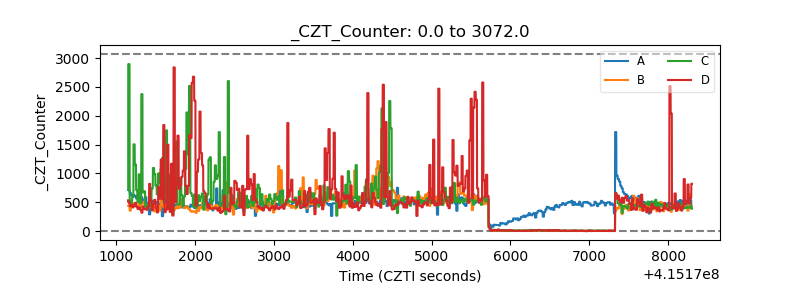 |
| +2.5 Volts monitor | 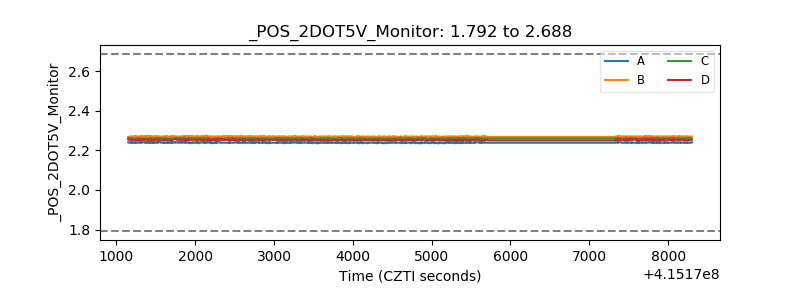 |
| +5 Volts monitor |  |
| _ROLL_ROT | 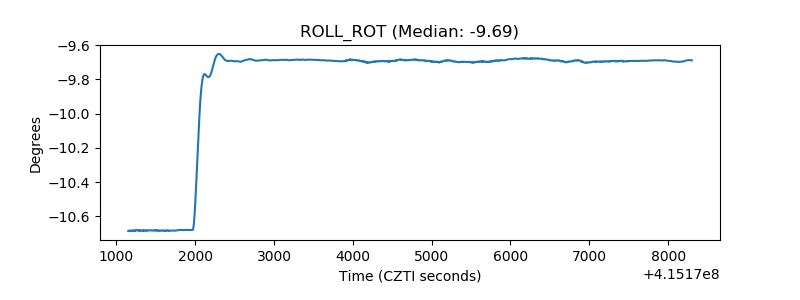 |
| _Roll_DEC | 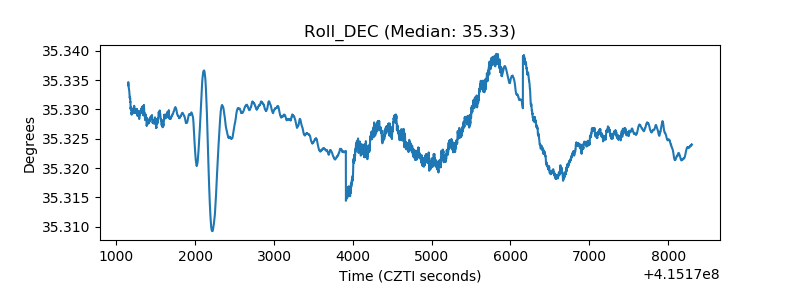 |
| _Roll_RA | 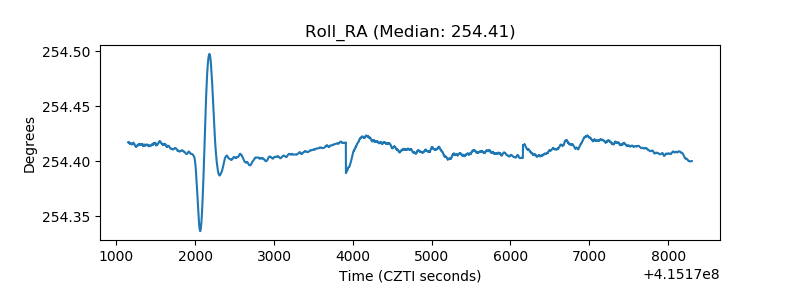 |
| Veto Counter | 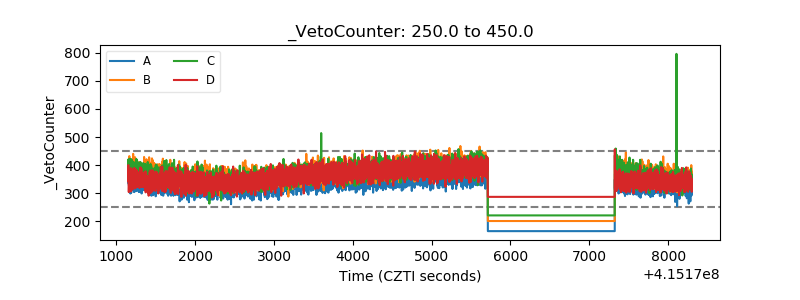 |