| Param | Original file | Final file |
|---|---|---|
| Filename | modeM0/AS1A12_004T01_9000005520_40103cztM0_level2.fits | modeM0/AS1A12_004T01_9000005520_40103cztM0_level2_quad_clean.evt |
| Size (bytes) | 362,151,360 | 93,977,280 |
| Size | 345.4 MB | 89.6 MB |
| Events in quadrant A | 3,346,975 | 621,621 |
| Events in quadrant B | 2,882,195 | 650,300 |
| Events in quadrant C | 2,768,740 | 621,432 |
| Events in quadrant D | 3,954,368 | 544,757 |
| Mode M0 | |||
|---|---|---|---|
| Quadrant | BADHDUFLAG | Total packets | Discarded packets |
| A | 0 | 13423 | 3 |
| B | 0 | 12579 | 2 |
| C | 0 | 11911 | 2 |
| D | 0 | 15896 | 2 |
| Mode M9 | |||
|---|---|---|---|
| Quadrant | BADHDUFLAG | Total packets | Discarded packets |
| A | 0 | 14 | 0 |
| B | 0 | 14 | 0 |
| C | 0 | 14 | 0 |
| D | 0 | 15 | 0 |
| Mode SS | |||
|---|---|---|---|
| Quadrant | BADHDUFLAG | Total packets | Discarded packets |
| A | 0 | 120 | 0 |
| B | 0 | 120 | 0 |
| C | 0 | 120 | 0 |
| D | 0 | 120 | 0 |
| Quadrant | Total seconds | Saturated seconds | Saturation percentage |
|---|---|---|---|
| A | 5823 | 109 | 1.871887% |
| B | 5823 | 44 | 0.755624% |
| C | 5823 | 13 | 0.223253% |
| D | 5823 | 356 | 6.113687% |
Noise dominated data is calculated using 1-second bins in cleaned event files. If a bin has >2000 counts, and if more than 50% of those come from <1% of pixels, then it is considered to be noise-dominated and hence unusable.
| Quadrant | # 1 sec bins | Bins with >0 counts | Bins with >2000 counts | High rate bins dominated by noise | Noise dominated (total time) | Noise dominated (detector-on time) | Marked lightcurve |
|---|---|---|---|---|---|---|---|
| A | 7195 | 5824 | 78 | 78 | 1.08% | 1.34% | 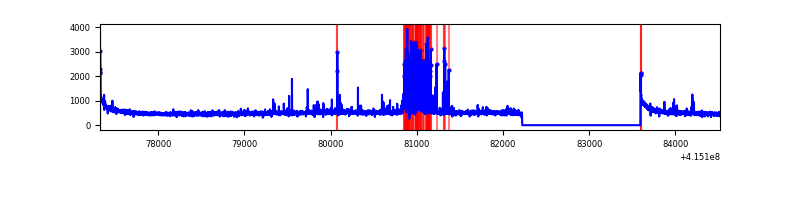 |
| B | 7195 | 5824 | 24 | 24 | 0.33% | 0.41% | 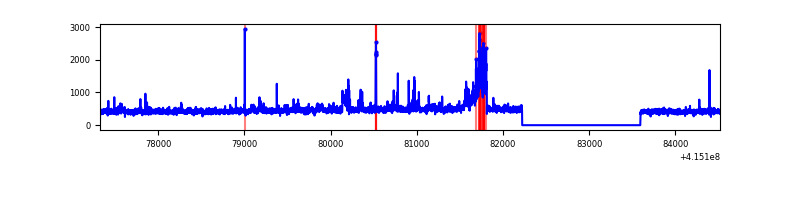 |
| C | 7195 | 5824 | 9 | 9 | 0.13% | 0.15% | 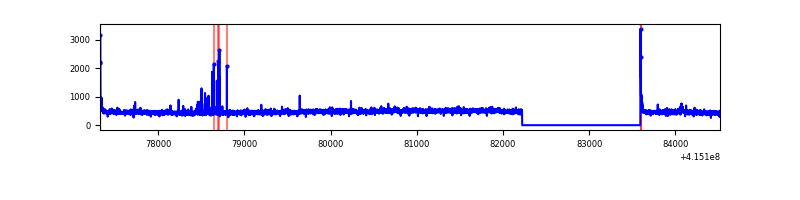 |
| D | 7195 | 5824 | 300 | 300 | 4.17% | 5.15% | 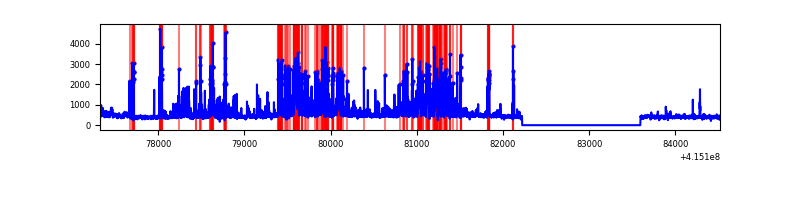 |
Top three noisy pixels from each quadrant. If the there are fewer than three noisy pixels in the level2.evt file, extra rows are filled as -1
| Pixel properties | Quadrant properties | ||||||
|---|---|---|---|---|---|---|---|
| Quadrant | DetID | PixID | Counts | Sigma | Mean | Median | Sigma |
| A | 10 | 83 | 488497 | 3766.48 | 632 | 618 | 129.5 |
| A | 13 | 248 | 339002 | 2612.36 | 632 | 618 | 129.5 |
| A | 2 | 79 | 42286 | 321.68 | 632 | 618 | 129.5 |
| B | 10 | 246 | 245409 | 1961.1 | 632 | 613 | 124.8 |
| B | 0 | 189 | 101013 | 804.32 | 632 | 613 | 124.8 |
| B | 0 | 230 | 19053 | 147.73 | 632 | 613 | 124.8 |
| C | 15 | 214 | 242732 | 1645.99 | 622 | 623 | 147.1 |
| C | 10 | 20 | 40141 | 268.67 | 622 | 623 | 147.1 |
| C | 0 | 10 | 33043 | 220.41 | 622 | 623 | 147.1 |
| D | 12 | 227 | 891820 | 5998.77 | 602 | 585 | 148.6 |
| D | 13 | 249 | 347047 | 2331.98 | 602 | 585 | 148.6 |
| D | 1 | 47 | 192331 | 1290.61 | 602 | 585 | 148.6 |
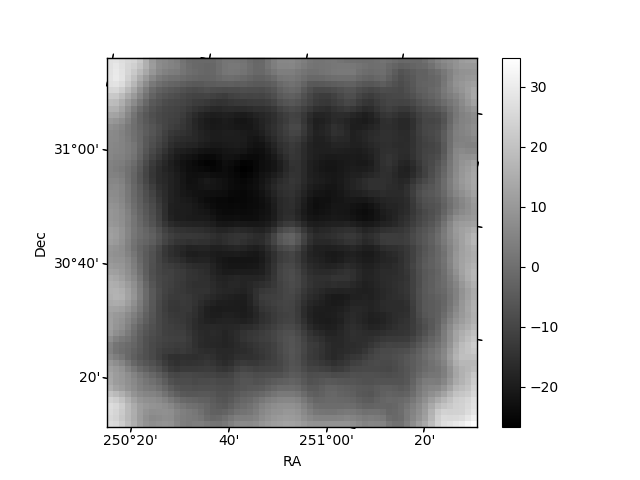
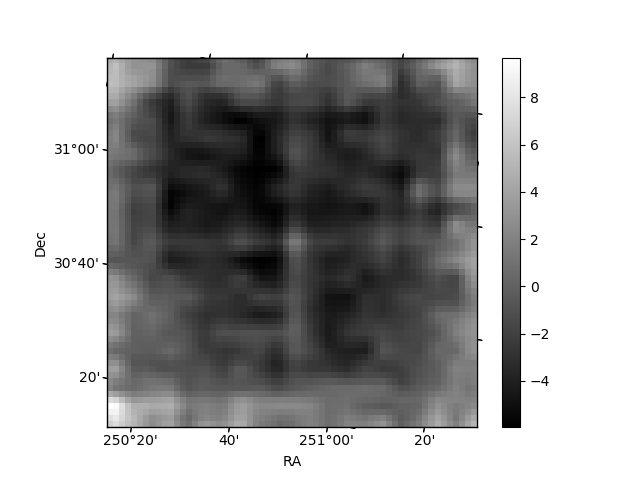
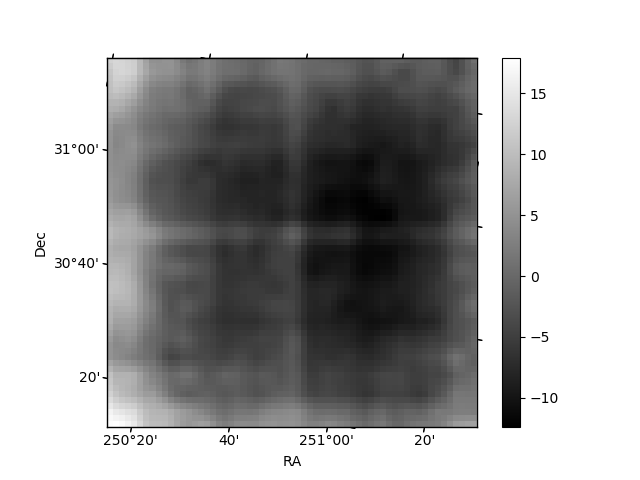
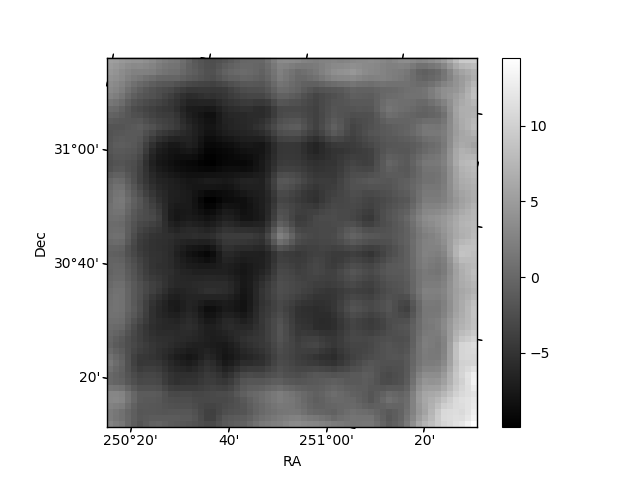
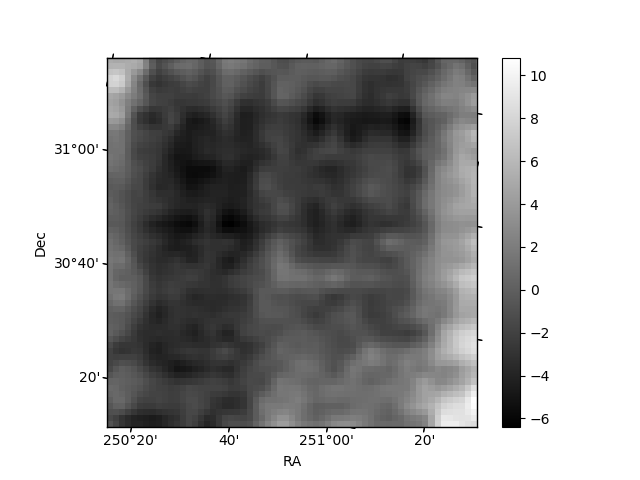
Histogram calculated using DETX and DETY for each event in the final _common_clean file
| Quadrant A | 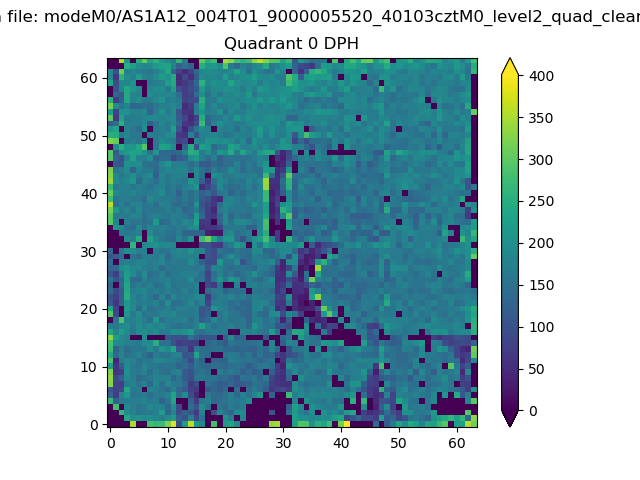 |
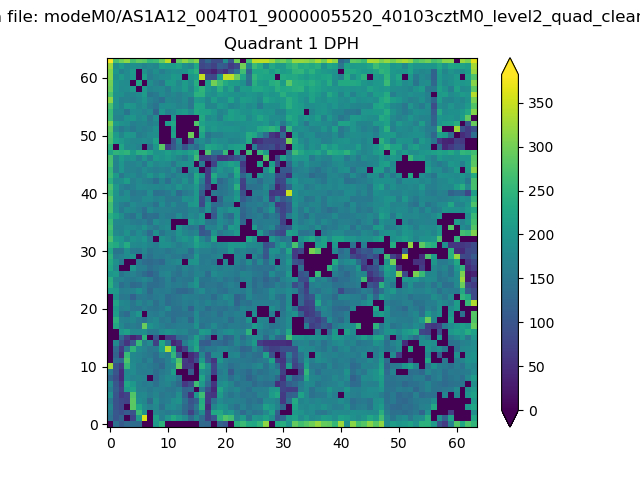 |
Quadrant B |
|---|---|---|---|
| Quadrant D | 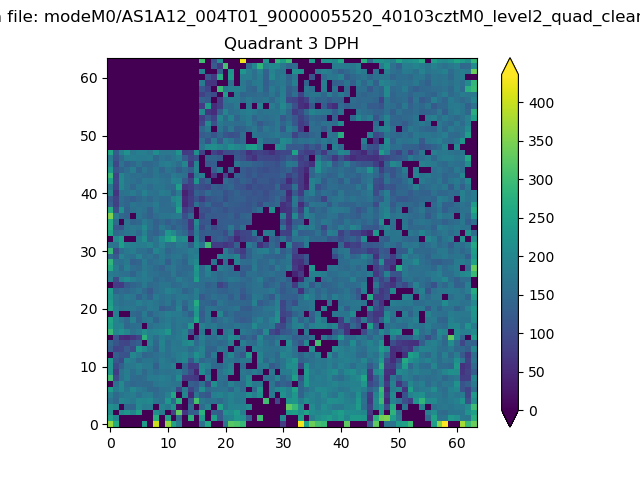 |
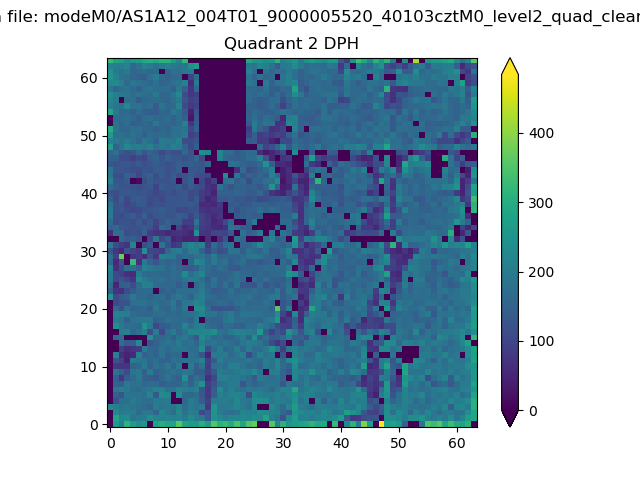 |
Quadrant C |
| Plot type | Count rate plots | Images |
|---|---|---|
| Comparison with Poisson distribution Blue bars denote a histogram of data divided into 1 sec bins. Red curve is a Poisson curve with rate = median count rate of data. |
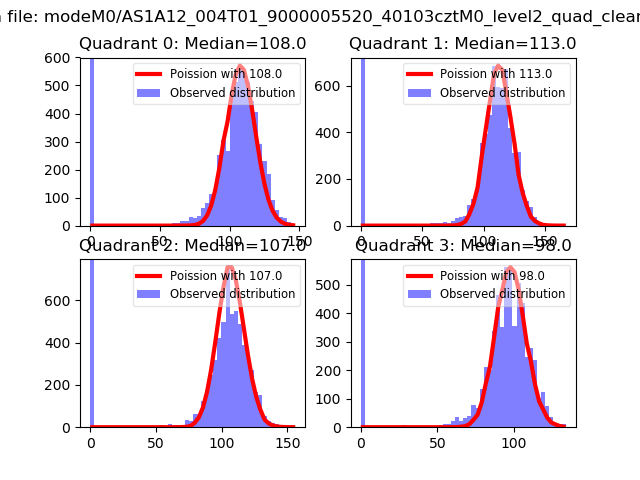 |
 |
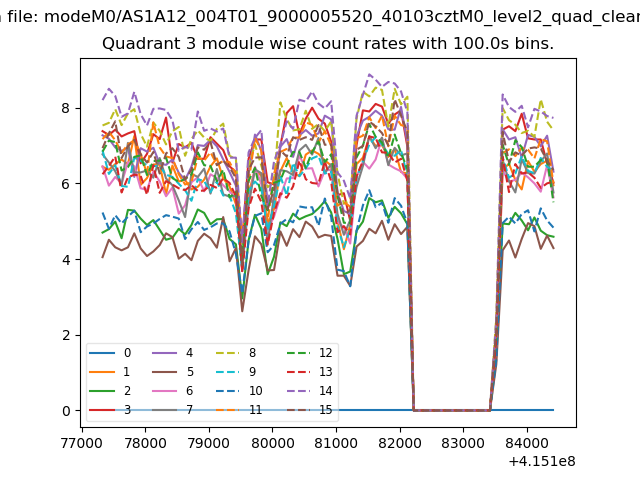
| Quadrant-wise count rates Data is divided into 100 sec bins |
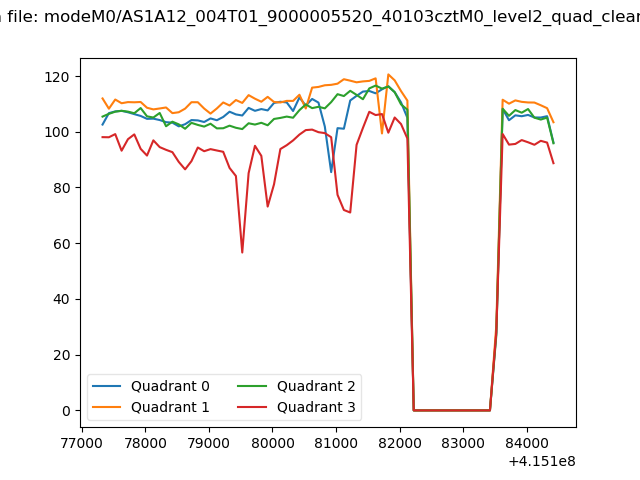 |
|
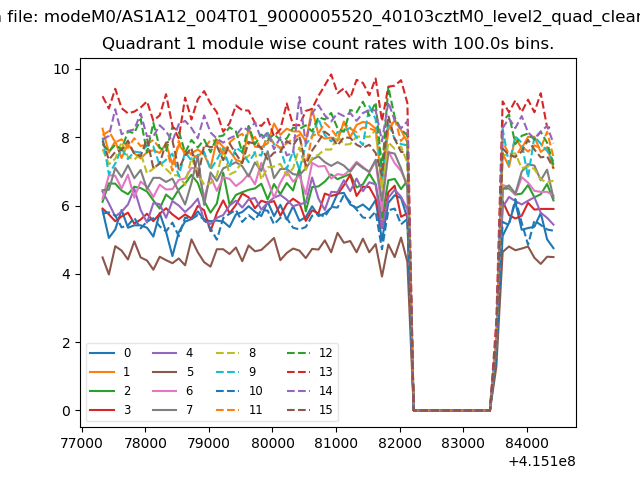
| Module-wise count rates for Quadrant A Data is divided into 100 sec bins |
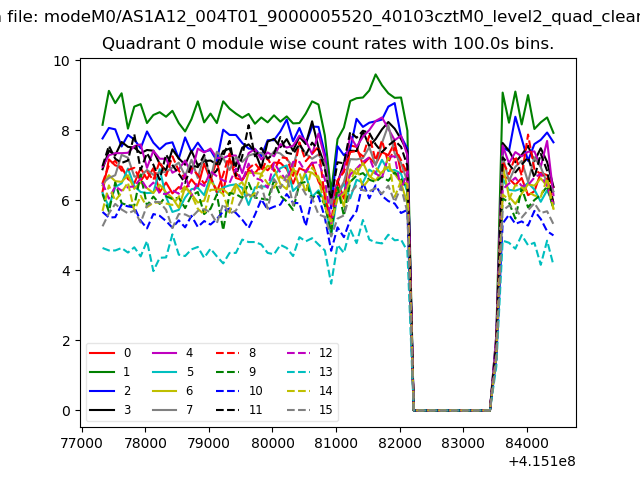 |
 |
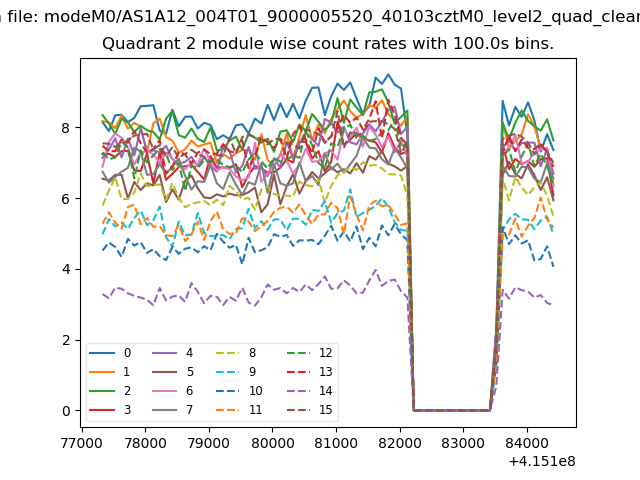
| Module-wise count rates for Quadrant B Data is divided into 100 sec bins |
 |
 |
| Module-wise count rates for Quadrant C Data is divided into 100 sec bins |
 |
 |
| Module-wise count rates for Quadrant D Data is divided into 100 sec bins |
 |
 |
| Parameter | Plot |
|---|---|
| CZT HV Monitor | 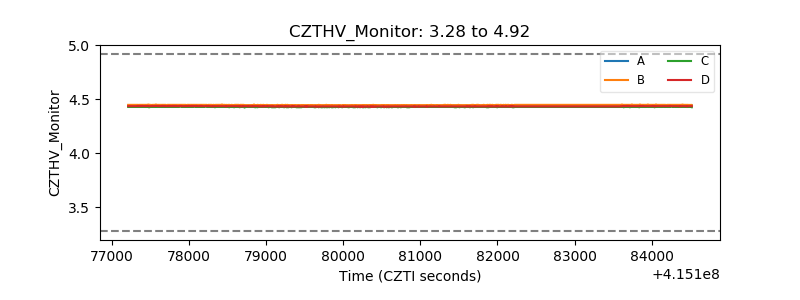 |
| D_VDD | 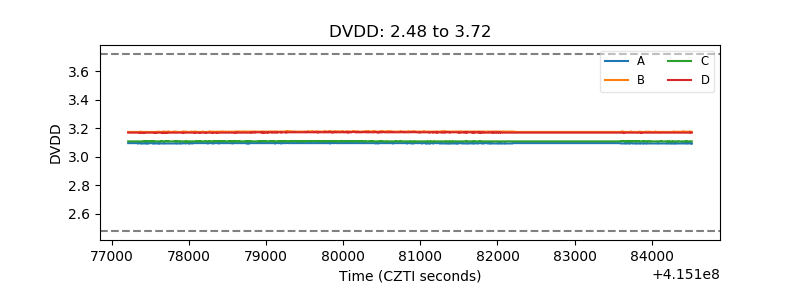 |
| Temperature 1 | 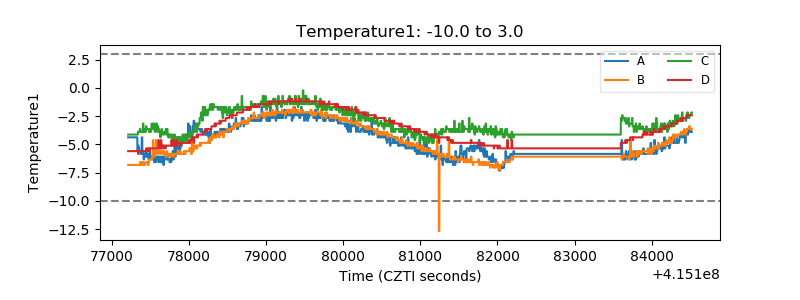 |
| Veto HV Monitor | 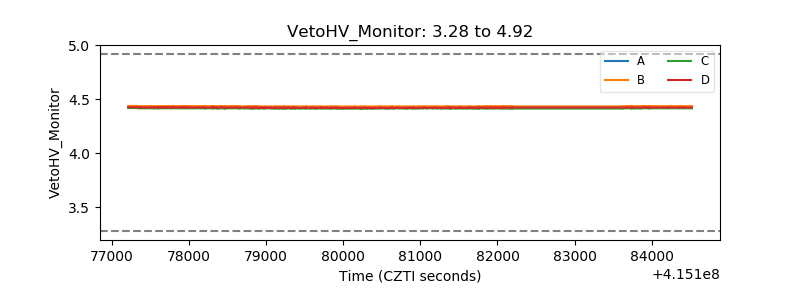 |
| Veto LLD | 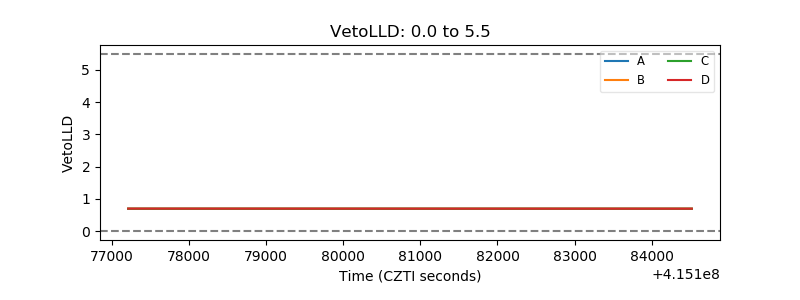 |
| Alpha Counter | 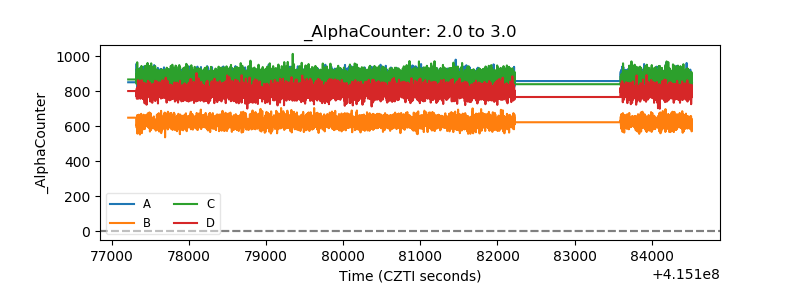 |
| _CPM_Rate | 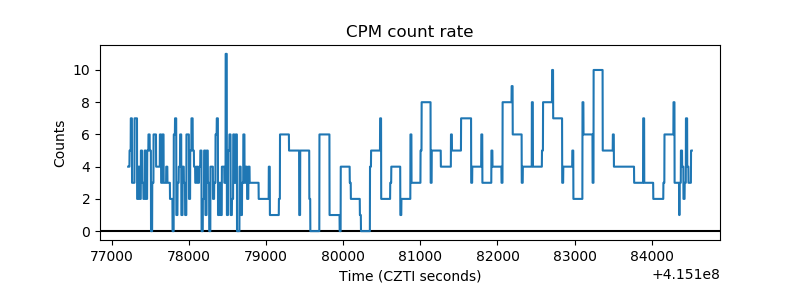 |
| CZT Counter | 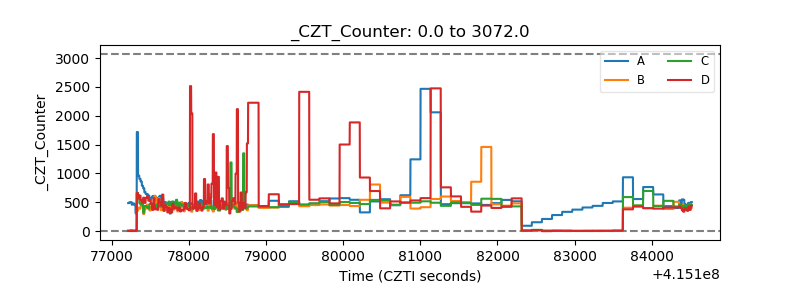 |
| +2.5 Volts monitor | 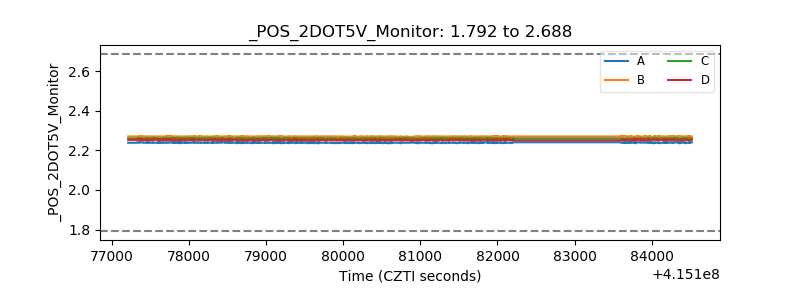 |
| +5 Volts monitor | 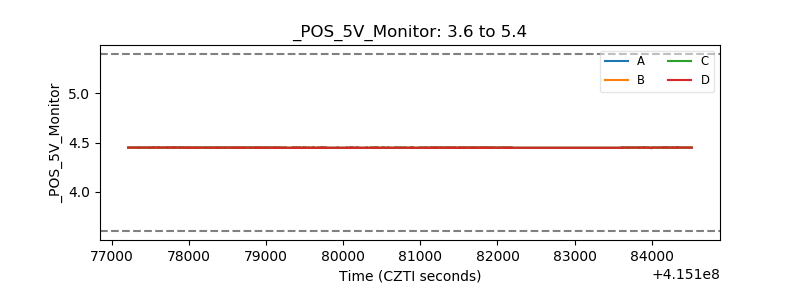 |
| _ROLL_ROT | 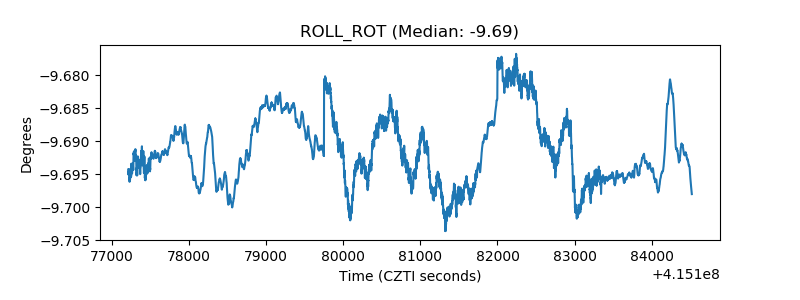 |
| _Roll_DEC | 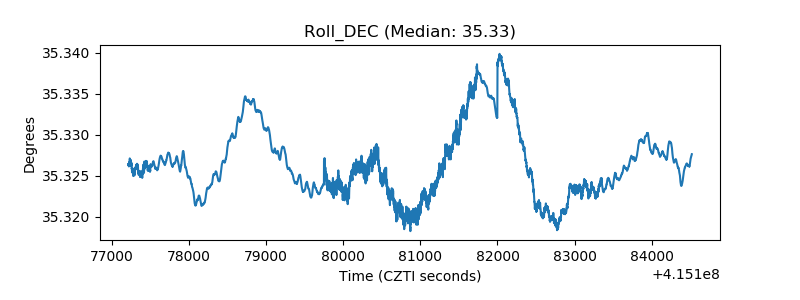 |
| _Roll_RA | 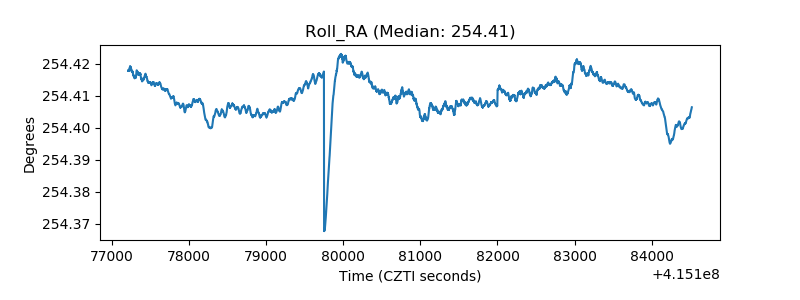 |
| Veto Counter | 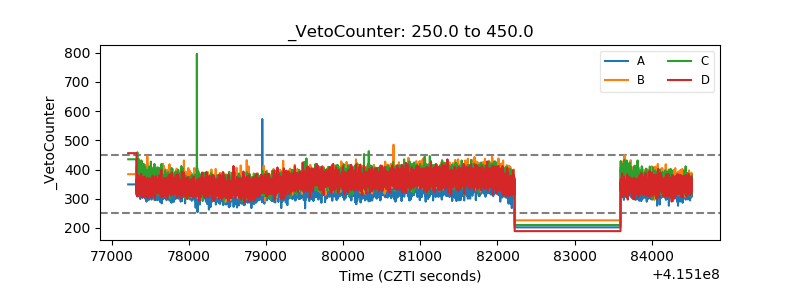 |