| Param | Original file | Final file |
|---|---|---|
| Filename | modeM0/AS1A12_004T01_9000005520_40104cztM0_level2.fits | modeM0/AS1A12_004T01_9000005520_40104cztM0_level2_quad_clean.evt |
| Size (bytes) | 352,296,000 | 95,803,200 |
| Size | 336.0 MB | 91.4 MB |
| Events in quadrant A | 3,087,940 | 640,266 |
| Events in quadrant B | 2,713,054 | 662,710 |
| Events in quadrant C | 2,840,992 | 629,334 |
| Events in quadrant D | 3,936,269 | 553,290 |
| Mode M0 | |||
|---|---|---|---|
| Quadrant | BADHDUFLAG | Total packets | Discarded packets |
| A | 0 | 12676 | 3 |
| B | 0 | 12060 | 2 |
| C | 0 | 12176 | 2 |
| D | 0 | 15872 | 2 |
| Mode M9 | |||
|---|---|---|---|
| Quadrant | BADHDUFLAG | Total packets | Discarded packets |
| A | 0 | 16 | 0 |
| B | 0 | 16 | 0 |
| C | 0 | 16 | 0 |
| D | 0 | 17 | 0 |
| Mode SS | |||
|---|---|---|---|
| Quadrant | BADHDUFLAG | Total packets | Discarded packets |
| A | 0 | 122 | 0 |
| B | 0 | 122 | 0 |
| C | 0 | 122 | 0 |
| D | 0 | 122 | 0 |
| Quadrant | Total seconds | Saturated seconds | Saturation percentage |
|---|---|---|---|
| A | 5937 | 9 | 0.151592% |
| B | 5937 | 9 | 0.151592% |
| C | 5937 | 11 | 0.185279% |
| D | 5937 | 320 | 5.389928% |
Noise dominated data is calculated using 1-second bins in cleaned event files. If a bin has >2000 counts, and if more than 50% of those come from <1% of pixels, then it is considered to be noise-dominated and hence unusable.
| Quadrant | # 1 sec bins | Bins with >0 counts | Bins with >2000 counts | High rate bins dominated by noise | Noise dominated (total time) | Noise dominated (detector-on time) | Marked lightcurve |
|---|---|---|---|---|---|---|---|
| A | 7249 | 5938 | 7 | 7 | 0.10% | 0.12% | 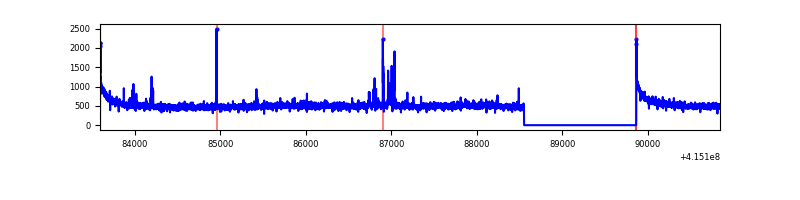 |
| B | 7249 | 5938 | 4 | 4 | 0.06% | 0.07% | 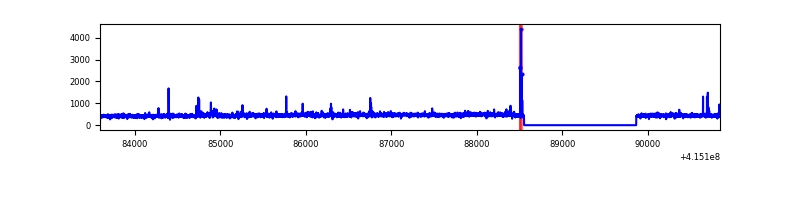 |
| C | 7249 | 5938 | 7 | 7 | 0.10% | 0.12% | 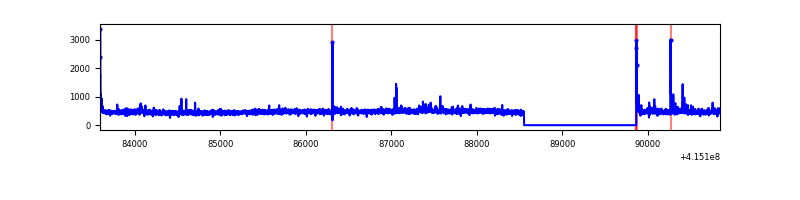 |
| D | 7249 | 5938 | 283 | 283 | 3.90% | 4.77% | 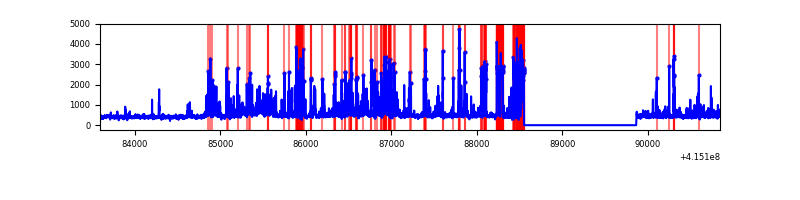 |
Top three noisy pixels from each quadrant. If the there are fewer than three noisy pixels in the level2.evt file, extra rows are filled as -1
| Pixel properties | Quadrant properties | ||||||
|---|---|---|---|---|---|---|---|
| Quadrant | DetID | PixID | Counts | Sigma | Mean | Median | Sigma |
| A | 10 | 83 | 486414 | 3652.82 | 651 | 638 | 133.0 |
| A | 15 | 223 | 38358 | 283.64 | 651 | 638 | 133.0 |
| A | 2 | 79 | 26582 | 195.09 | 651 | 638 | 133.0 |
| B | 0 | 230 | 35308 | 271.03 | 649 | 629 | 128.0 |
| B | 0 | 189 | 34347 | 263.52 | 649 | 629 | 128.0 |
| B | 4 | 171 | 30257 | 231.56 | 649 | 629 | 128.0 |
| C | 15 | 214 | 245565 | 1632.41 | 637 | 640 | 150.0 |
| C | 9 | 187 | 59872 | 394.77 | 637 | 640 | 150.0 |
| C | 0 | 10 | 32104 | 209.7 | 637 | 640 | 150.0 |
| D | 12 | 227 | 945308 | 6243.61 | 619 | 603 | 151.3 |
| D | 2 | 249 | 262279 | 1729.43 | 619 | 603 | 151.3 |
| D | 13 | 249 | 89851 | 589.85 | 619 | 603 | 151.3 |
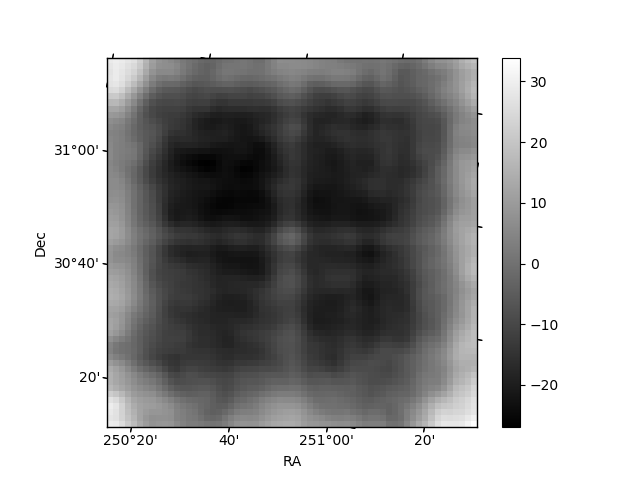
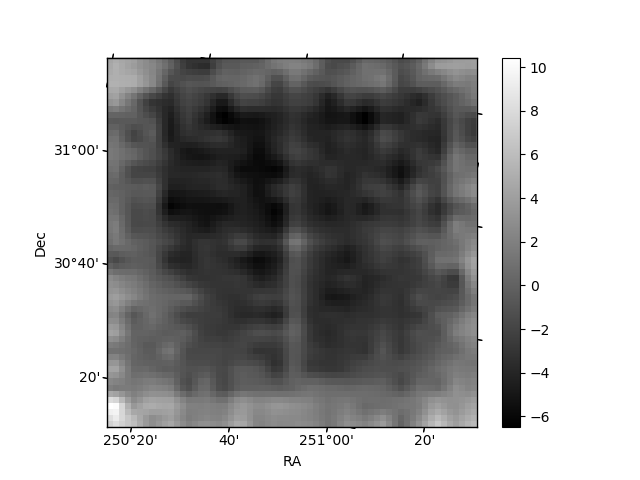
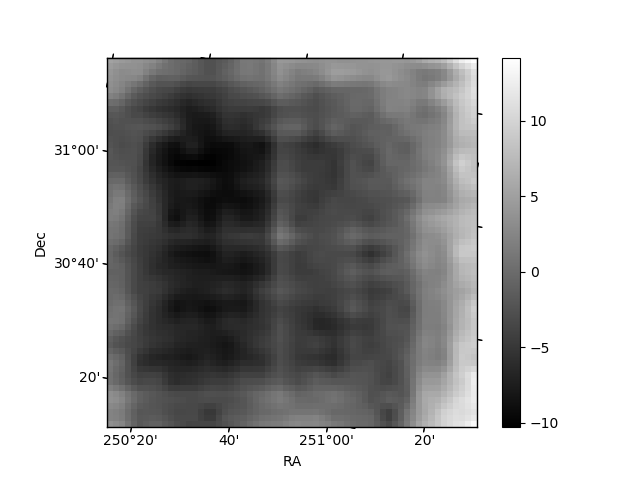
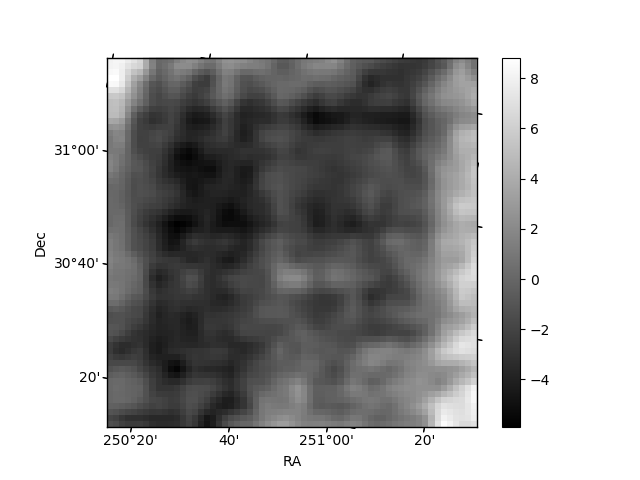
Histogram calculated using DETX and DETY for each event in the final _common_clean file
| Quadrant A | 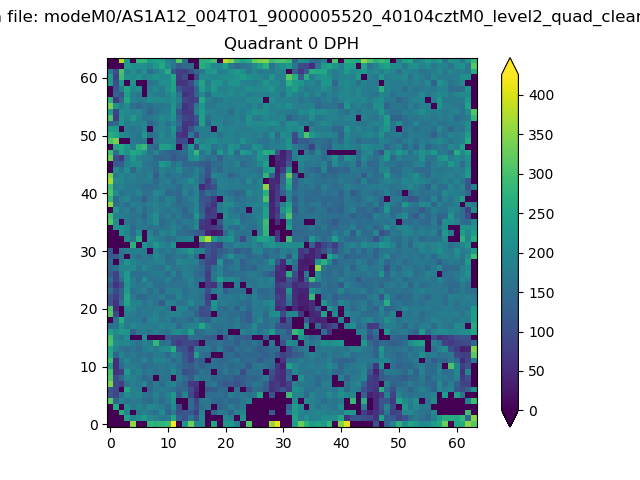 |
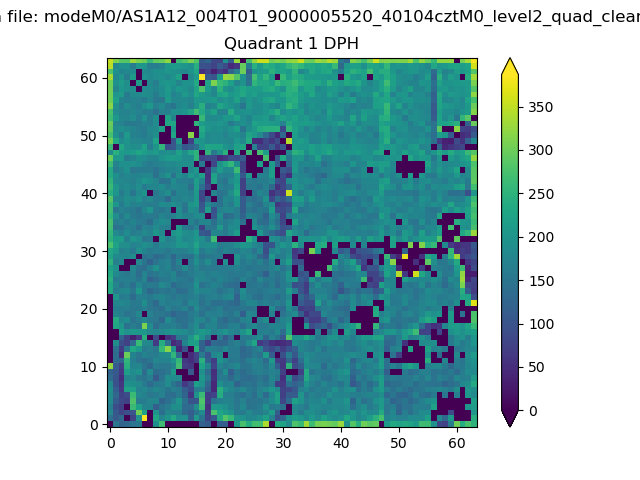 |
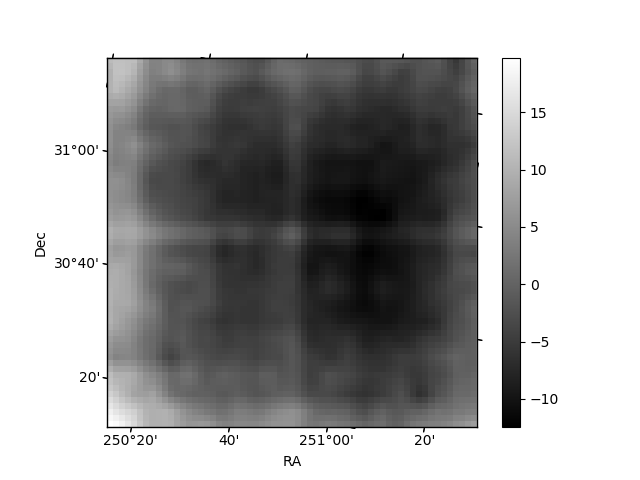
Quadrant B |
|---|---|---|---|
| Quadrant D | 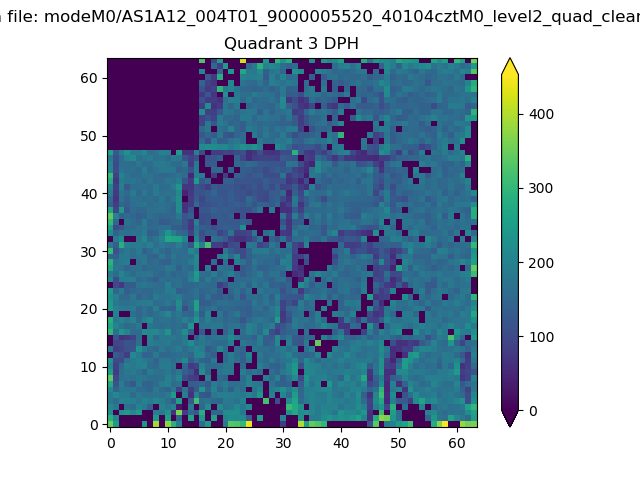 |
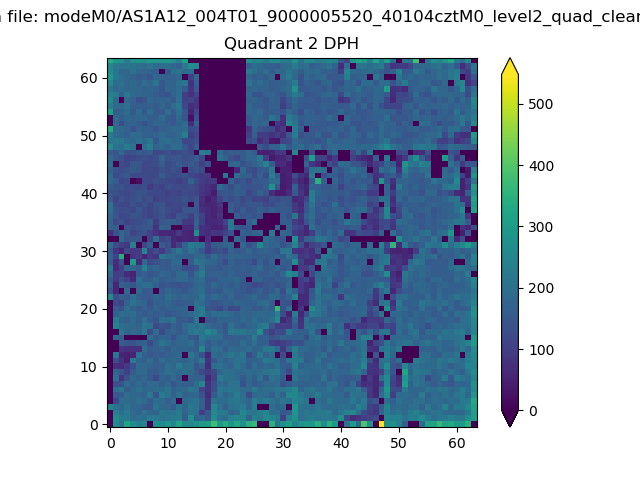 |
Quadrant C |
| Plot type | Count rate plots | Images |
|---|---|---|
| Comparison with Poisson distribution Blue bars denote a histogram of data divided into 1 sec bins. Red curve is a Poisson curve with rate = median count rate of data. |
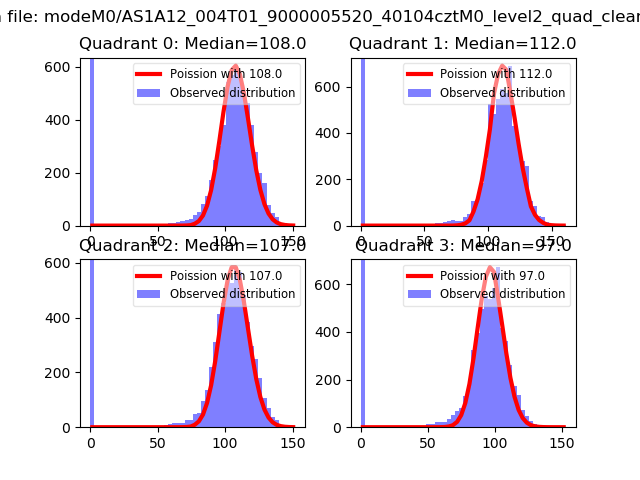 |
 |
| Quadrant-wise count rates Data is divided into 100 sec bins |
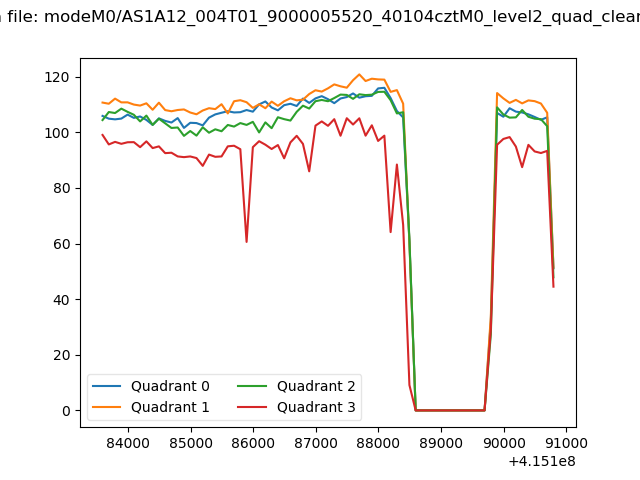 |
|
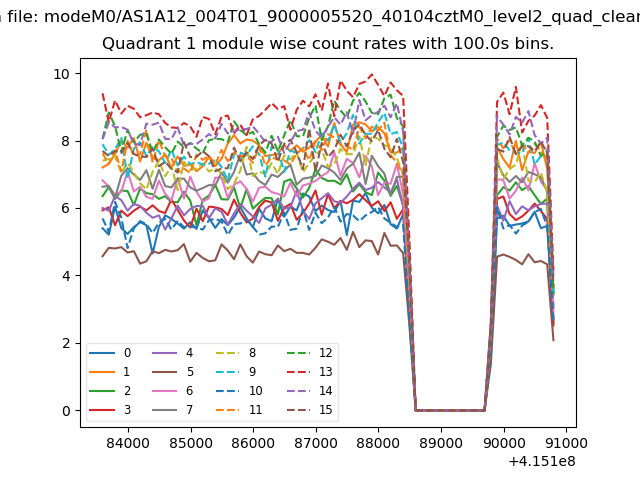
| Module-wise count rates for Quadrant A Data is divided into 100 sec bins |
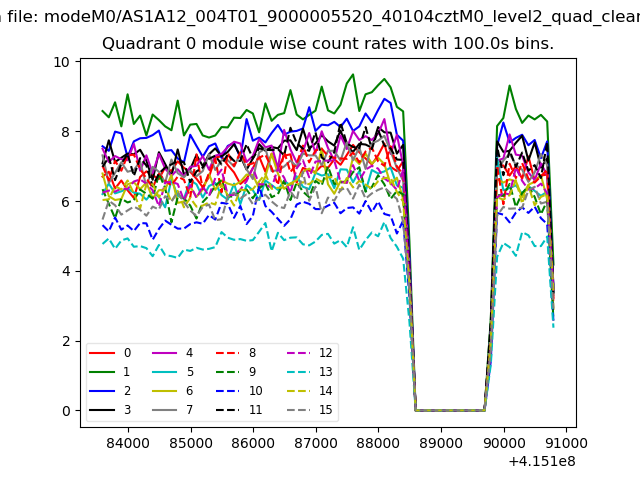 |
 |
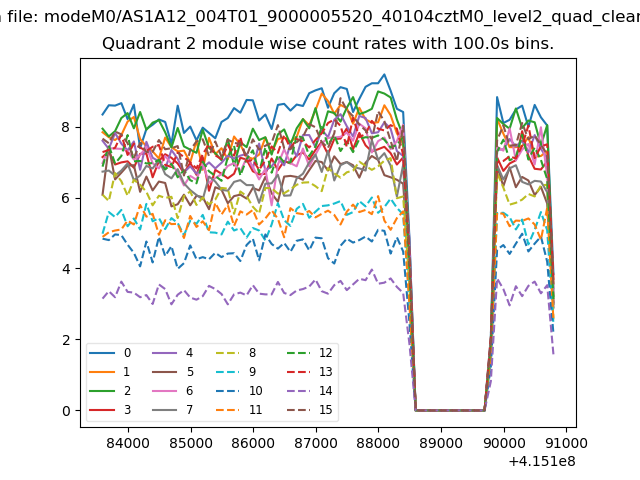
| Module-wise count rates for Quadrant B Data is divided into 100 sec bins |
 |
 |
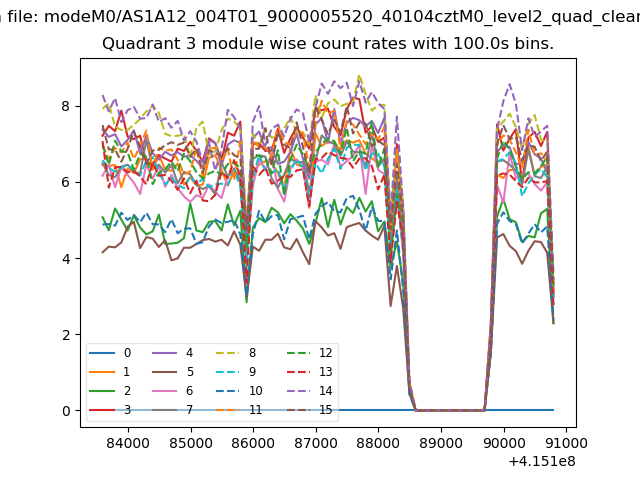
| Module-wise count rates for Quadrant C Data is divided into 100 sec bins |
 |
 |
| Module-wise count rates for Quadrant D Data is divided into 100 sec bins |
 |
 |
| Parameter | Plot |
|---|---|
| CZT HV Monitor | 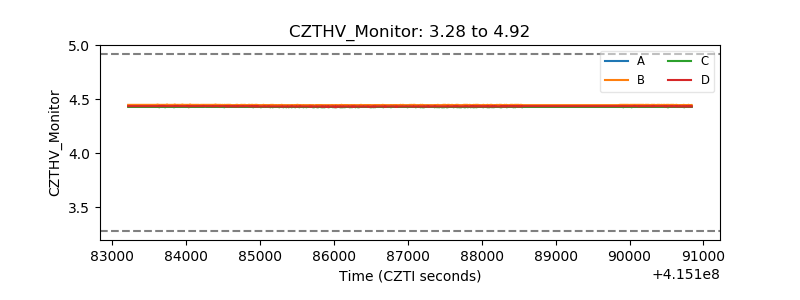 |
| D_VDD | 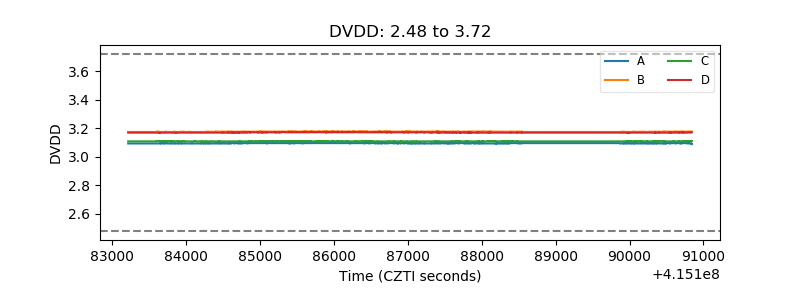 |
| Temperature 1 | 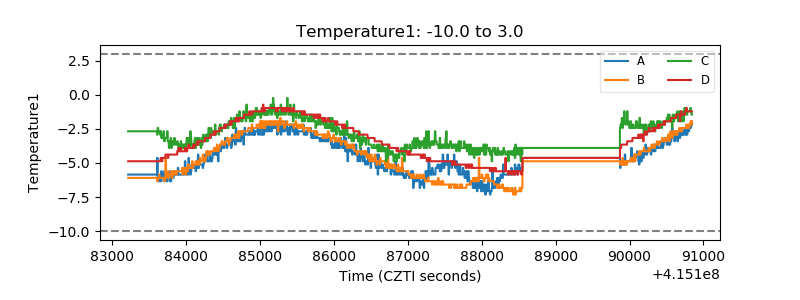 |
| Veto HV Monitor | 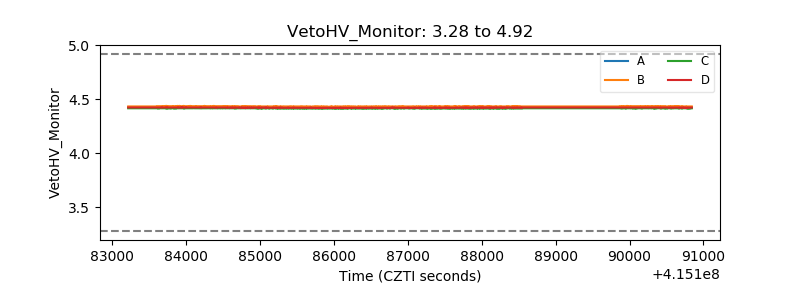 |
| Veto LLD | 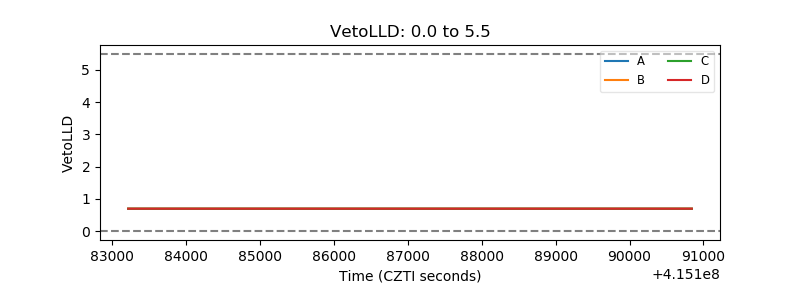 |
| Alpha Counter | 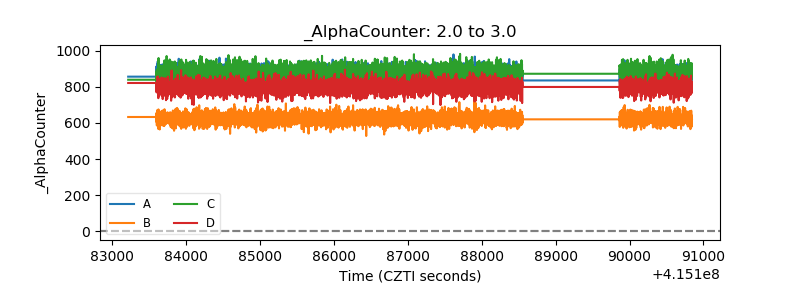 |
| _CPM_Rate | 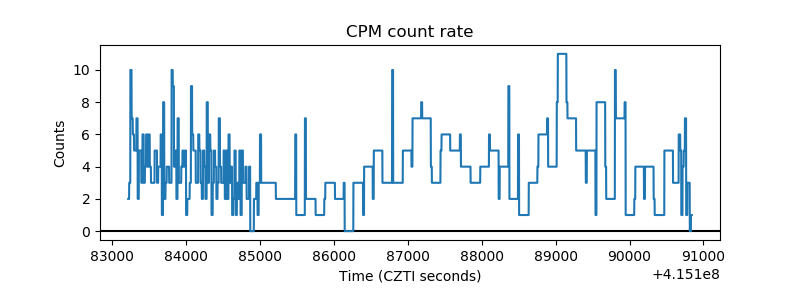 |
| CZT Counter | 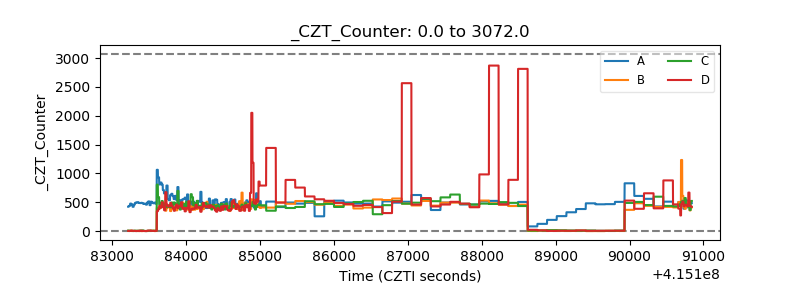 |
| +2.5 Volts monitor | 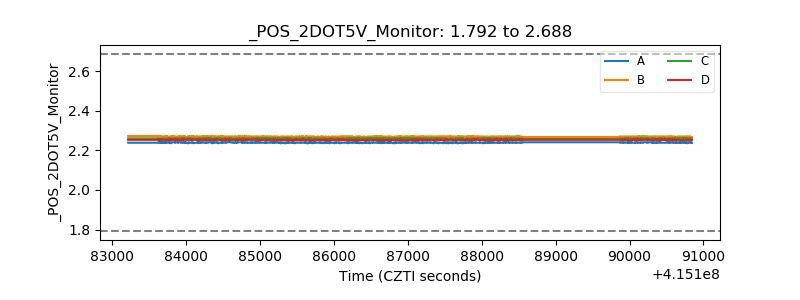 |
| +5 Volts monitor | 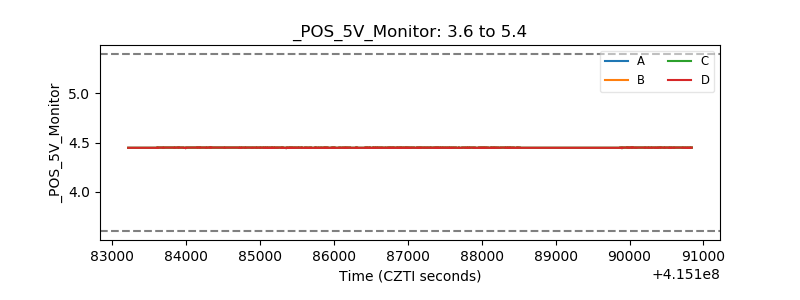 |
| _ROLL_ROT | 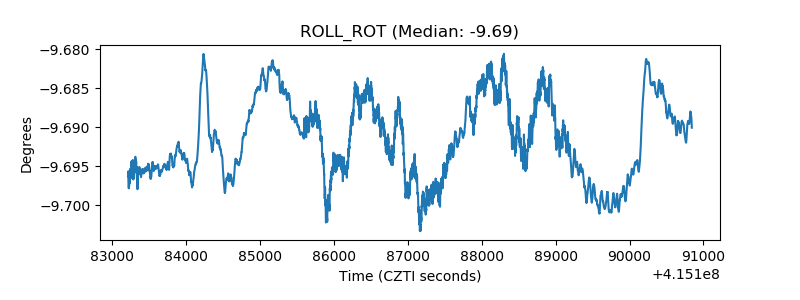 |
| _Roll_DEC | 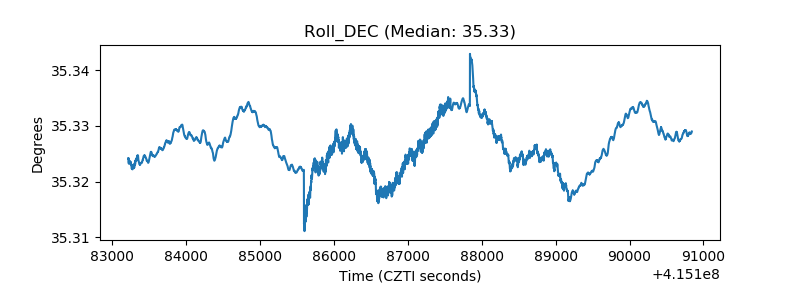 |
| _Roll_RA | 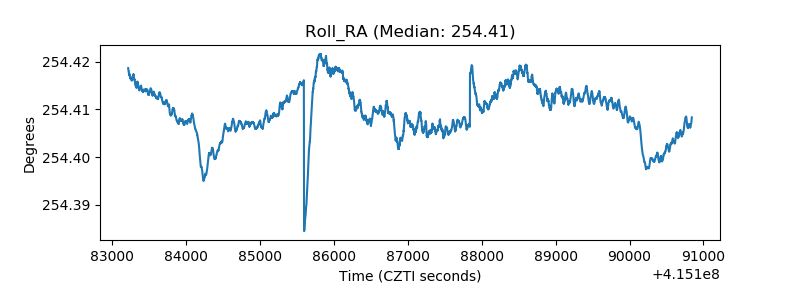 |
| Veto Counter | 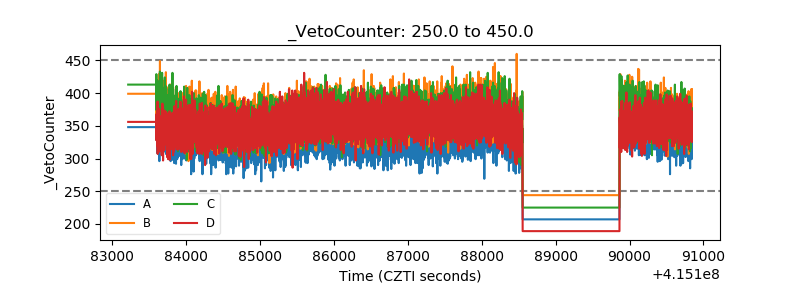 |