| Param | Original file | Final file |
|---|---|---|
| Filename | modeM0/AS1A12_004T01_9000005520_40107cztM0_level2.fits | modeM0/AS1A12_004T01_9000005520_40107cztM0_level2_quad_clean.evt |
| Size (bytes) | 1,107,927,360 | 242,282,880 |
| Size | 1.0 GB | 231.1 MB |
| Events in quadrant A | 8,459,202 | 1,655,644 |
| Events in quadrant B | 7,399,194 | 1,698,747 |
| Events in quadrant C | 10,602,944 | 1,574,318 |
| Events in quadrant D | 13,353,985 | 1,339,521 |
| Mode M0 | |||
|---|---|---|---|
| Quadrant | BADHDUFLAG | Total packets | Discarded packets |
| A | 0 | 34637 | 5 |
| B | 0 | 32289 | 4 |
| C | 0 | 41485 | 4 |
| D | 0 | 50449 | 4 |
| Mode M9 | |||
|---|---|---|---|
| Quadrant | BADHDUFLAG | Total packets | Discarded packets |
| A | 0 | 49 | 0 |
| B | 0 | 49 | 0 |
| C | 0 | 49 | 0 |
| D | 0 | 50 | 0 |
| Mode SS | |||
|---|---|---|---|
| Quadrant | BADHDUFLAG | Total packets | Discarded packets |
| A | 0 | 316 | 0 |
| B | 0 | 316 | 0 |
| C | 0 | 316 | 0 |
| D | 0 | 316 | 0 |
| Quadrant | Total seconds | Saturated seconds | Saturation percentage |
|---|---|---|---|
| A | 15465 | 119 | 0.769479% |
| B | 15465 | 37 | 0.239250% |
| C | 15465 | 507 | 3.278371% |
| D | 15465 | 1691 | 10.934368% |
Noise dominated data is calculated using 1-second bins in cleaned event files. If a bin has >2000 counts, and if more than 50% of those come from <1% of pixels, then it is considered to be noise-dominated and hence unusable.
| Quadrant | # 1 sec bins | Bins with >0 counts | Bins with >2000 counts | High rate bins dominated by noise | Noise dominated (total time) | Noise dominated (detector-on time) | Marked lightcurve |
|---|---|---|---|---|---|---|---|
| A | 19792 | 15468 | 87 | 87 | 0.44% | 0.56% | 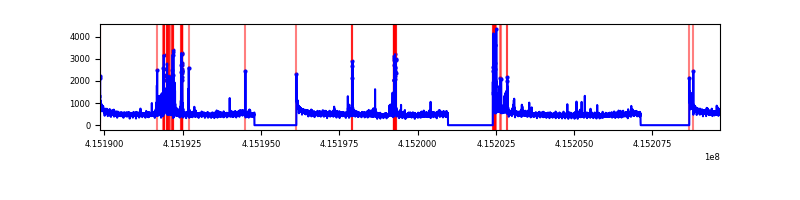 |
| B | 19792 | 15468 | 21 | 21 | 0.11% | 0.14% | 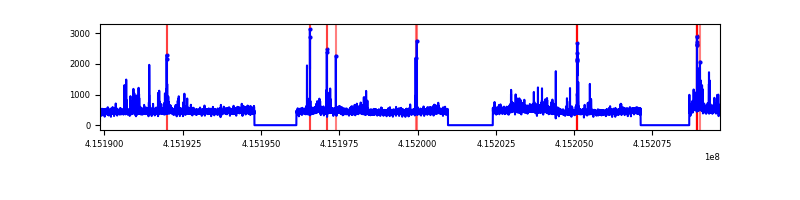 |
| C | 19792 | 15468 | 473 | 473 | 2.39% | 3.06% | 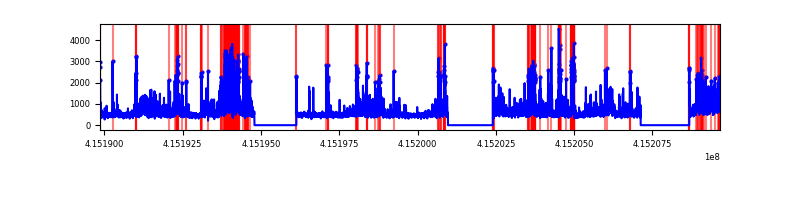 |
| D | 19792 | 15468 | 1580 | 1580 | 7.98% | 10.21% | 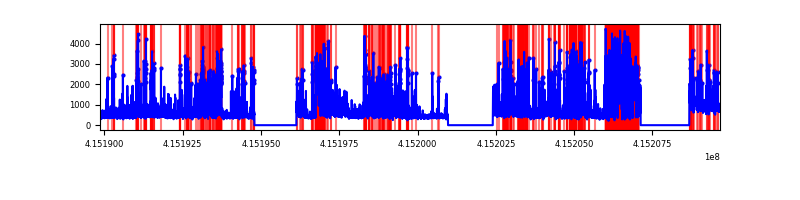 |
Top three noisy pixels from each quadrant. If the there are fewer than three noisy pixels in the level2.evt file, extra rows are filled as -1
| Pixel properties | Quadrant properties | ||||||
|---|---|---|---|---|---|---|---|
| Quadrant | DetID | PixID | Counts | Sigma | Mean | Median | Sigma |
| A | 10 | 83 | 1187595 | 3448.99 | 1694 | 1659 | 343.9 |
| A | 13 | 248 | 308591 | 892.63 | 1694 | 1659 | 343.9 |
| A | 9 | 143 | 158018 | 454.73 | 1694 | 1659 | 343.9 |
| B | 0 | 189 | 439097 | 1328.91 | 1690 | 1640 | 329.2 |
| B | 4 | 171 | 119510 | 358.07 | 1690 | 1640 | 329.2 |
| B | 0 | 230 | 85749 | 255.51 | 1690 | 1640 | 329.2 |
| C | 9 | 187 | 3419513 | 8891.7 | 1645 | 1655 | 384.4 |
| C | 15 | 214 | 625194 | 1622.16 | 1645 | 1655 | 384.4 |
| C | 0 | 10 | 55151 | 139.17 | 1645 | 1655 | 384.4 |
| D | 12 | 227 | 4306414 | 11287.23 | 1556 | 1512 | 381.4 |
| D | 2 | 250 | 1482368 | 3882.73 | 1556 | 1512 | 381.4 |
| D | 13 | 249 | 596125 | 1559.04 | 1556 | 1512 | 381.4 |
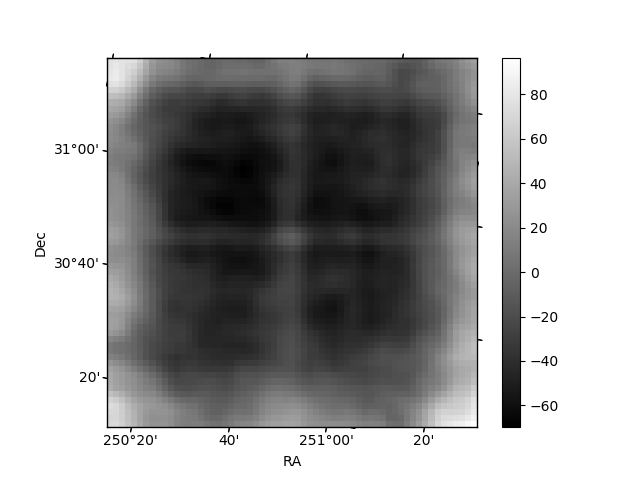
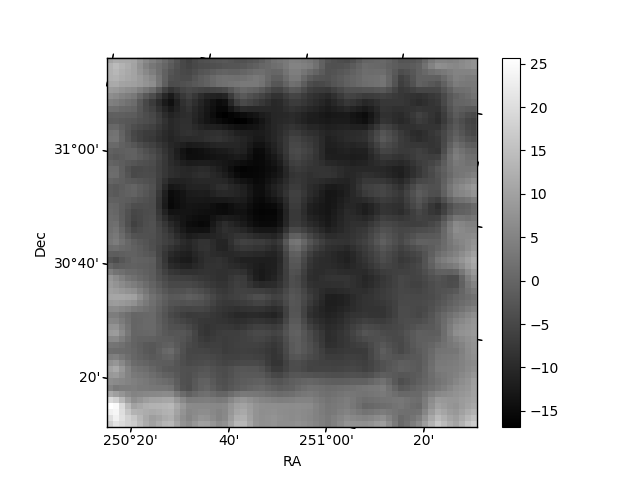
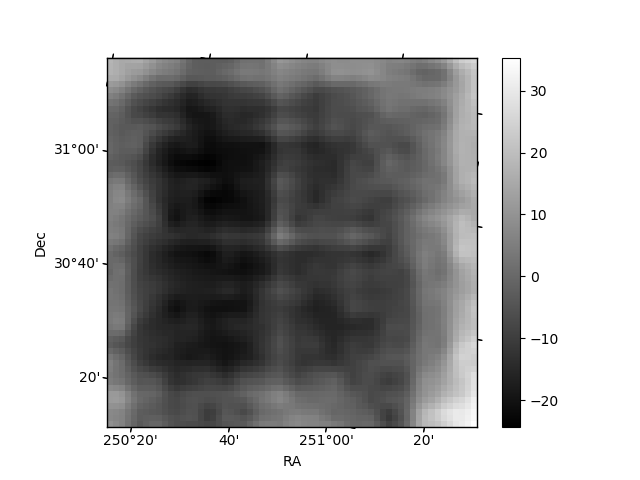
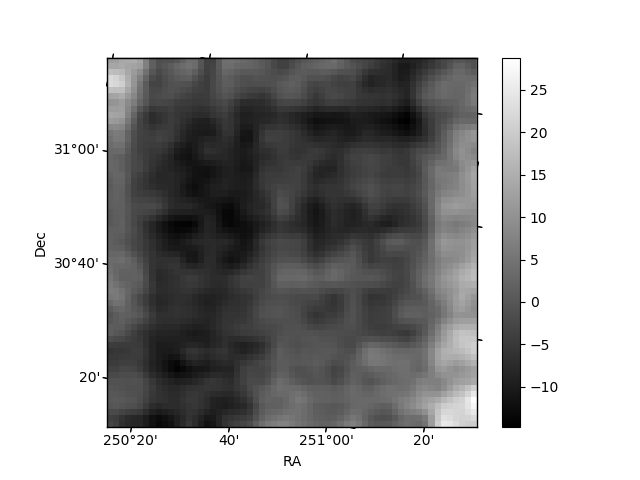
Histogram calculated using DETX and DETY for each event in the final _common_clean file
| Quadrant A | 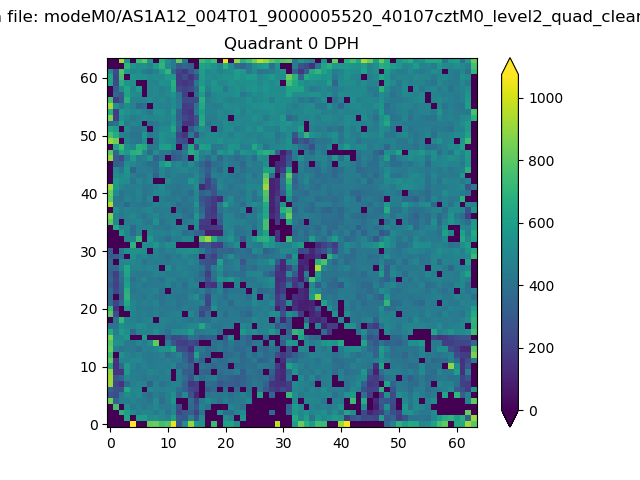 |
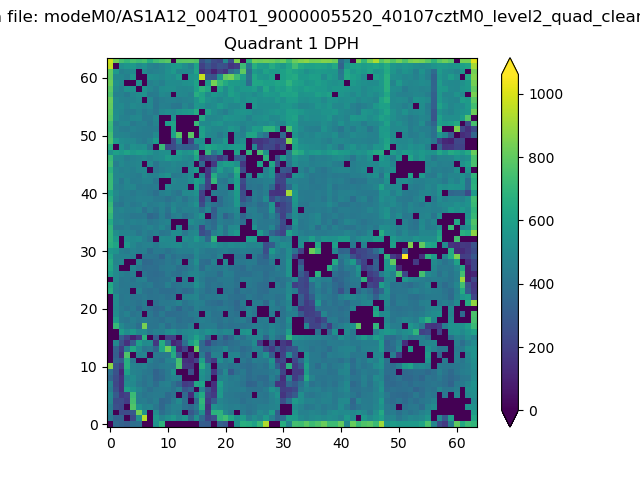 |
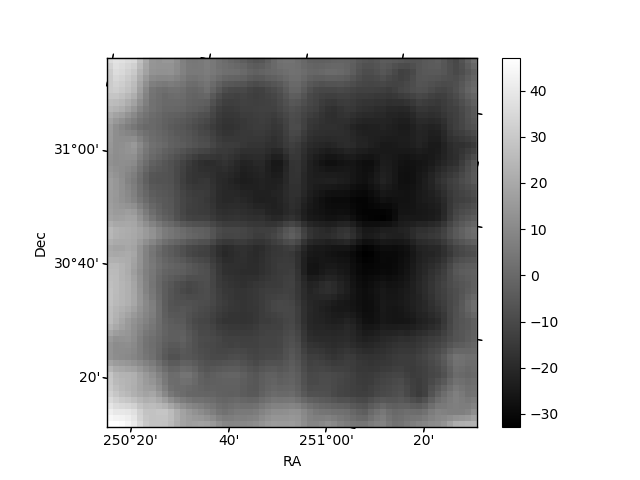
Quadrant B |
|---|---|---|---|
| Quadrant D | 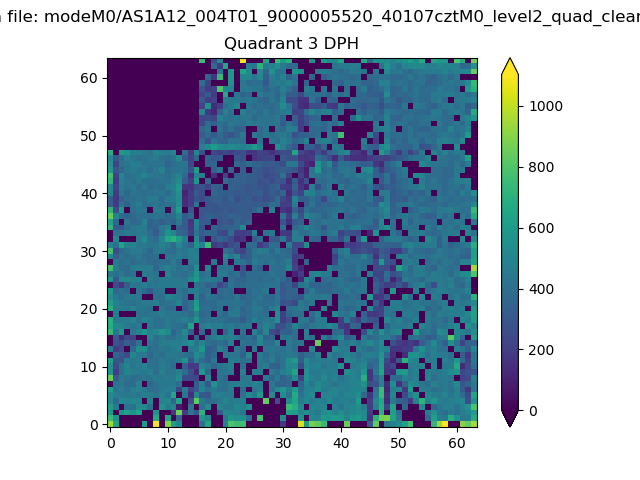 |
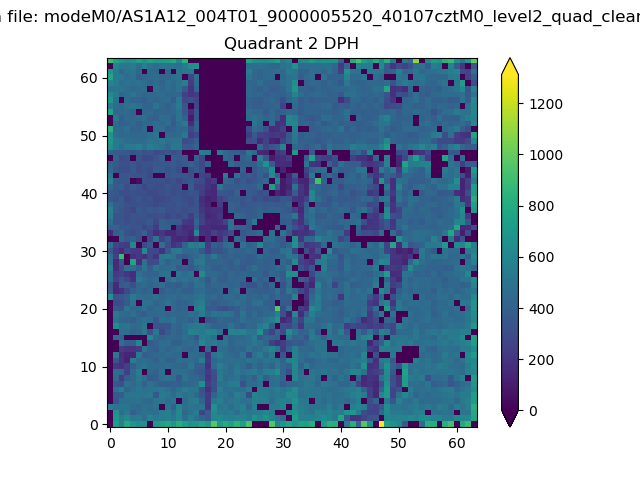 |
Quadrant C |
| Plot type | Count rate plots | Images |
|---|---|---|
| Comparison with Poisson distribution Blue bars denote a histogram of data divided into 1 sec bins. Red curve is a Poisson curve with rate = median count rate of data. |
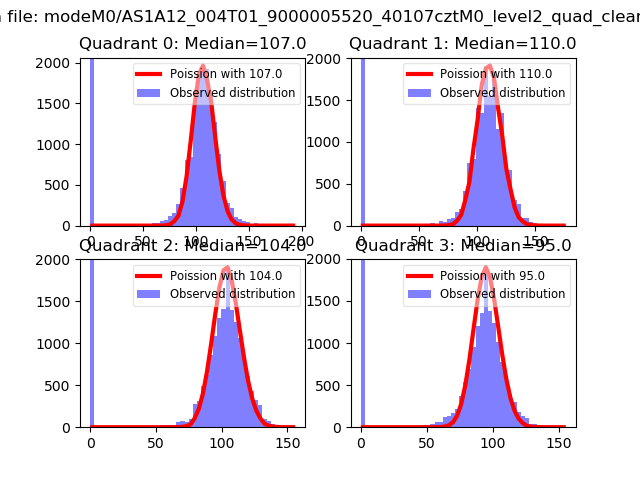 |
 |
| Quadrant-wise count rates Data is divided into 100 sec bins |
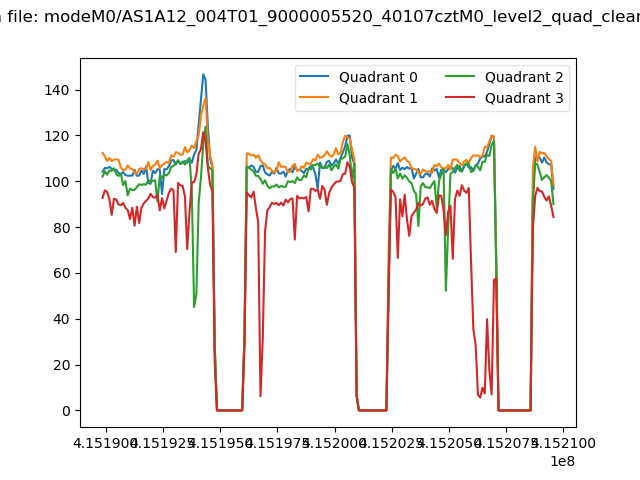 |
|
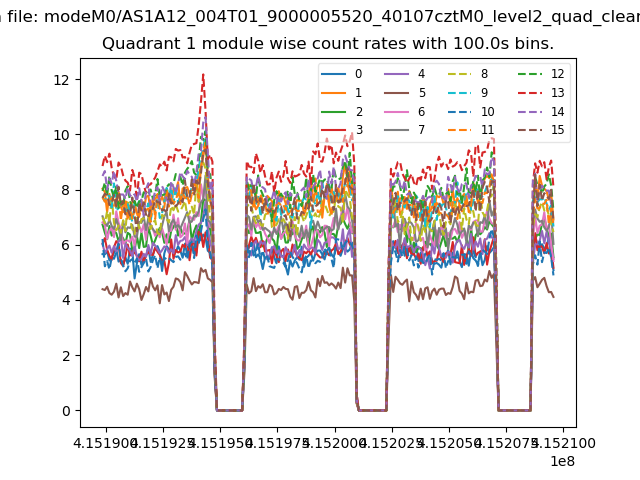
| Module-wise count rates for Quadrant A Data is divided into 100 sec bins |
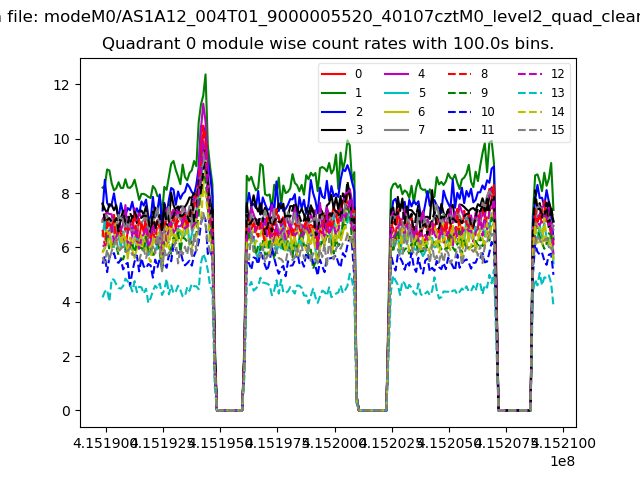 |
 |
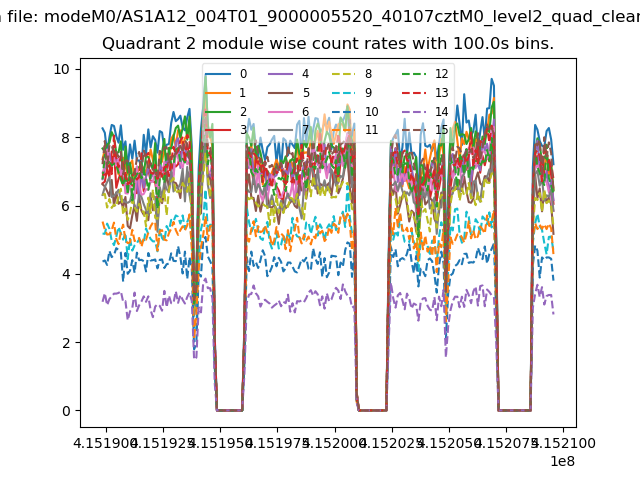
| Module-wise count rates for Quadrant B Data is divided into 100 sec bins |
 |
 |
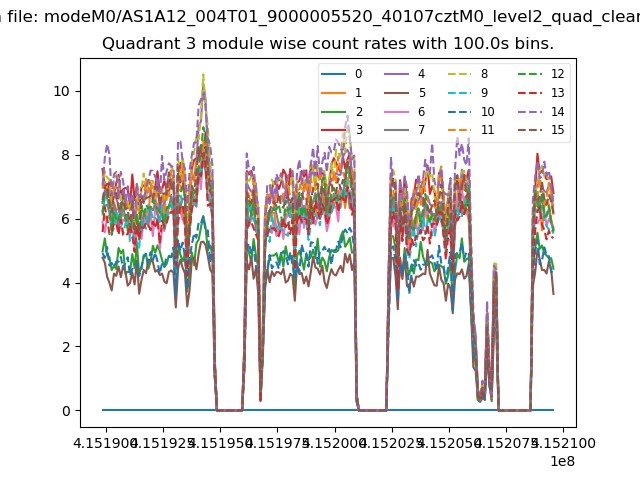
| Module-wise count rates for Quadrant C Data is divided into 100 sec bins |
 |
 |
| Module-wise count rates for Quadrant D Data is divided into 100 sec bins |
 |
 |
| Parameter | Plot |
|---|---|
| CZT HV Monitor | 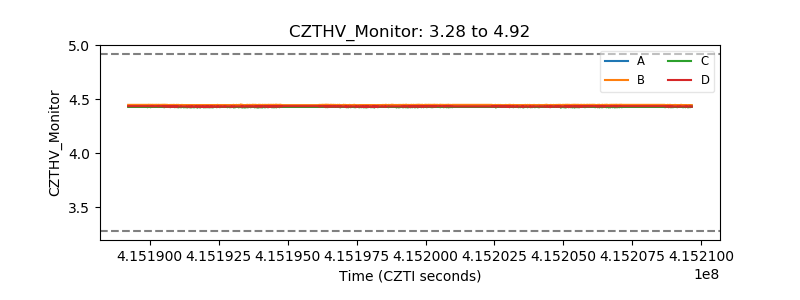 |
| D_VDD | 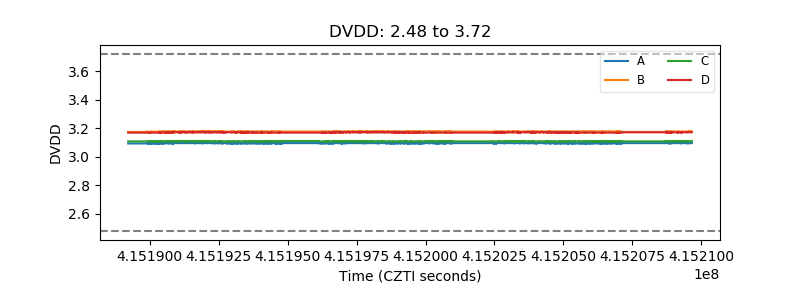 |
| Temperature 1 | 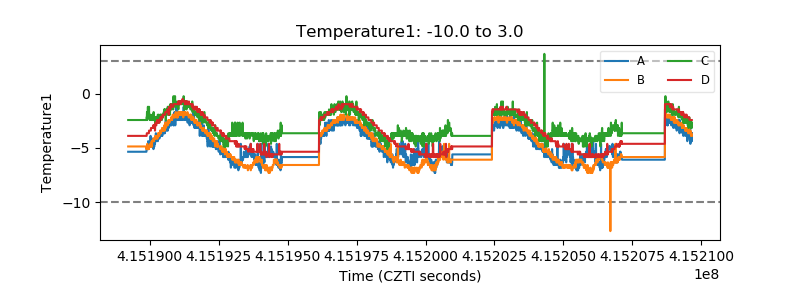 |
| Veto HV Monitor | 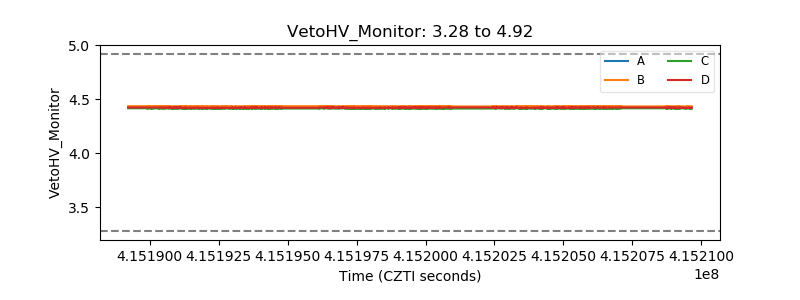 |
| Veto LLD | 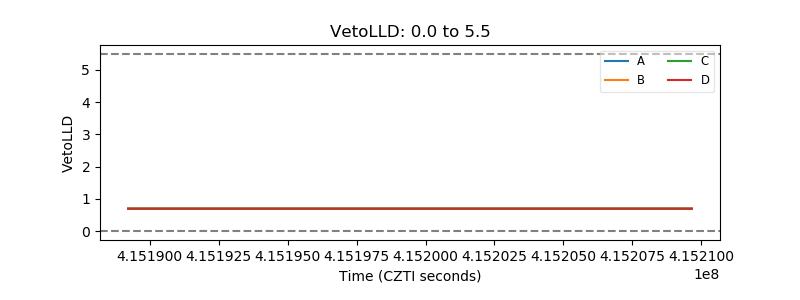 |
| Alpha Counter | 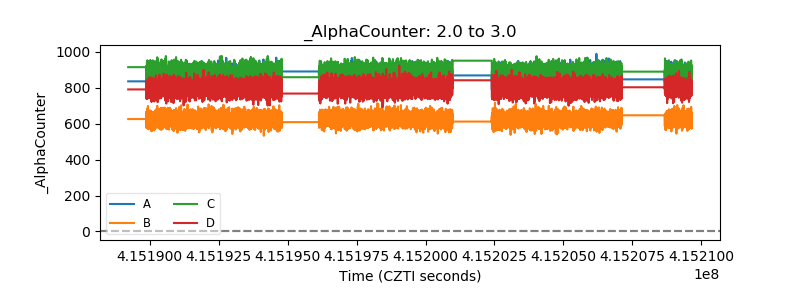 |
| _CPM_Rate | 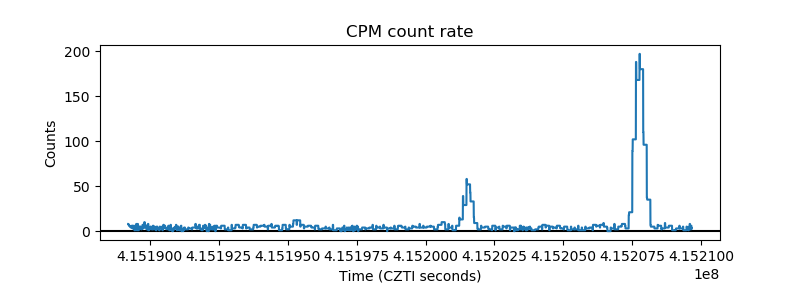 |
| CZT Counter | 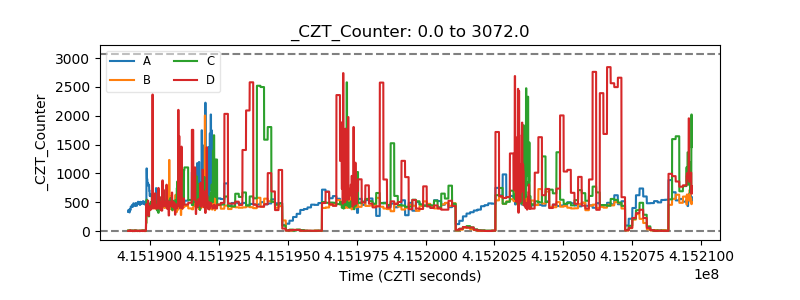 |
| +2.5 Volts monitor | 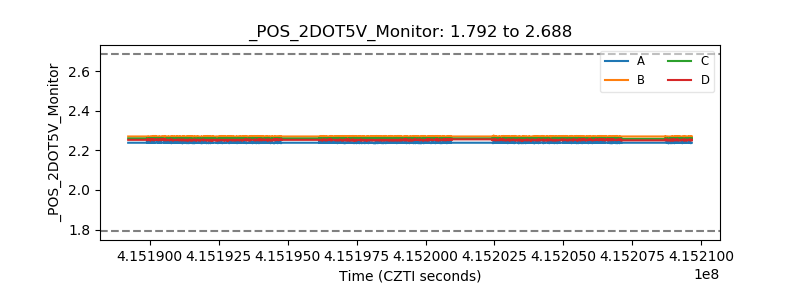 |
| +5 Volts monitor | 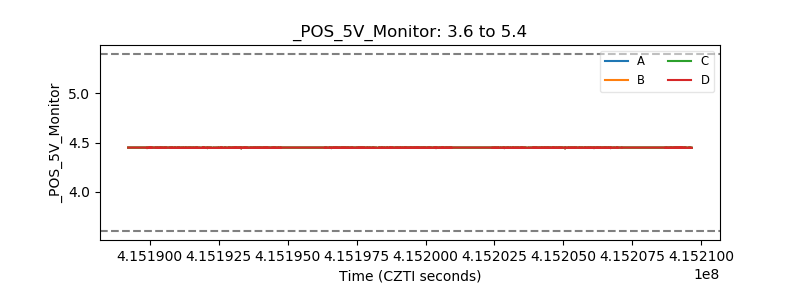 |
| _ROLL_ROT | 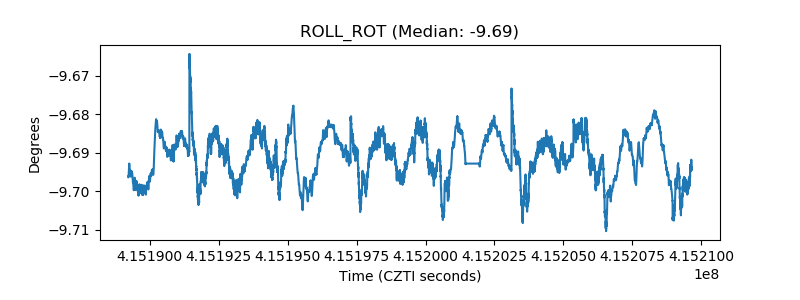 |
| _Roll_DEC | 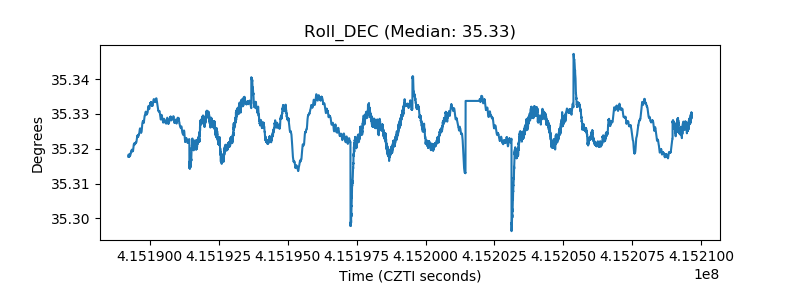 |
| _Roll_RA | 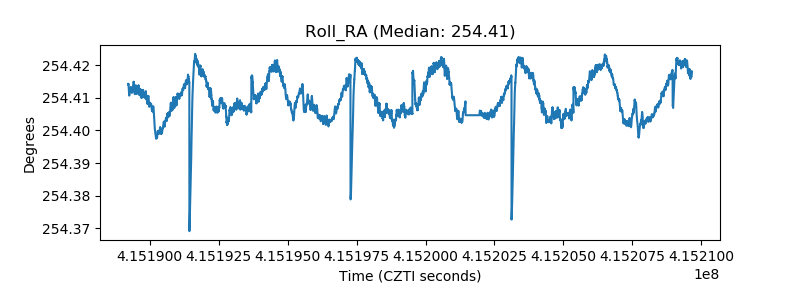 |
| Veto Counter | 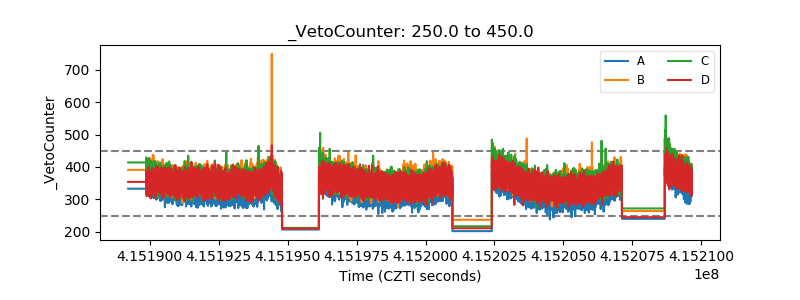 |