| Param | Original file | Final file |
|---|---|---|
| Filename | modeM0/AS1A12_004T01_9000005520_40108cztM0_level2.fits | modeM0/AS1A12_004T01_9000005520_40108cztM0_level2_quad_clean.evt |
| Size (bytes) | 455,290,560 | 91,408,320 |
| Size | 434.2 MB | 87.2 MB |
| Events in quadrant A | 4,351,501 | 596,669 |
| Events in quadrant B | 2,733,313 | 636,712 |
| Events in quadrant C | 4,901,157 | 594,976 |
| Events in quadrant D | 4,440,861 | 555,256 |
| Mode M0 | |||
|---|---|---|---|
| Quadrant | BADHDUFLAG | Total packets | Discarded packets |
| A | 0 | 16840 | 2 |
| B | 0 | 11862 | 1 |
| C | 0 | 18414 | 1 |
| D | 0 | 17037 | 1 |
| Mode M9 | |||
|---|---|---|---|
| Quadrant | BADHDUFLAG | Total packets | Discarded packets |
| A | 0 | 28 | 0 |
| B | 0 | 28 | 0 |
| C | 0 | 28 | 0 |
| D | 0 | 29 | 0 |
| Mode SS | |||
|---|---|---|---|
| Quadrant | BADHDUFLAG | Total packets | Discarded packets |
| A | 0 | 110 | 0 |
| B | 0 | 110 | 0 |
| C | 0 | 110 | 0 |
| D | 0 | 110 | 0 |
| Quadrant | Total seconds | Saturated seconds | Saturation percentage |
|---|---|---|---|
| A | 5495 | 367 | 6.678799% |
| B | 5495 | 26 | 0.473157% |
| C | 5495 | 287 | 5.222930% |
| D | 5495 | 312 | 5.677889% |
Noise dominated data is calculated using 1-second bins in cleaned event files. If a bin has >2000 counts, and if more than 50% of those come from <1% of pixels, then it is considered to be noise-dominated and hence unusable.
| Quadrant | # 1 sec bins | Bins with >0 counts | Bins with >2000 counts | High rate bins dominated by noise | Noise dominated (total time) | Noise dominated (detector-on time) | Marked lightcurve |
|---|---|---|---|---|---|---|---|
| A | 7137 | 5496 | 272 | 272 | 3.81% | 4.95% | 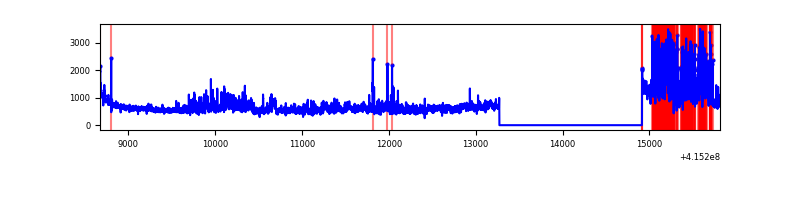 |
| B | 7137 | 5496 | 14 | 14 | 0.20% | 0.25% | 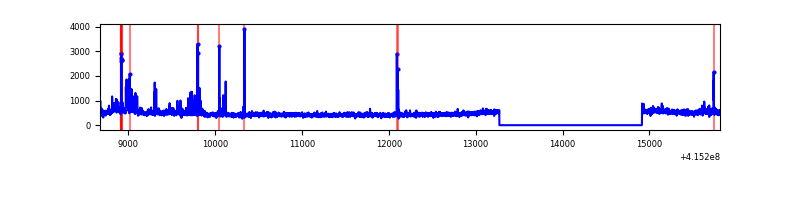 |
| C | 7137 | 5496 | 269 | 269 | 3.77% | 4.89% | 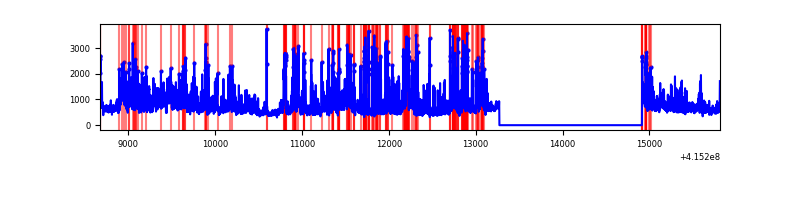 |
| D | 7137 | 5496 | 268 | 268 | 3.76% | 4.88% | 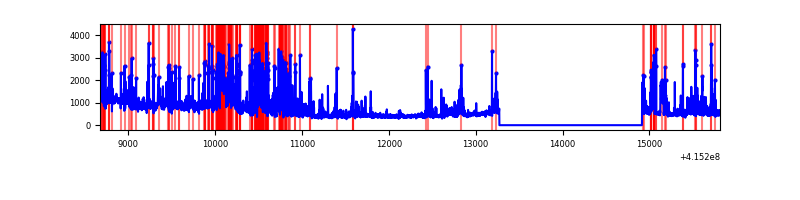 |
Top three noisy pixels from each quadrant. If the there are fewer than three noisy pixels in the level2.evt file, extra rows are filled as -1
| Pixel properties | Quadrant properties | ||||||
|---|---|---|---|---|---|---|---|
| Quadrant | DetID | PixID | Counts | Sigma | Mean | Median | Sigma |
| A | 6 | 10 | 747628 | 6133.73 | 595 | 585 | 121.8 |
| A | 13 | 248 | 660705 | 5420.04 | 595 | 585 | 121.8 |
| A | 10 | 83 | 464569 | 3809.62 | 595 | 585 | 121.8 |
| B | 0 | 189 | 194426 | 1624.1 | 607 | 589 | 119.4 |
| B | 4 | 171 | 76263 | 634.05 | 607 | 589 | 119.4 |
| B | 5 | 32 | 36193 | 298.31 | 607 | 589 | 119.4 |
| C | 9 | 187 | 1981706 | 14398.19 | 589 | 593 | 137.6 |
| C | 15 | 214 | 225867 | 1637.23 | 589 | 593 | 137.6 |
| C | 10 | 20 | 183432 | 1328.82 | 589 | 593 | 137.6 |
| D | 12 | 227 | 1609557 | 11160.86 | 587 | 569 | 144.2 |
| D | 13 | 249 | 256026 | 1772.0 | 587 | 569 | 144.2 |
| D | 2 | 249 | 154167 | 1065.44 | 587 | 569 | 144.2 |
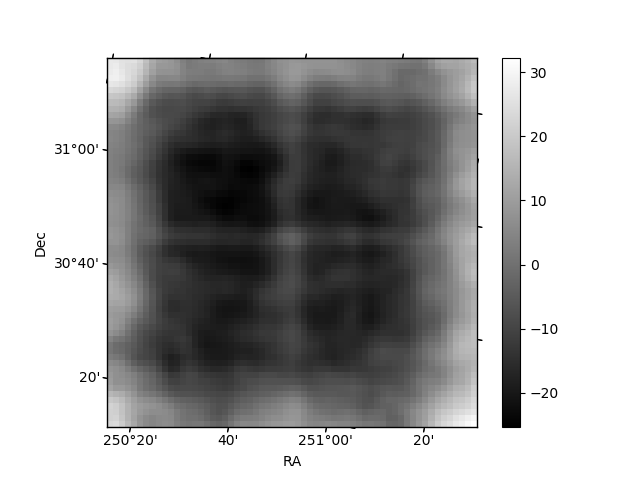
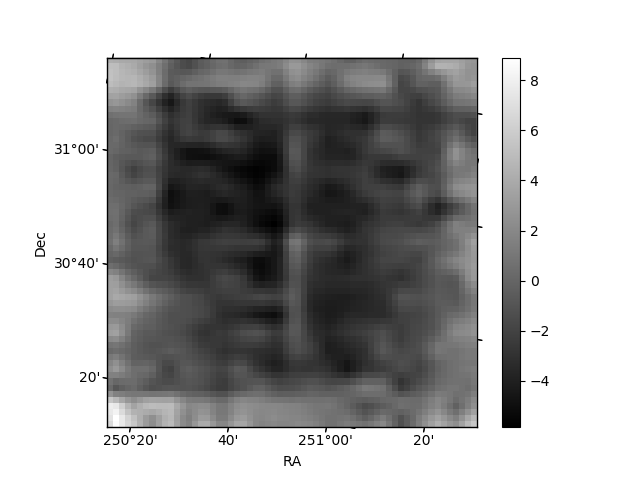
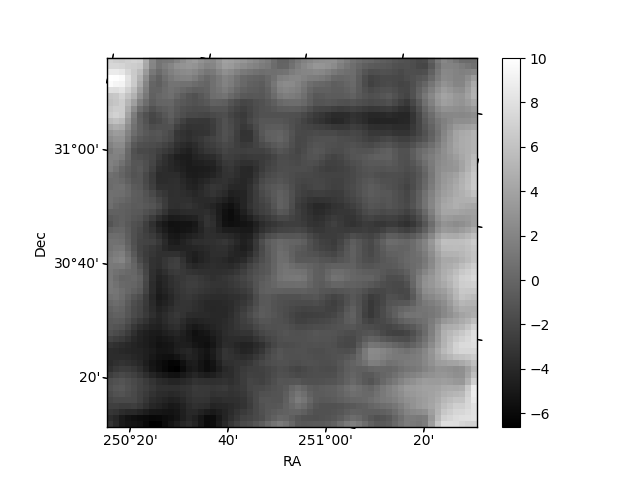
Histogram calculated using DETX and DETY for each event in the final _common_clean file
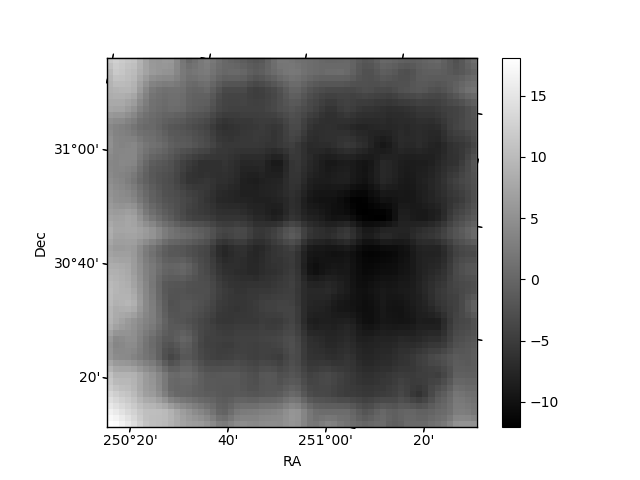
| Quadrant A | 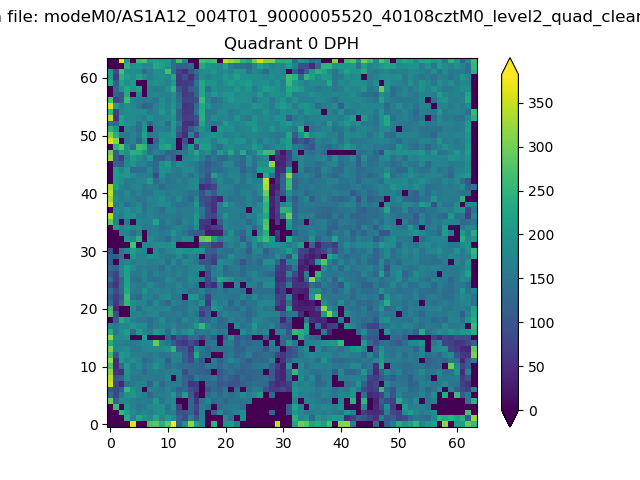 |
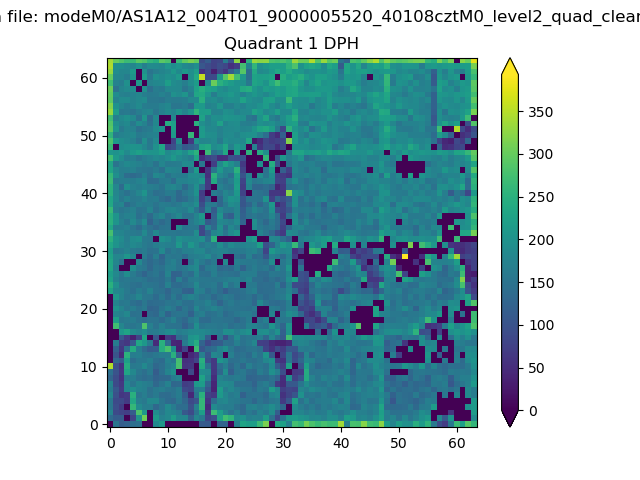 |
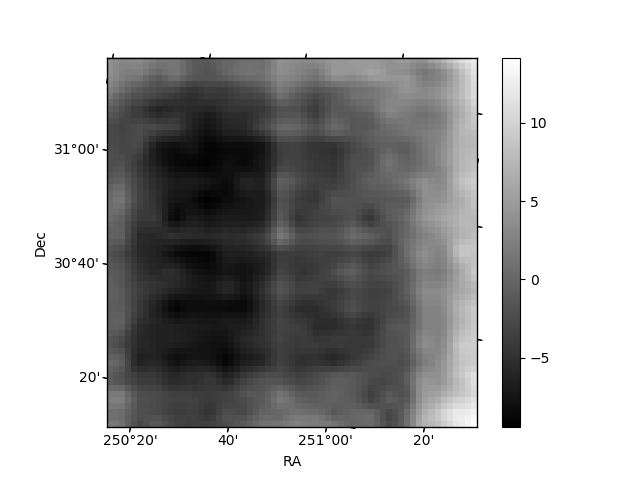
Quadrant B |
|---|---|---|---|
| Quadrant D | 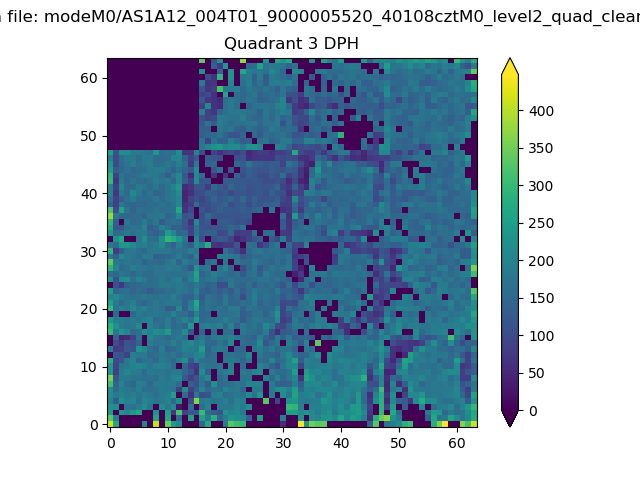 |
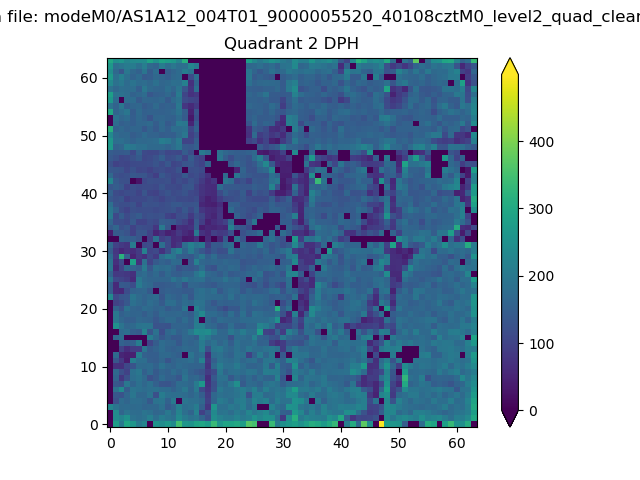 |
Quadrant C |
| Plot type | Count rate plots | Images |
|---|---|---|
| Comparison with Poisson distribution Blue bars denote a histogram of data divided into 1 sec bins. Red curve is a Poisson curve with rate = median count rate of data. |
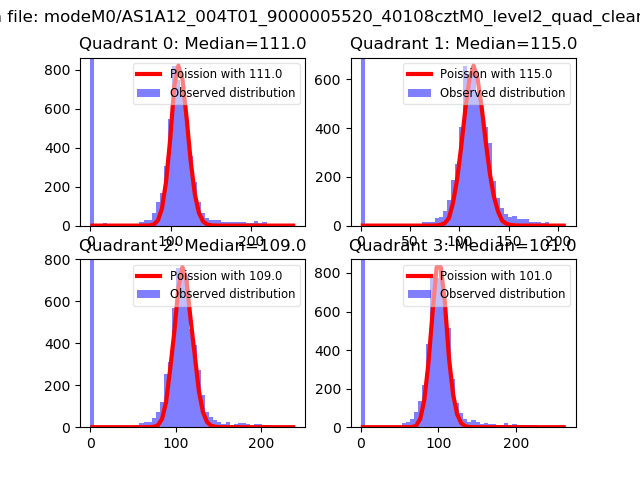 |
 |
| Quadrant-wise count rates Data is divided into 100 sec bins |
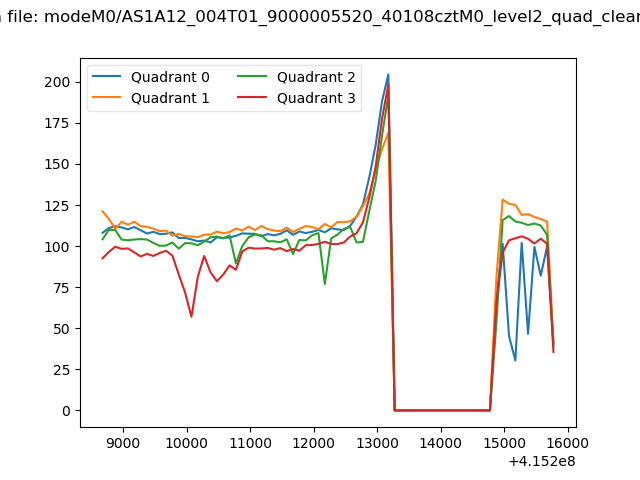 |
|
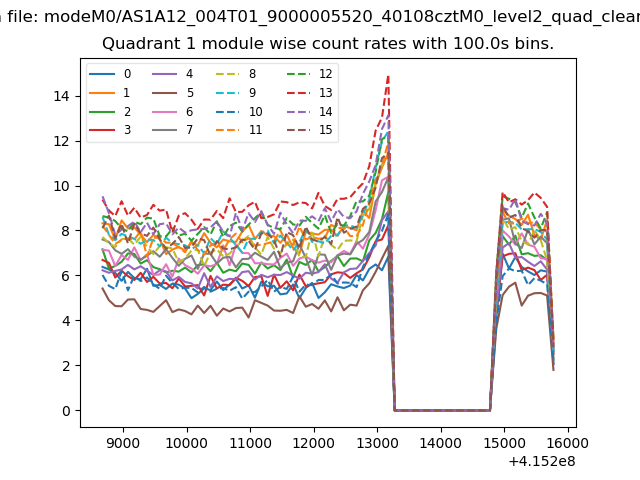
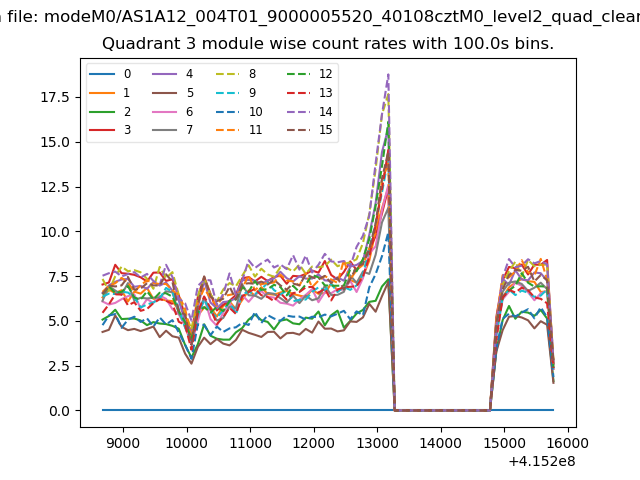
| Module-wise count rates for Quadrant A Data is divided into 100 sec bins |
 |
 |
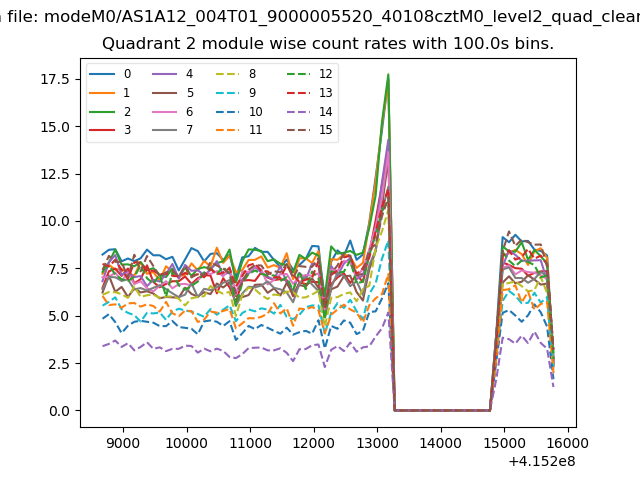
| Module-wise count rates for Quadrant B Data is divided into 100 sec bins |
 |
 |
| Module-wise count rates for Quadrant C Data is divided into 100 sec bins |
 |
 |
| Module-wise count rates for Quadrant D Data is divided into 100 sec bins |
 |
 |
| Parameter | Plot |
|---|---|
| CZT HV Monitor | 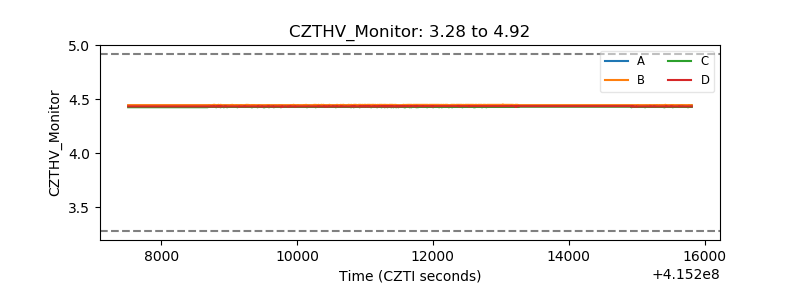 |
| D_VDD | 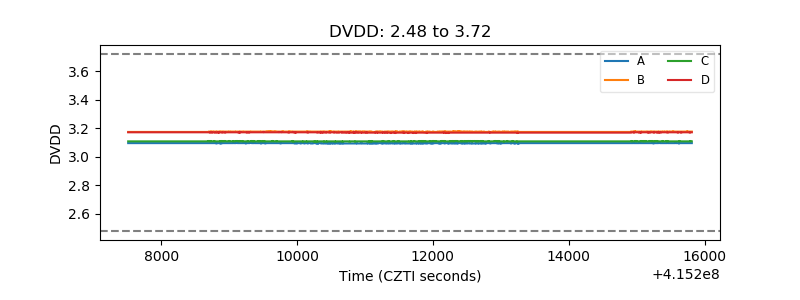 |
| Temperature 1 | 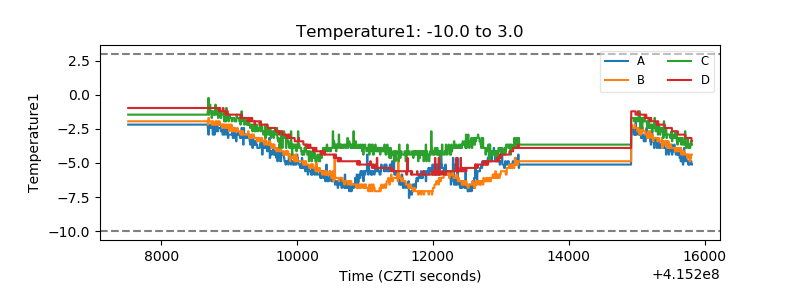 |
| Veto HV Monitor |  |
| Veto LLD | 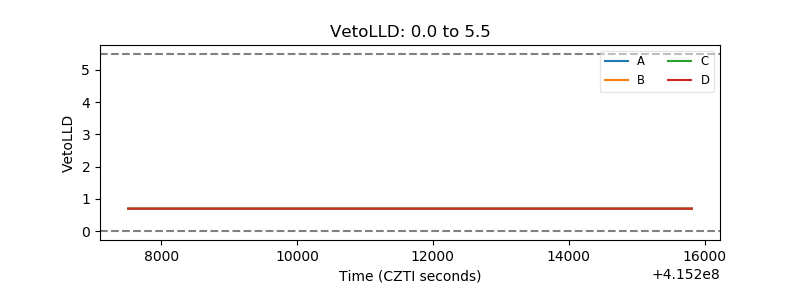 |
| Alpha Counter | 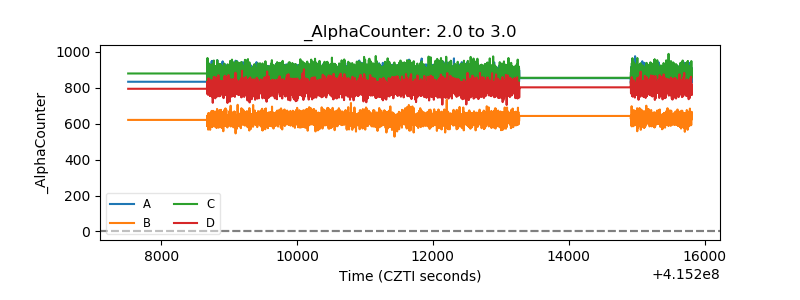 |
| _CPM_Rate | 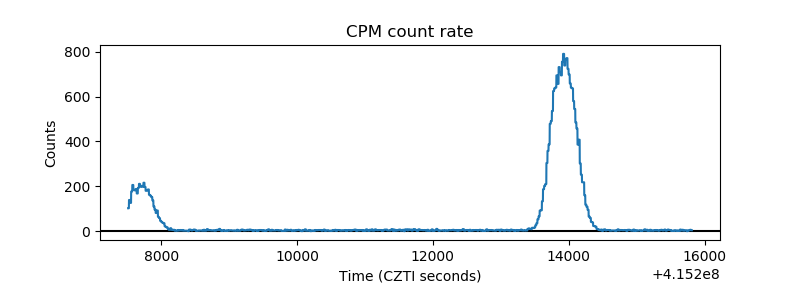 |
| CZT Counter | 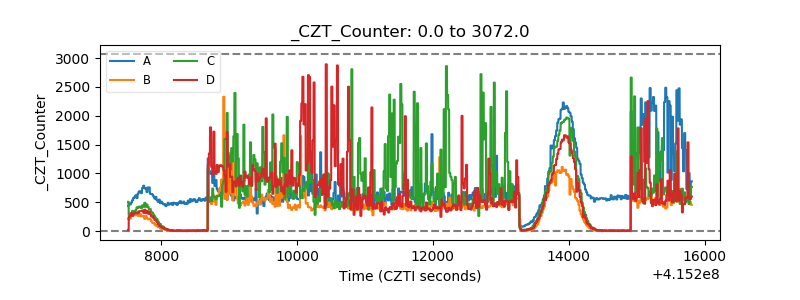 |
| +2.5 Volts monitor | 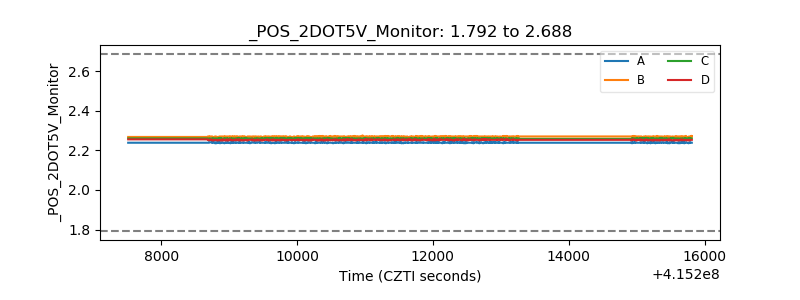 |
| +5 Volts monitor |  |
| _ROLL_ROT | 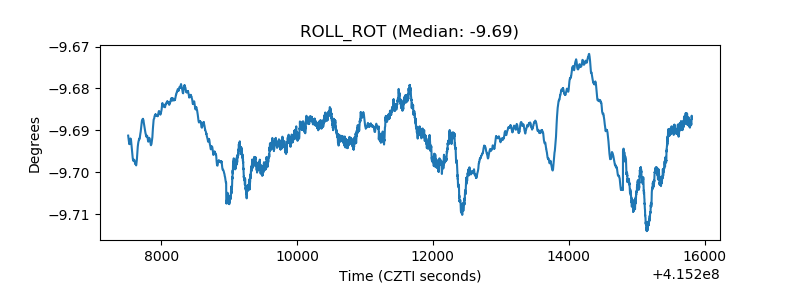 |
| _Roll_DEC | 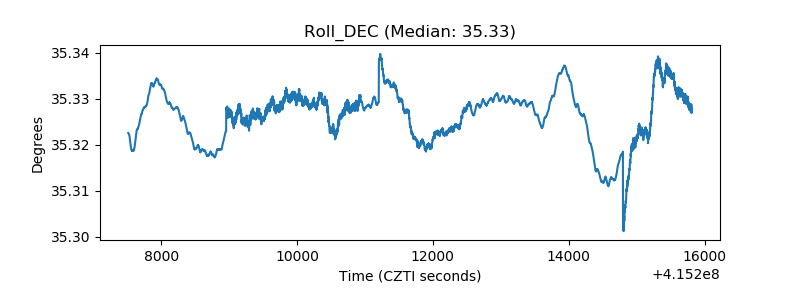 |
| _Roll_RA | 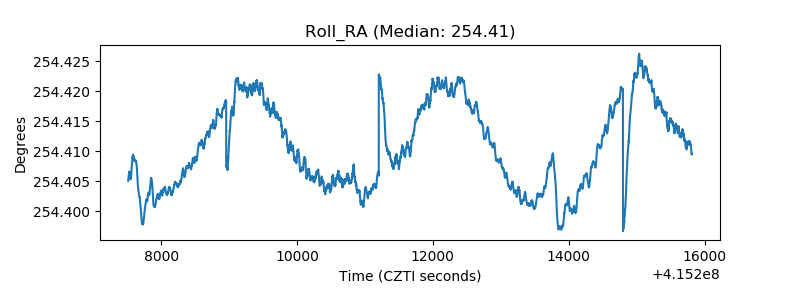 |
| Veto Counter | 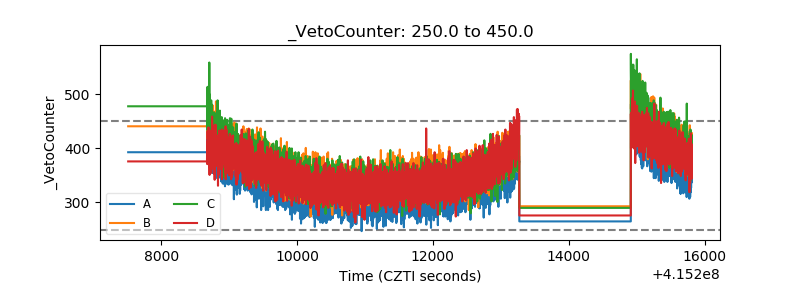 |