| Param | Original file | Final file |
|---|---|---|
| Filename | modeM0/AS1A12_004T01_9000005520_40110cztM0_level2.fits | modeM0/AS1A12_004T01_9000005520_40110cztM0_level2_quad_clean.evt |
| Size (bytes) | 434,891,520 | 86,731,200 |
| Size | 414.7 MB | 82.7 MB |
| Events in quadrant A | 4,969,154 | 527,408 |
| Events in quadrant B | 2,566,765 | 627,529 |
| Events in quadrant C | 4,176,729 | 566,430 |
| Events in quadrant D | 3,971,161 | 531,498 |
| Mode M0 | |||
|---|---|---|---|
| Quadrant | BADHDUFLAG | Total packets | Discarded packets |
| A | 0 | 18320 | 2 |
| B | 0 | 11146 | 1 |
| C | 0 | 16005 | 1 |
| D | 0 | 15516 | 1 |
| Mode M9 | |||
|---|---|---|---|
| Quadrant | BADHDUFLAG | Total packets | Discarded packets |
| A | 0 | 20 | 0 |
| B | 0 | 20 | 0 |
| C | 0 | 20 | 0 |
| D | 0 | 21 | 0 |
| Mode SS | |||
|---|---|---|---|
| Quadrant | BADHDUFLAG | Total packets | Discarded packets |
| A | 0 | 108 | 0 |
| B | 0 | 108 | 0 |
| C | 0 | 108 | 0 |
| D | 0 | 108 | 0 |
| Quadrant | Total seconds | Saturated seconds | Saturation percentage |
|---|---|---|---|
| A | 5333 | 751 | 14.082130% |
| B | 5333 | 8 | 0.150009% |
| C | 5333 | 359 | 6.731671% |
| D | 5333 | 297 | 5.569098% |
Noise dominated data is calculated using 1-second bins in cleaned event files. If a bin has >2000 counts, and if more than 50% of those come from <1% of pixels, then it is considered to be noise-dominated and hence unusable.
| Quadrant | # 1 sec bins | Bins with >0 counts | Bins with >2000 counts | High rate bins dominated by noise | Noise dominated (total time) | Noise dominated (detector-on time) | Marked lightcurve |
|---|---|---|---|---|---|---|---|
| A | 7127 | 5334 | 612 | 612 | 8.59% | 11.47% | 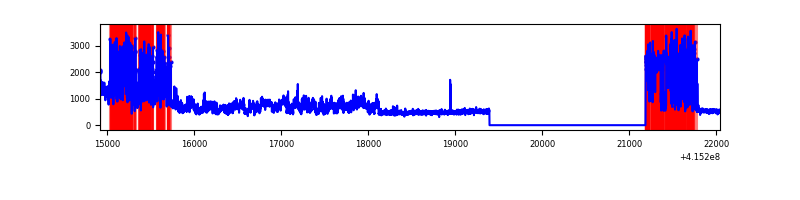 |
| B | 7127 | 5334 | 2 | 2 | 0.03% | 0.04% | 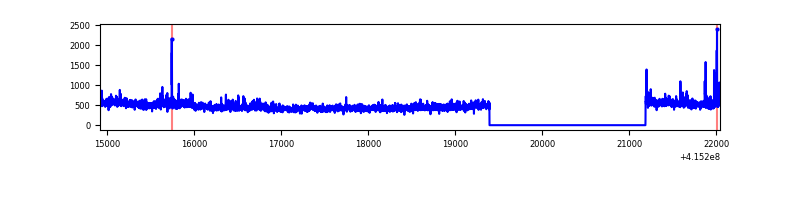 |
| C | 7127 | 5334 | 329 | 329 | 4.62% | 6.17% | 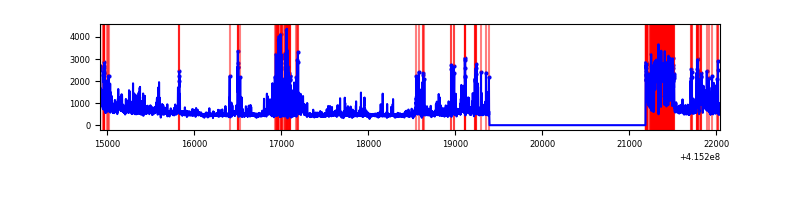 |
| D | 7127 | 5334 | 272 | 272 | 3.82% | 5.10% | 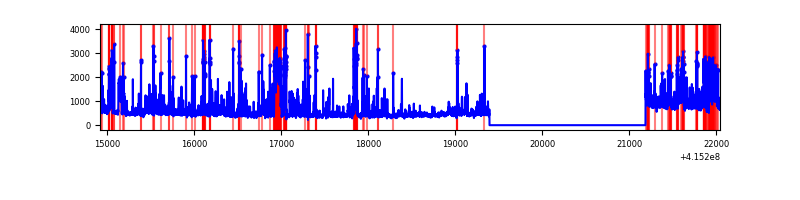 |
Top three noisy pixels from each quadrant. If the there are fewer than three noisy pixels in the level2.evt file, extra rows are filled as -1
| Pixel properties | Quadrant properties | ||||||
|---|---|---|---|---|---|---|---|
| Quadrant | DetID | PixID | Counts | Sigma | Mean | Median | Sigma |
| A | 13 | 248 | 1544940 | 13757.27 | 546 | 536 | 112.3 |
| A | 6 | 10 | 861412 | 7668.53 | 546 | 536 | 112.3 |
| A | 10 | 83 | 398877 | 3548.35 | 546 | 536 | 112.3 |
| B | 0 | 189 | 148844 | 1282.83 | 595 | 578 | 115.6 |
| B | 4 | 171 | 38706 | 329.89 | 595 | 578 | 115.6 |
| B | 12 | 0 | 17347 | 145.09 | 595 | 578 | 115.6 |
| C | 9 | 187 | 1464015 | 11054.18 | 567 | 571 | 132.4 |
| C | 15 | 214 | 215442 | 1623.04 | 567 | 571 | 132.4 |
| C | 10 | 20 | 186793 | 1406.63 | 567 | 571 | 132.4 |
| D | 12 | 227 | 895675 | 6341.94 | 573 | 558 | 141.1 |
| D | 2 | 249 | 234500 | 1657.49 | 573 | 558 | 141.1 |
| D | 5 | 32 | 205094 | 1449.15 | 573 | 558 | 141.1 |
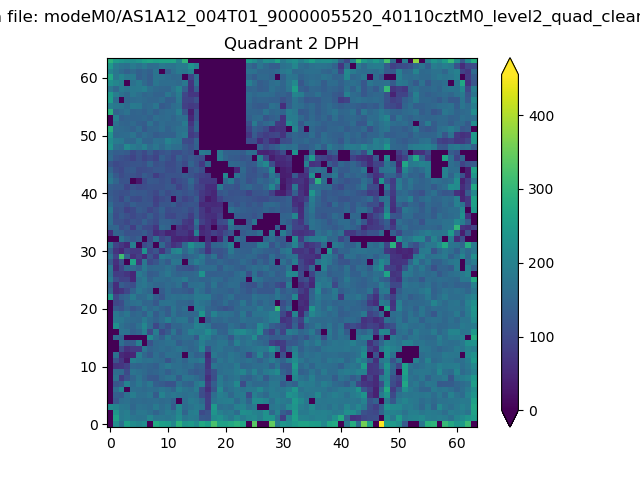
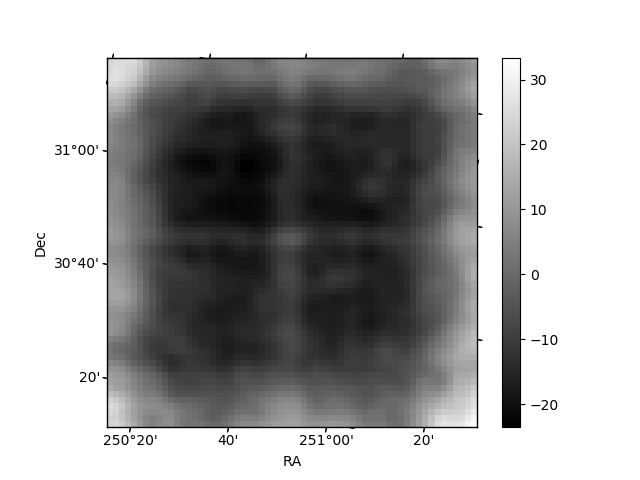
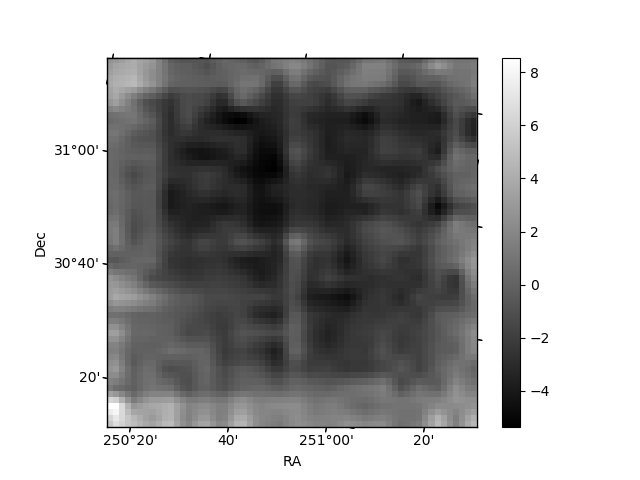
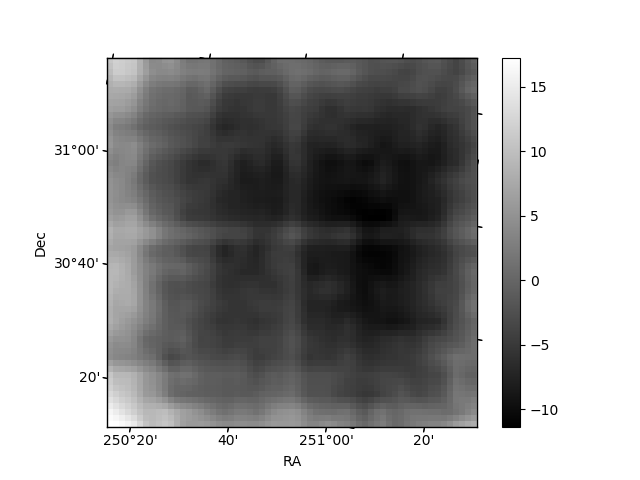
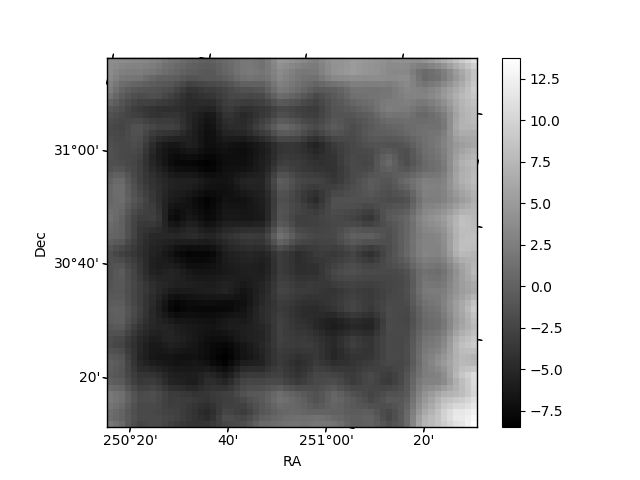
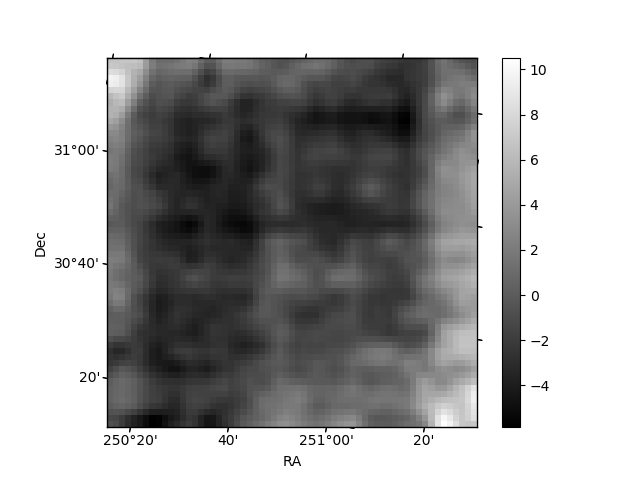
Histogram calculated using DETX and DETY for each event in the final _common_clean file
| Quadrant A | 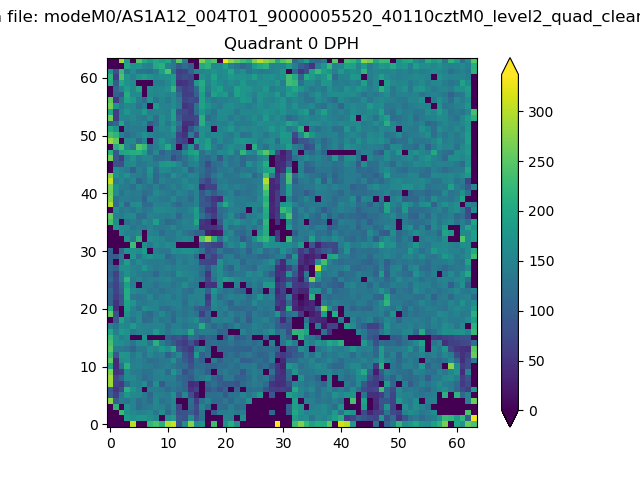 |
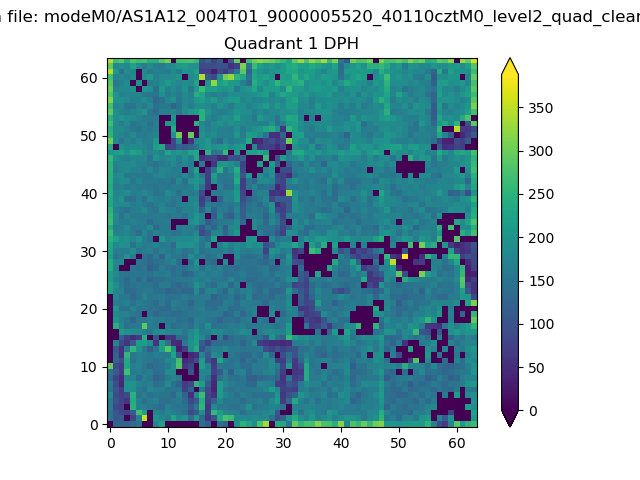 |
Quadrant B |
|---|---|---|---|
| Quadrant D | 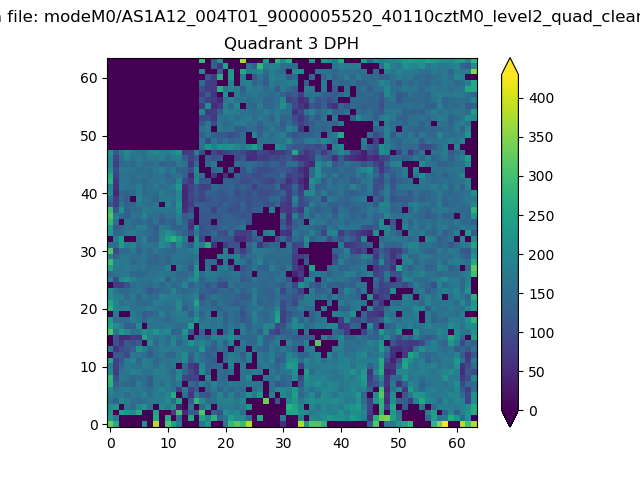 |
 |
Quadrant C |
| Plot type | Count rate plots | Images |
|---|---|---|
| Comparison with Poisson distribution Blue bars denote a histogram of data divided into 1 sec bins. Red curve is a Poisson curve with rate = median count rate of data. |
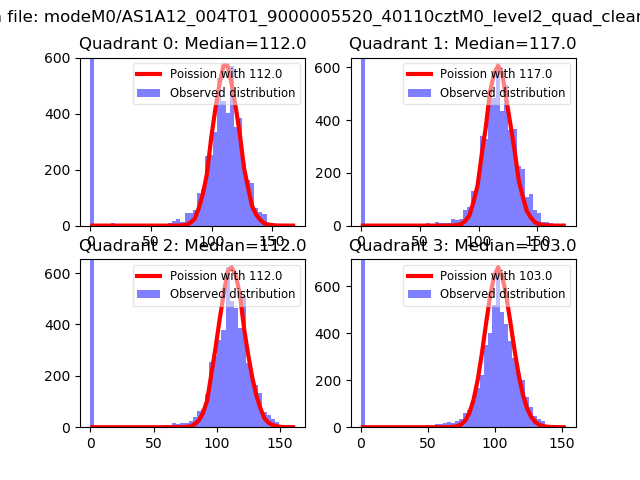 |
 |
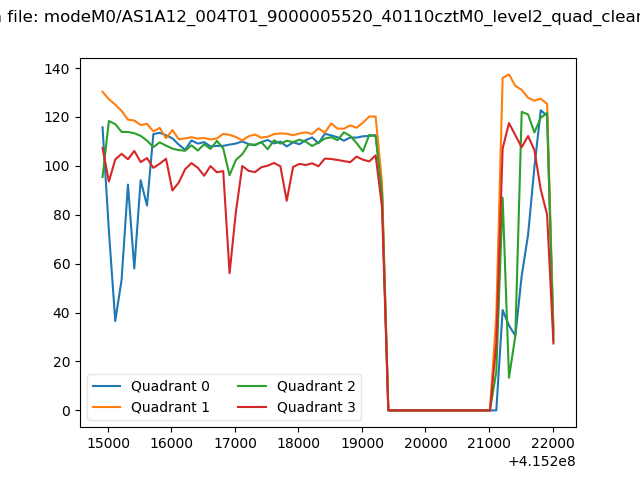
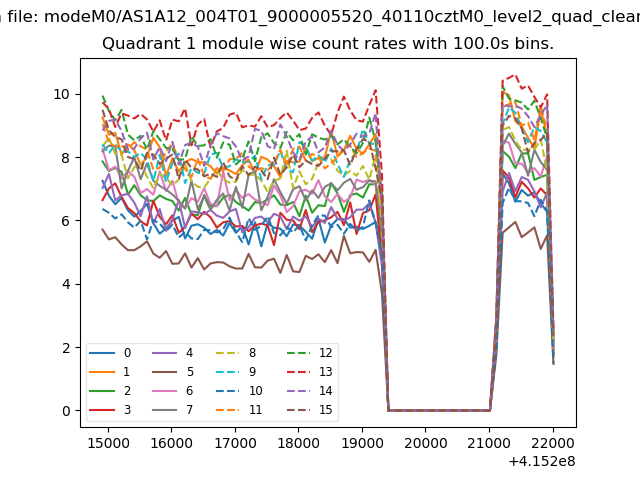
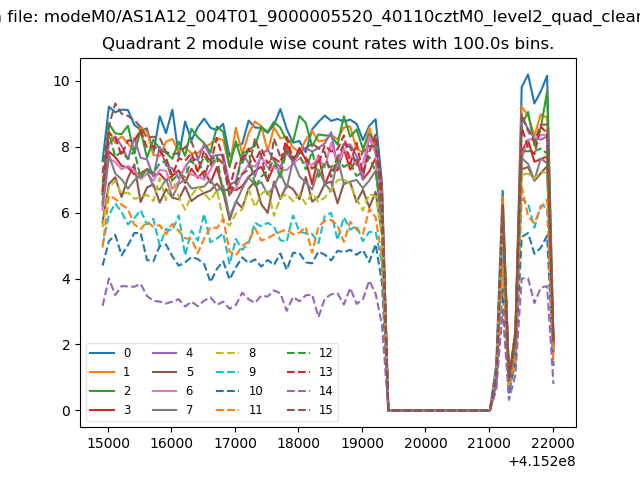
| Quadrant-wise count rates Data is divided into 100 sec bins |
 |
|
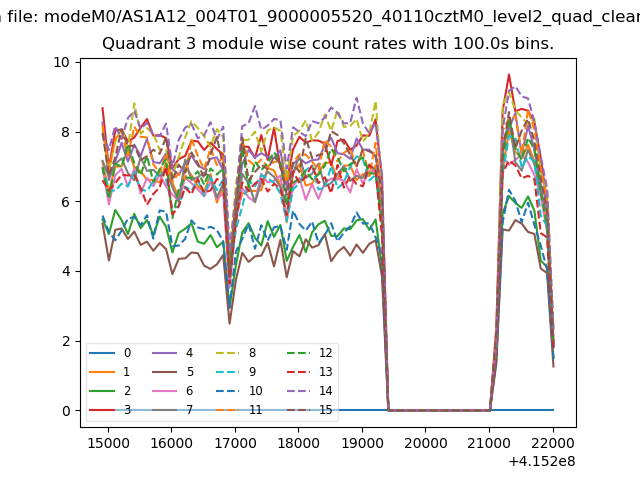
| Module-wise count rates for Quadrant A Data is divided into 100 sec bins |
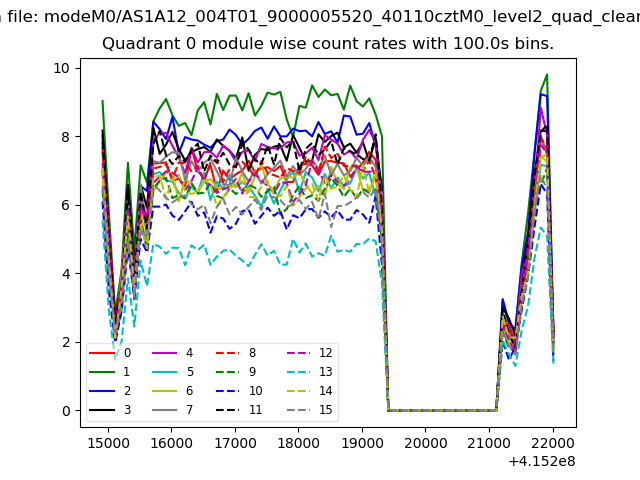 |
 |
| Module-wise count rates for Quadrant B Data is divided into 100 sec bins |
 |
 |
| Module-wise count rates for Quadrant C Data is divided into 100 sec bins |
 |
 |
| Module-wise count rates for Quadrant D Data is divided into 100 sec bins |
 |
 |
| Parameter | Plot |
|---|---|
| CZT HV Monitor |  |
| D_VDD | 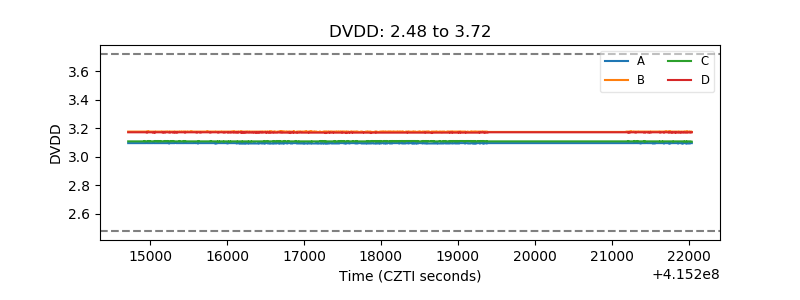 |
| Temperature 1 | 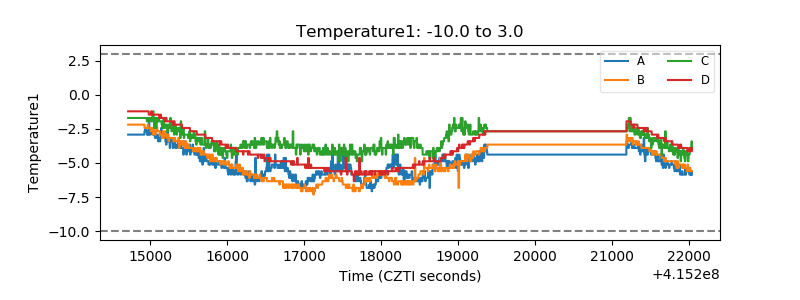 |
| Veto HV Monitor | 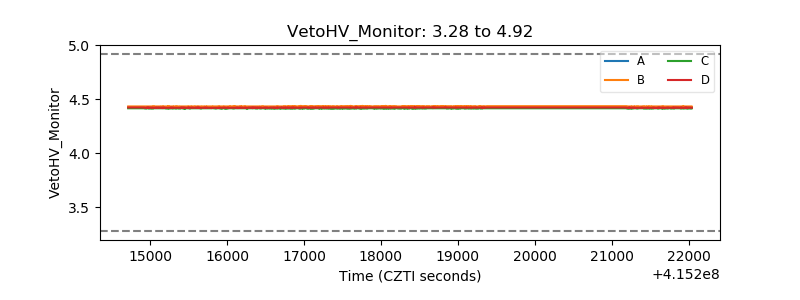 |
| Veto LLD | 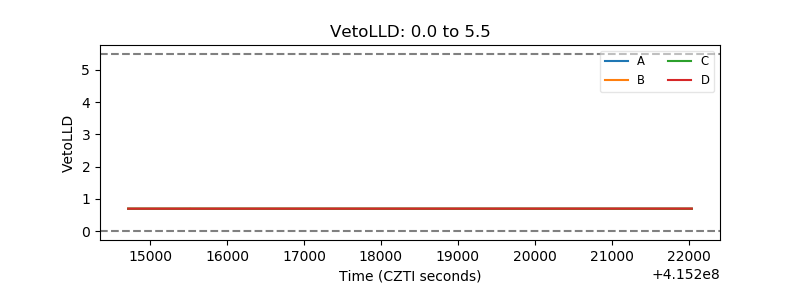 |
| Alpha Counter | 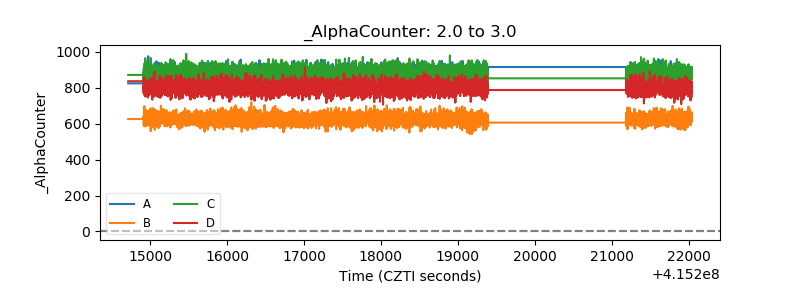 |
| _CPM_Rate | 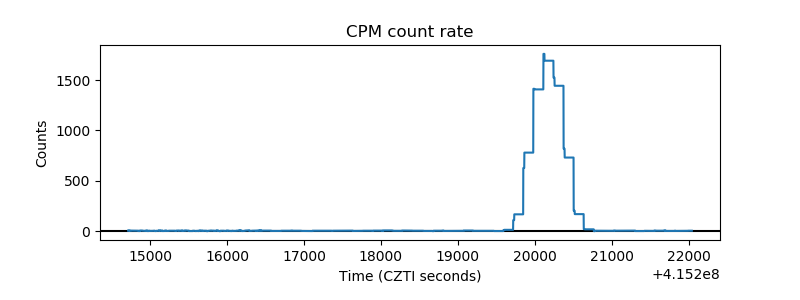 |
| CZT Counter | 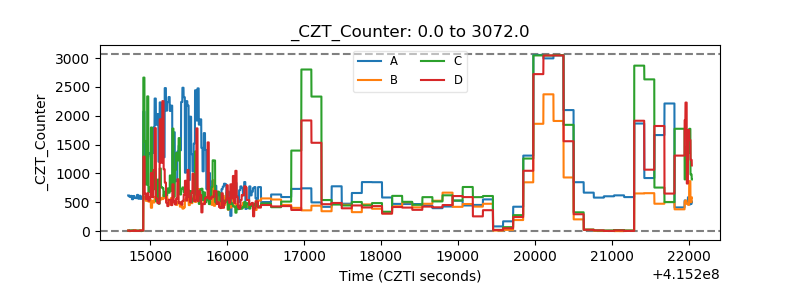 |
| +2.5 Volts monitor | 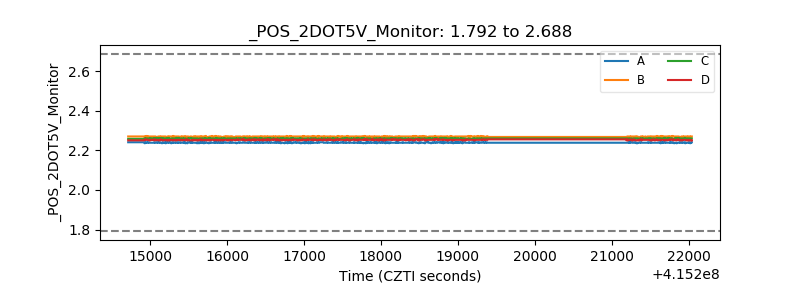 |
| +5 Volts monitor | 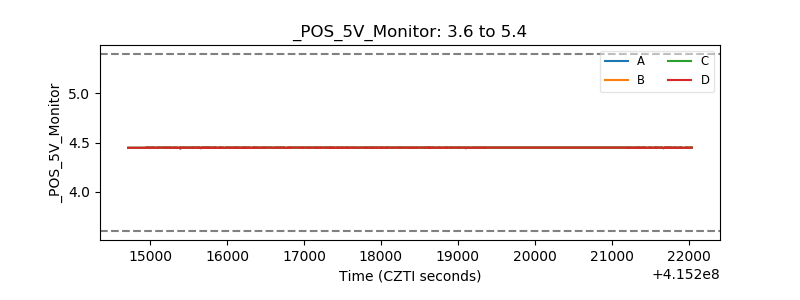 |
| _ROLL_ROT | 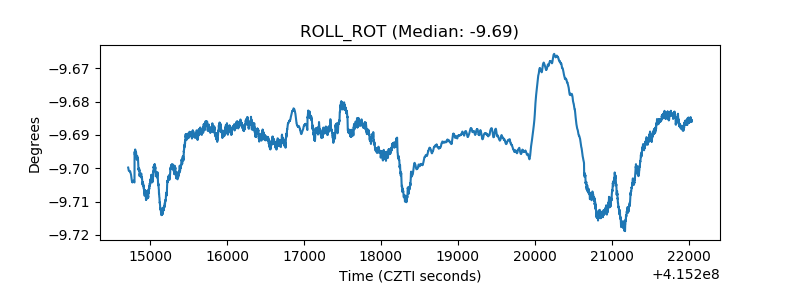 |
| _Roll_DEC |  |
| _Roll_RA | 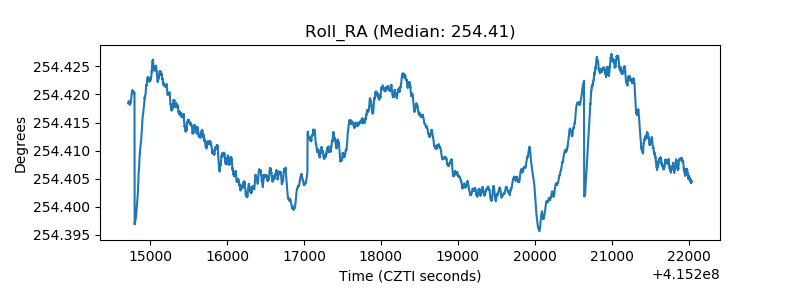 |
| Veto Counter | 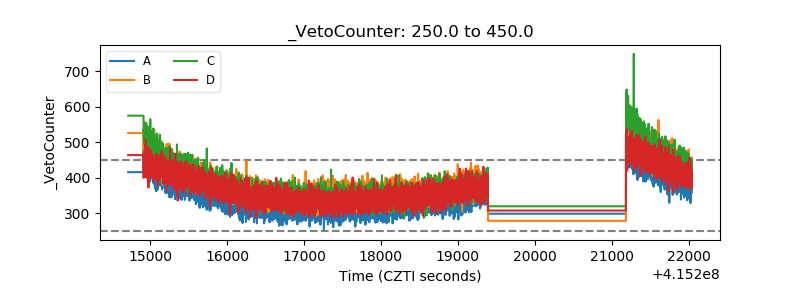 |