| Param | Original file | Final file |
|---|---|---|
| Filename | modeM0/AS1A12_004T01_9000005520_40111cztM0_level2.fits | modeM0/AS1A12_004T01_9000005520_40111cztM0_level2_quad_clean.evt |
| Size (bytes) | 391,919,040 | 87,229,440 |
| Size | 373.8 MB | 83.2 MB |
| Events in quadrant A | 3,526,249 | 556,313 |
| Events in quadrant B | 2,439,998 | 628,008 |
| Events in quadrant C | 4,586,910 | 565,357 |
| Events in quadrant D | 3,558,037 | 534,527 |
| Mode M0 | |||
|---|---|---|---|
| Quadrant | BADHDUFLAG | Total packets | Discarded packets |
| A | 0 | 13661 | 3 |
| B | 0 | 10597 | 2 |
| C | 0 | 17107 | 2 |
| D | 0 | 14294 | 2 |
| Mode M9 | |||
|---|---|---|---|
| Quadrant | BADHDUFLAG | Total packets | Discarded packets |
| A | 0 | 24 | 0 |
| B | 0 | 24 | 0 |
| C | 0 | 24 | 0 |
| D | 0 | 25 | 0 |
| Mode SS | |||
|---|---|---|---|
| Quadrant | BADHDUFLAG | Total packets | Discarded packets |
| A | 0 | 104 | 0 |
| B | 0 | 104 | 0 |
| C | 0 | 104 | 0 |
| D | 0 | 104 | 0 |
| Quadrant | Total seconds | Saturated seconds | Saturation percentage |
|---|---|---|---|
| A | 5096 | 401 | 7.868917% |
| B | 5096 | 12 | 0.235479% |
| C | 5096 | 423 | 8.300628% |
| D | 5096 | 225 | 4.415228% |
Noise dominated data is calculated using 1-second bins in cleaned event files. If a bin has >2000 counts, and if more than 50% of those come from <1% of pixels, then it is considered to be noise-dominated and hence unusable.
| Quadrant | # 1 sec bins | Bins with >0 counts | Bins with >2000 counts | High rate bins dominated by noise | Noise dominated (total time) | Noise dominated (detector-on time) | Marked lightcurve |
|---|---|---|---|---|---|---|---|
| A | 7007 | 5097 | 349 | 349 | 4.98% | 6.85% | 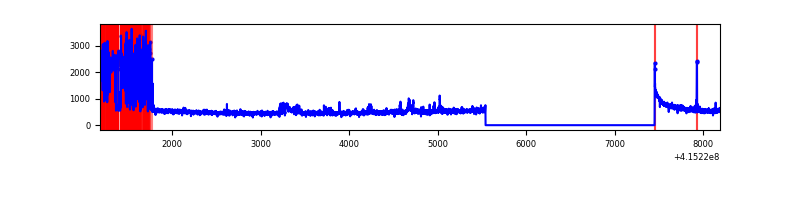 |
| B | 7007 | 5097 | 6 | 6 | 0.09% | 0.12% | 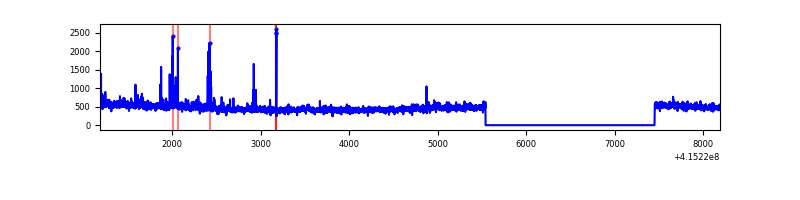 |
| C | 7007 | 5097 | 416 | 416 | 5.94% | 8.16% | 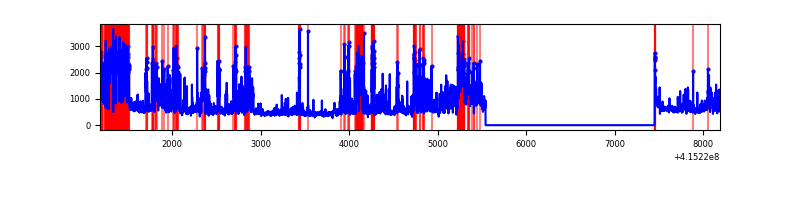 |
| D | 7007 | 5097 | 192 | 192 | 2.74% | 3.77% | 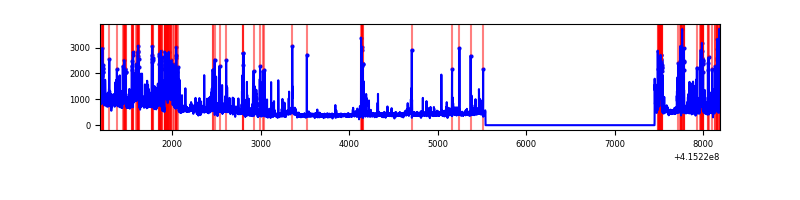 |
Top three noisy pixels from each quadrant. If the there are fewer than three noisy pixels in the level2.evt file, extra rows are filled as -1
| Pixel properties | Quadrant properties | ||||||
|---|---|---|---|---|---|---|---|
| Quadrant | DetID | PixID | Counts | Sigma | Mean | Median | Sigma |
| A | 13 | 248 | 884761 | 7939.35 | 544 | 534 | 111.4 |
| A | 10 | 83 | 385488 | 3456.45 | 544 | 534 | 111.4 |
| A | 12 | 189 | 88069 | 785.96 | 544 | 534 | 111.4 |
| B | 0 | 189 | 95144 | 843.85 | 577 | 560 | 112.1 |
| B | 4 | 171 | 50470 | 445.28 | 577 | 560 | 112.1 |
| B | 5 | 255 | 16164 | 139.21 | 577 | 560 | 112.1 |
| C | 9 | 187 | 2040712 | 16062.78 | 550 | 554 | 127.0 |
| C | 15 | 214 | 203875 | 1600.8 | 550 | 554 | 127.0 |
| C | 10 | 20 | 85559 | 669.27 | 550 | 554 | 127.0 |
| D | 12 | 227 | 432264 | 3147.14 | 557 | 542 | 137.2 |
| D | 5 | 32 | 309982 | 2255.74 | 557 | 542 | 137.2 |
| D | 2 | 249 | 206772 | 1503.36 | 557 | 542 | 137.2 |
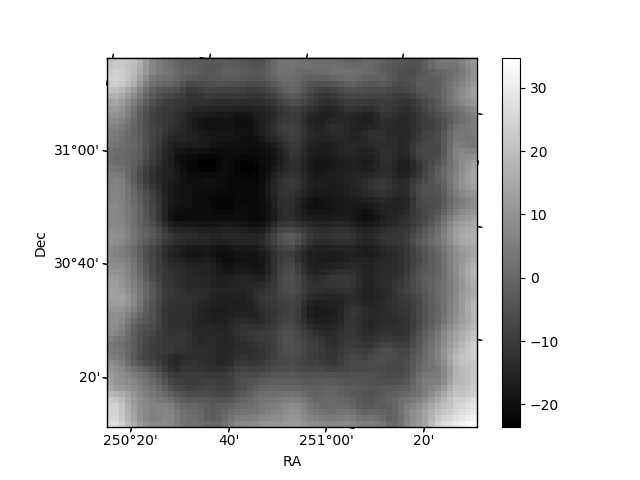
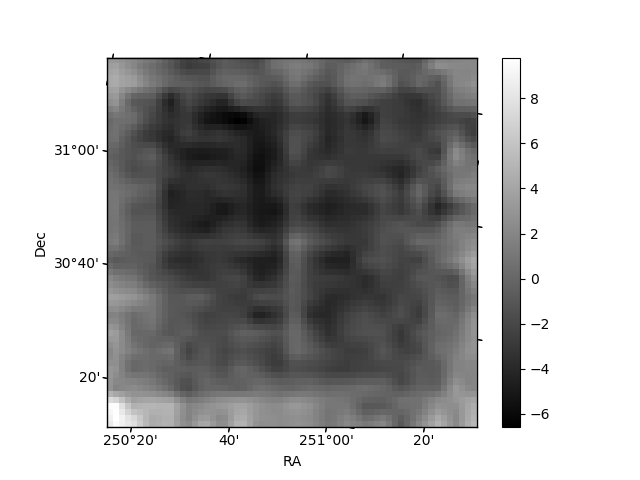
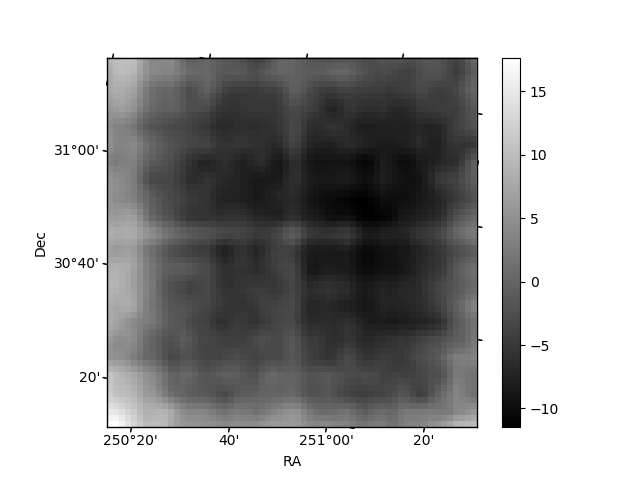
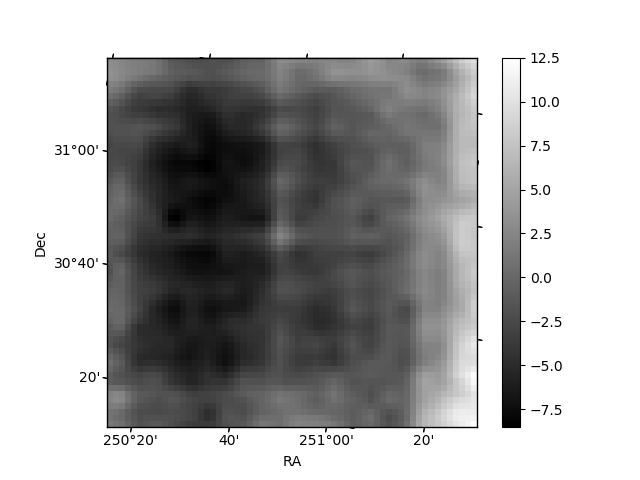
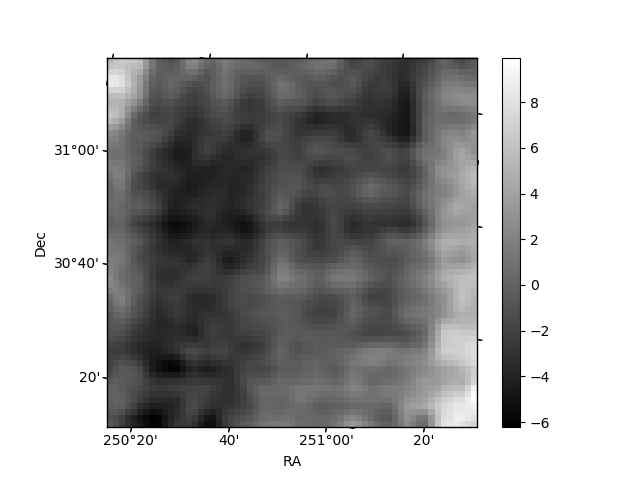
Histogram calculated using DETX and DETY for each event in the final _common_clean file
| Quadrant A | 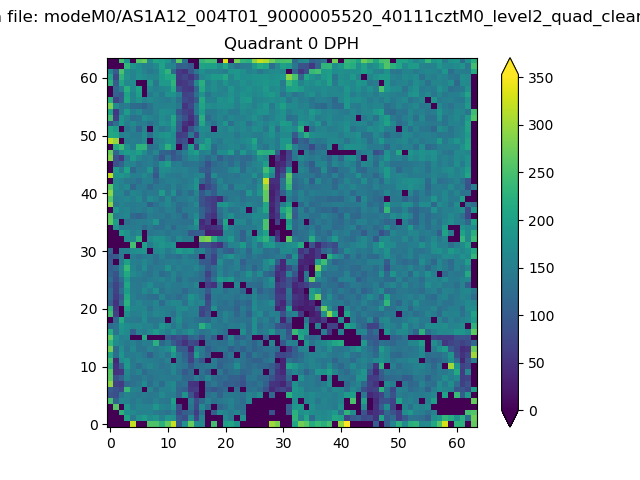 |
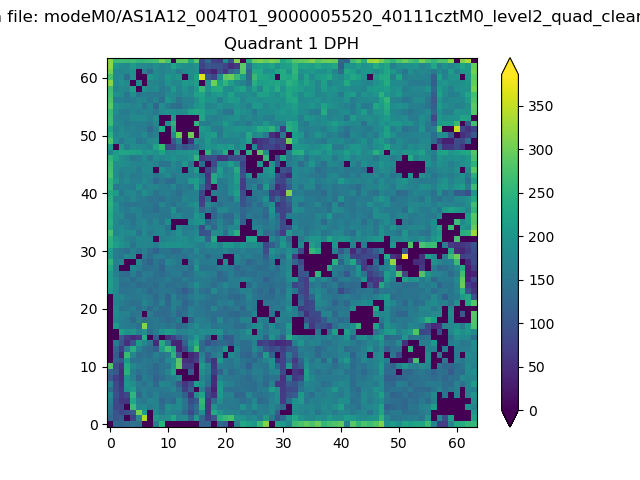 |
Quadrant B |
|---|---|---|---|
| Quadrant D | 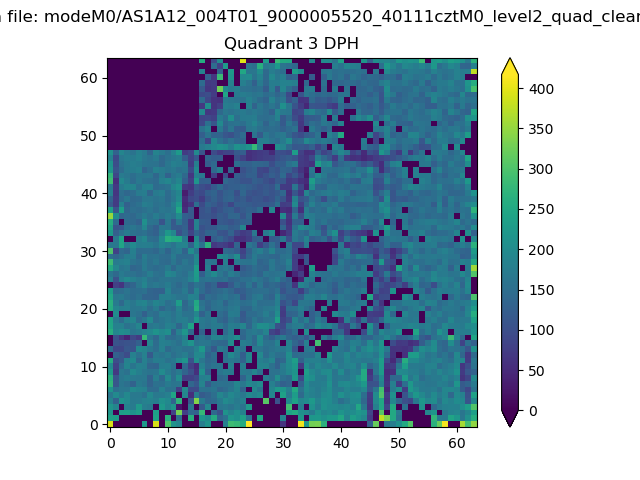 |
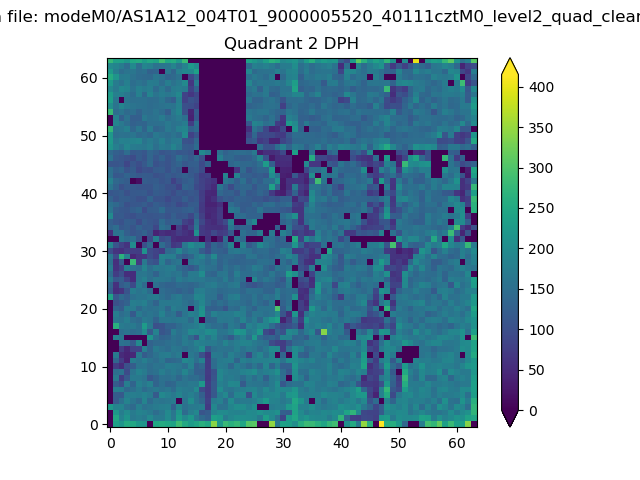 |
Quadrant C |
| Plot type | Count rate plots | Images |
|---|---|---|
| Comparison with Poisson distribution Blue bars denote a histogram of data divided into 1 sec bins. Red curve is a Poisson curve with rate = median count rate of data. |
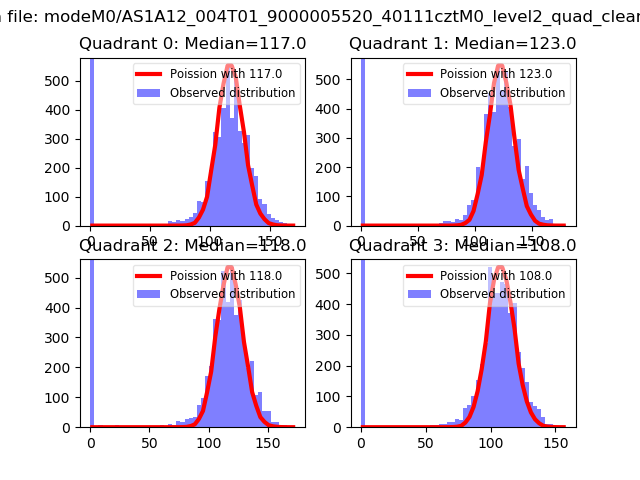 |
 |
| Quadrant-wise count rates Data is divided into 100 sec bins |
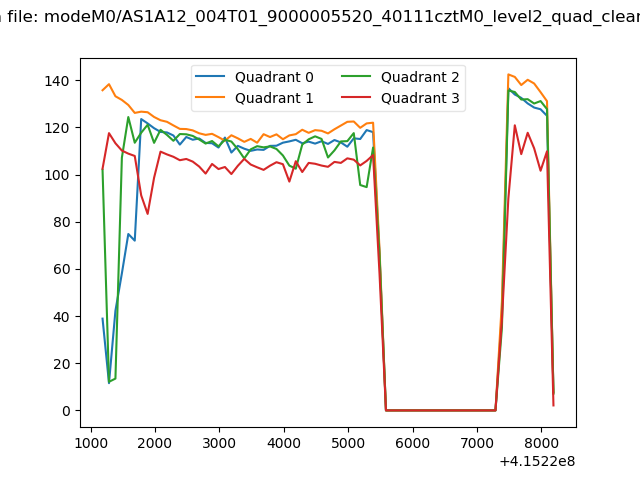 |
|
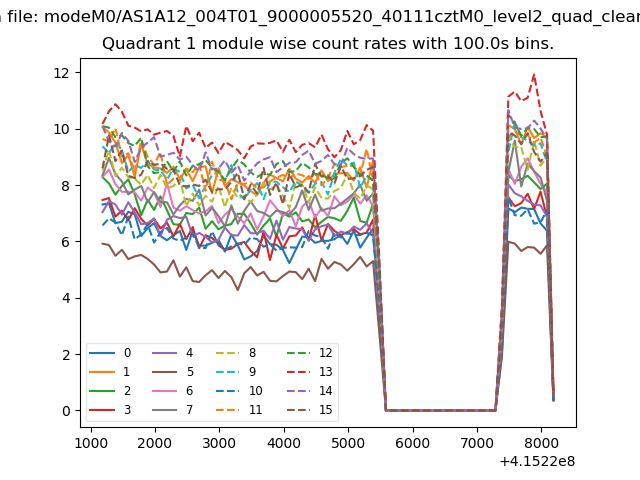
| Module-wise count rates for Quadrant A Data is divided into 100 sec bins |
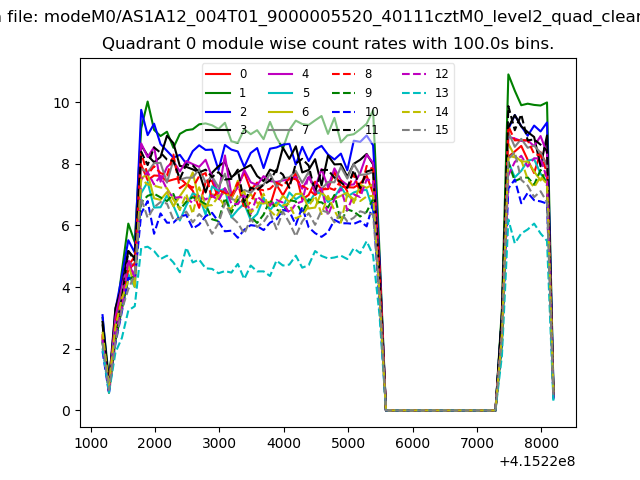 |
 |
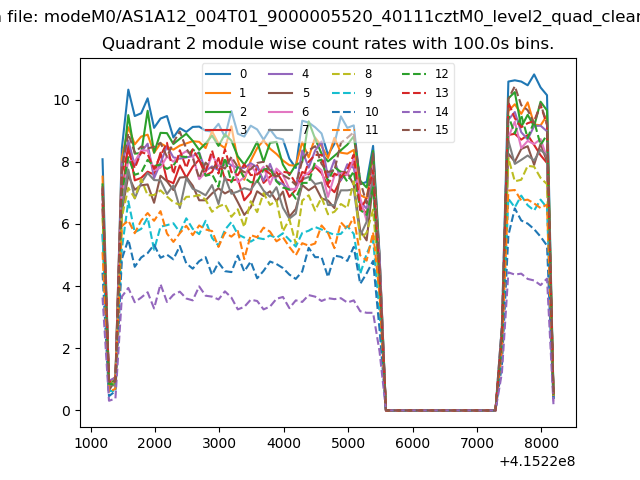
| Module-wise count rates for Quadrant B Data is divided into 100 sec bins |
 |
 |
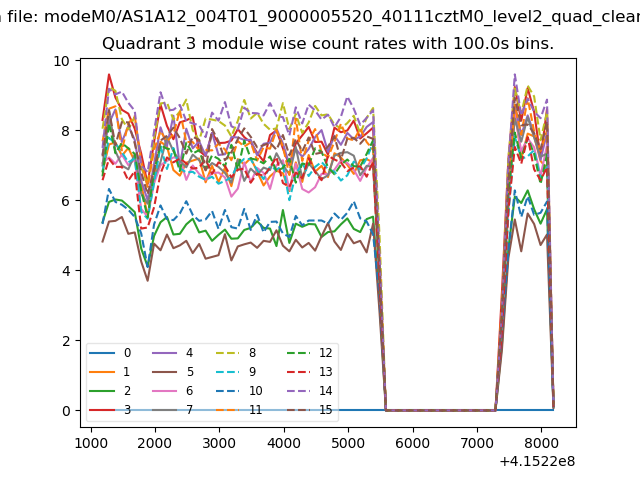
| Module-wise count rates for Quadrant C Data is divided into 100 sec bins |
 |
 |
| Module-wise count rates for Quadrant D Data is divided into 100 sec bins |
 |
 |
| Parameter | Plot |
|---|---|
| CZT HV Monitor | 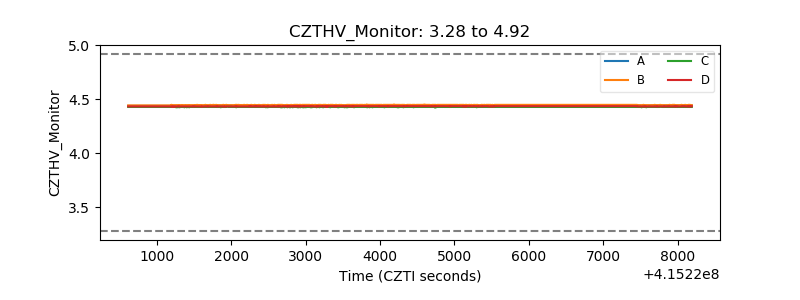 |
| D_VDD |  |
| Temperature 1 |  |
| Veto HV Monitor | 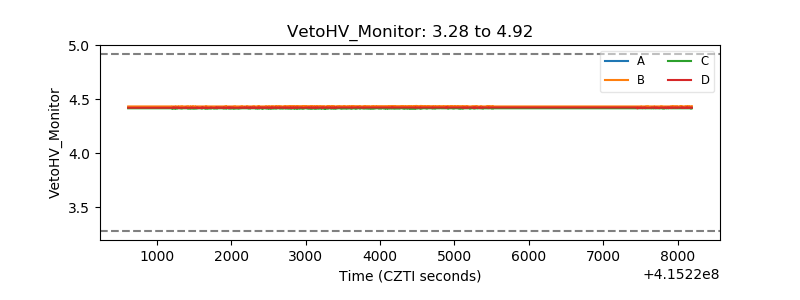 |
| Veto LLD | 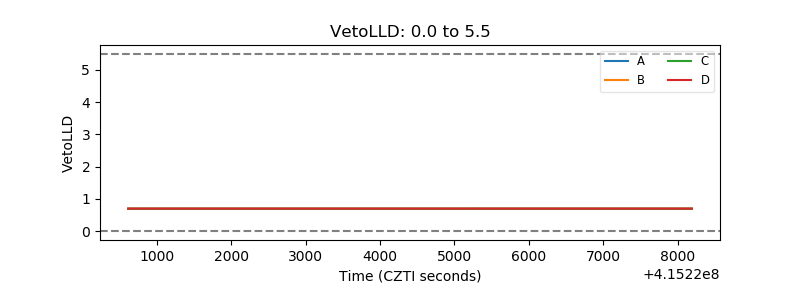 |
| Alpha Counter | 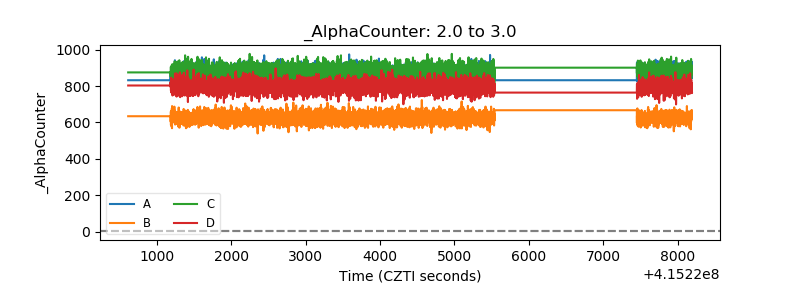 |
| _CPM_Rate | 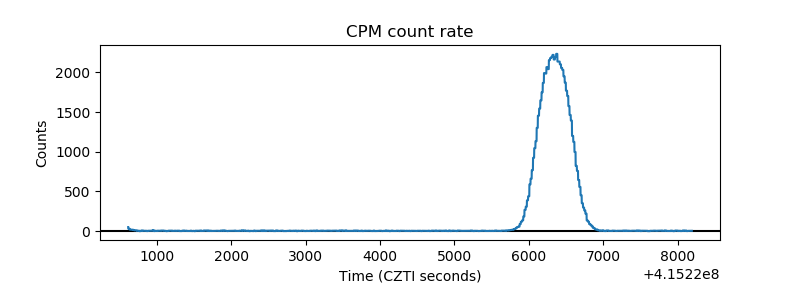 |
| CZT Counter | 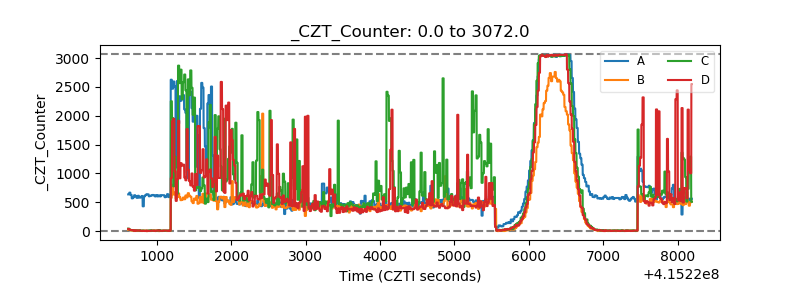 |
| +2.5 Volts monitor | 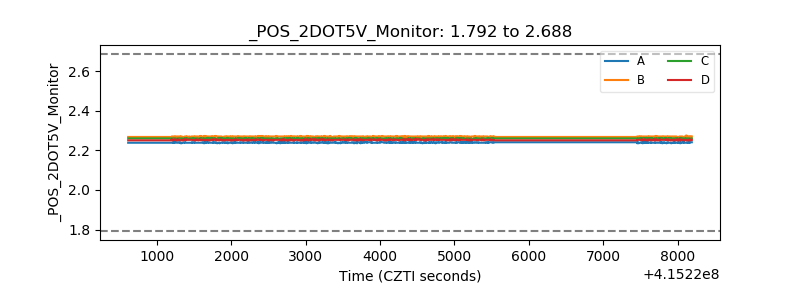 |
| +5 Volts monitor | 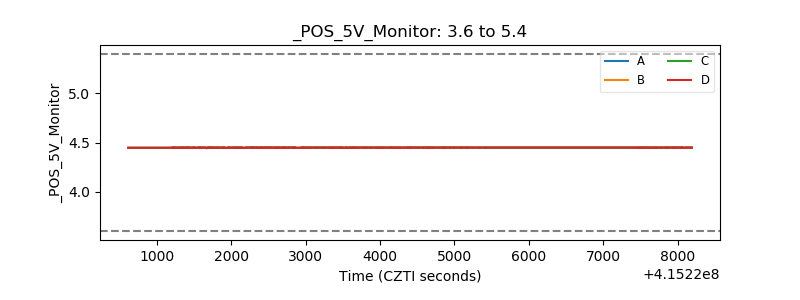 |
| _ROLL_ROT | 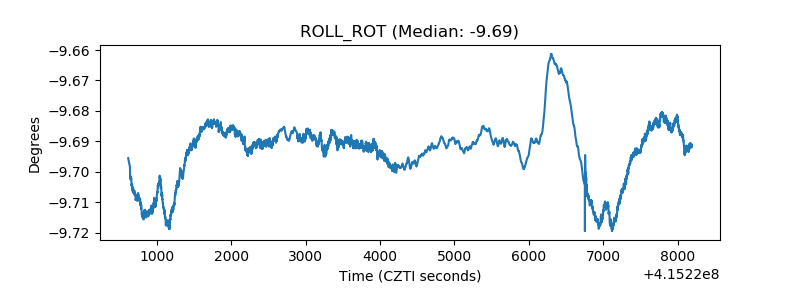 |
| _Roll_DEC | 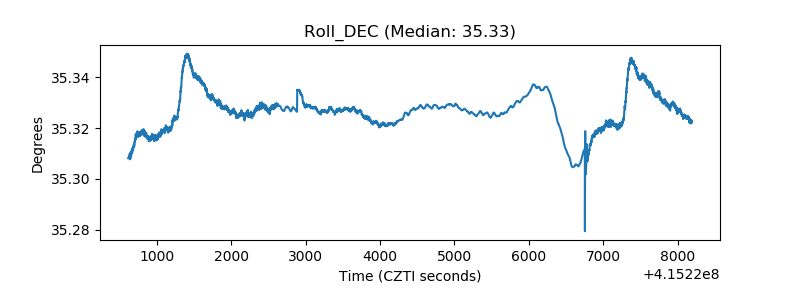 |
| _Roll_RA | 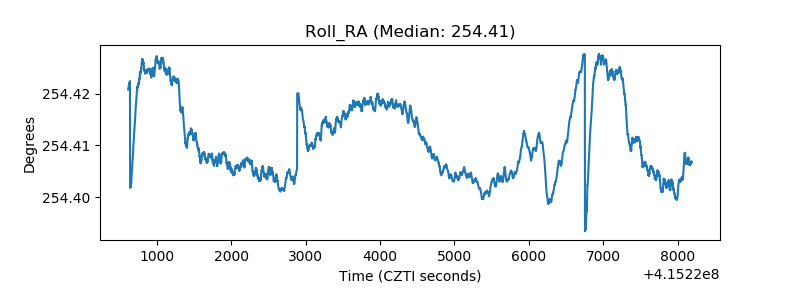 |
| Veto Counter | 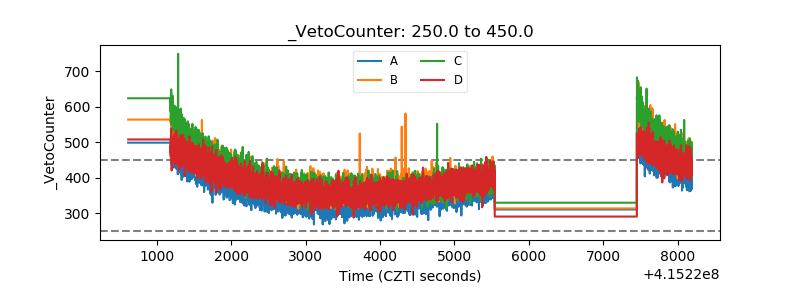 |