| Param | Original file | Final file |
|---|---|---|
| Filename | modeM0/AS1A12_004T01_9000005520_40112cztM0_level2.fits | modeM0/AS1A12_004T01_9000005520_40112cztM0_level2_quad_clean.evt |
| Size (bytes) | 351,270,720 | 89,323,200 |
| Size | 335.0 MB | 85.2 MB |
| Events in quadrant A | 2,935,171 | 603,530 |
| Events in quadrant B | 2,353,081 | 634,204 |
| Events in quadrant C | 3,815,586 | 595,328 |
| Events in quadrant D | 3,511,209 | 523,088 |
| Mode M0 | |||
|---|---|---|---|
| Quadrant | BADHDUFLAG | Total packets | Discarded packets |
| A | 0 | 11943 | 3 |
| B | 0 | 10194 | 2 |
| C | 0 | 14627 | 2 |
| D | 0 | 13939 | 2 |
| Mode M9 | |||
|---|---|---|---|
| Quadrant | BADHDUFLAG | Total packets | Discarded packets |
| A | 0 | 31 | 0 |
| B | 0 | 31 | 0 |
| C | 0 | 31 | 0 |
| D | 0 | 32 | 0 |
| Mode SS | |||
|---|---|---|---|
| Quadrant | BADHDUFLAG | Total packets | Discarded packets |
| A | 0 | 100 | 0 |
| B | 0 | 100 | 0 |
| C | 0 | 100 | 0 |
| D | 0 | 100 | 0 |
| Quadrant | Total seconds | Saturated seconds | Saturation percentage |
|---|---|---|---|
| A | 4979 | 15 | 0.301265% |
| B | 4979 | 4 | 0.080337% |
| C | 4979 | 163 | 3.273750% |
| D | 4979 | 341 | 6.848765% |
Noise dominated data is calculated using 1-second bins in cleaned event files. If a bin has >2000 counts, and if more than 50% of those come from <1% of pixels, then it is considered to be noise-dominated and hence unusable.
| Quadrant | # 1 sec bins | Bins with >0 counts | Bins with >2000 counts | High rate bins dominated by noise | Noise dominated (total time) | Noise dominated (detector-on time) | Marked lightcurve |
|---|---|---|---|---|---|---|---|
| A | 7011 | 4980 | 9 | 9 | 0.13% | 0.18% | 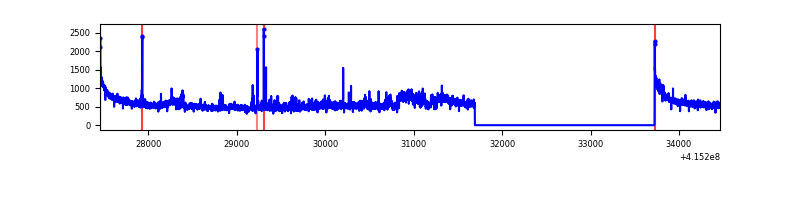 |
| B | 7011 | 4980 | 0 | 0 | 0.00% | 0.00% | 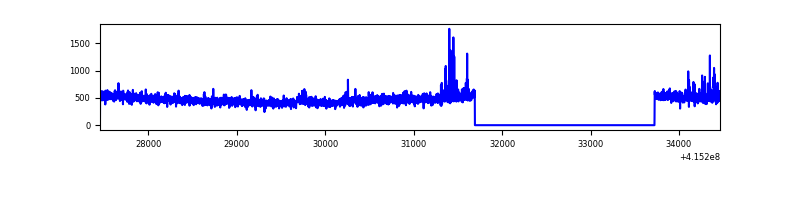 |
| C | 7011 | 4980 | 165 | 165 | 2.35% | 3.31% | 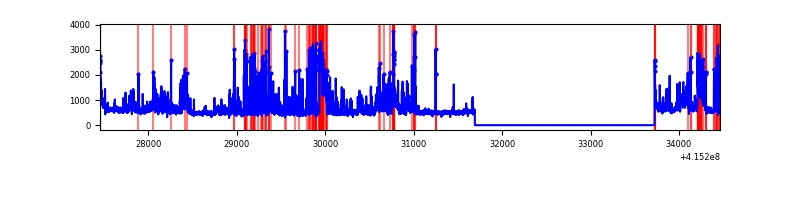 |
| D | 7011 | 4980 | 296 | 296 | 4.22% | 5.94% | 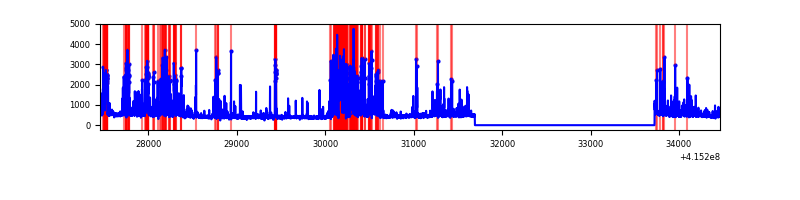 |
Top three noisy pixels from each quadrant. If the there are fewer than three noisy pixels in the level2.evt file, extra rows are filled as -1
| Pixel properties | Quadrant properties | ||||||
|---|---|---|---|---|---|---|---|
| Quadrant | DetID | PixID | Counts | Sigma | Mean | Median | Sigma |
| A | 10 | 83 | 432507 | 3774.69 | 565 | 553 | 114.4 |
| A | 12 | 189 | 235873 | 2056.38 | 565 | 553 | 114.4 |
| A | 2 | 79 | 61853 | 535.68 | 565 | 553 | 114.4 |
| B | 0 | 189 | 44558 | 397.19 | 571 | 557 | 110.8 |
| B | 4 | 171 | 33828 | 300.33 | 571 | 557 | 110.8 |
| B | 0 | 230 | 23799 | 209.8 | 571 | 557 | 110.8 |
| C | 9 | 187 | 1342579 | 10404.83 | 556 | 562 | 129.0 |
| C | 15 | 214 | 206955 | 1600.19 | 556 | 562 | 129.0 |
| C | 0 | 10 | 50260 | 385.32 | 556 | 562 | 129.0 |
| D | 2 | 249 | 857687 | 6484.24 | 539 | 526 | 132.2 |
| D | 13 | 249 | 180896 | 1364.46 | 539 | 526 | 132.2 |
| D | 5 | 32 | 110788 | 834.11 | 539 | 526 | 132.2 |
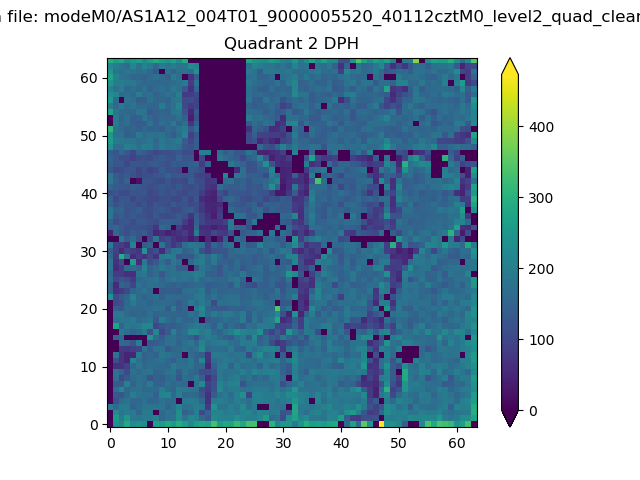
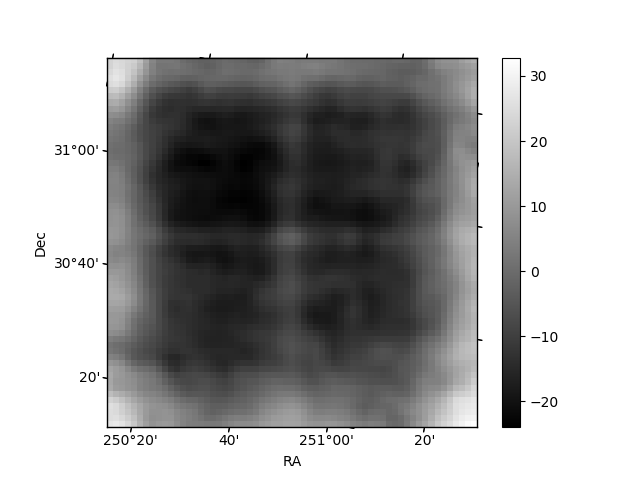
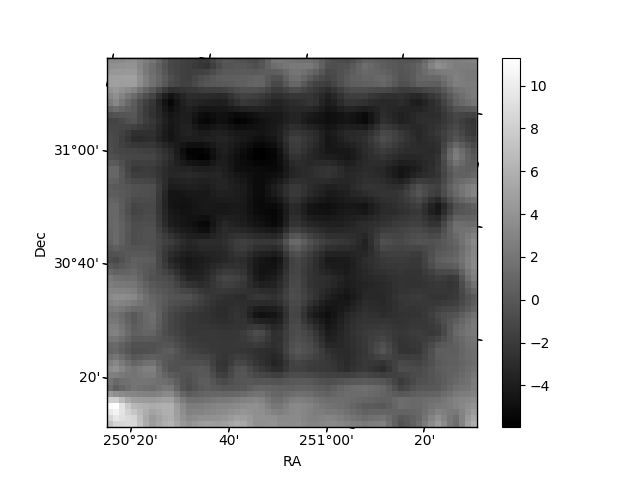
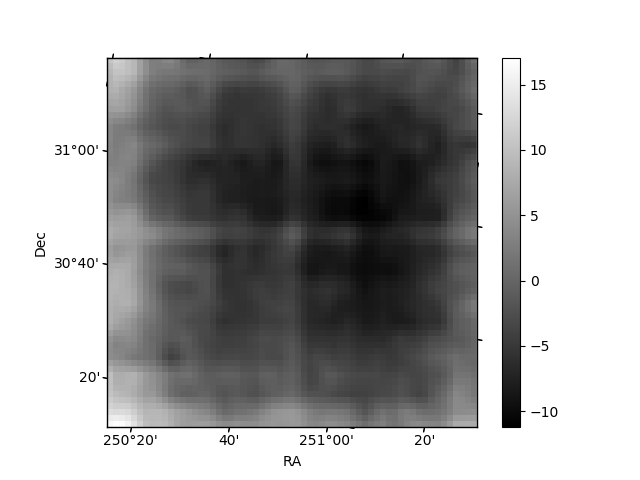
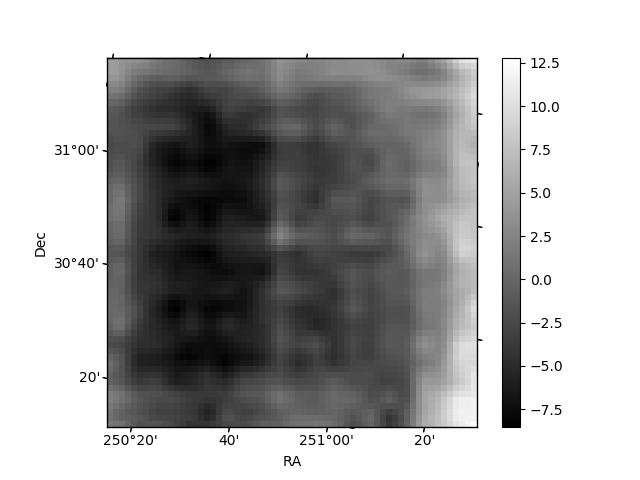
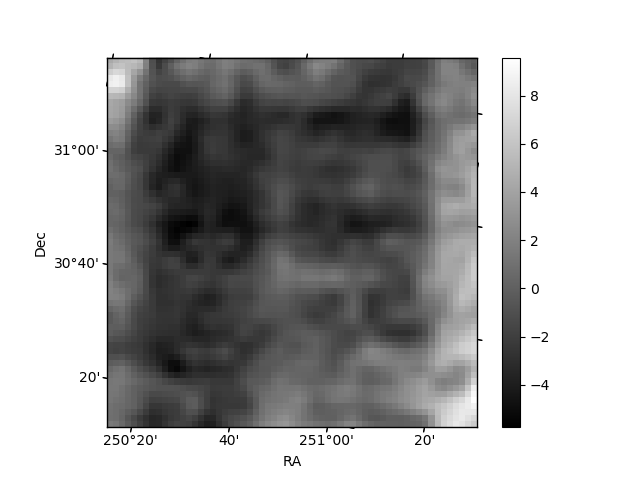
Histogram calculated using DETX and DETY for each event in the final _common_clean file
| Quadrant A | 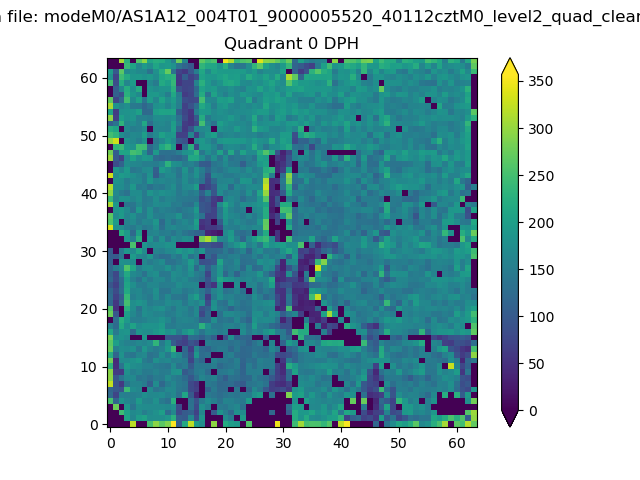 |
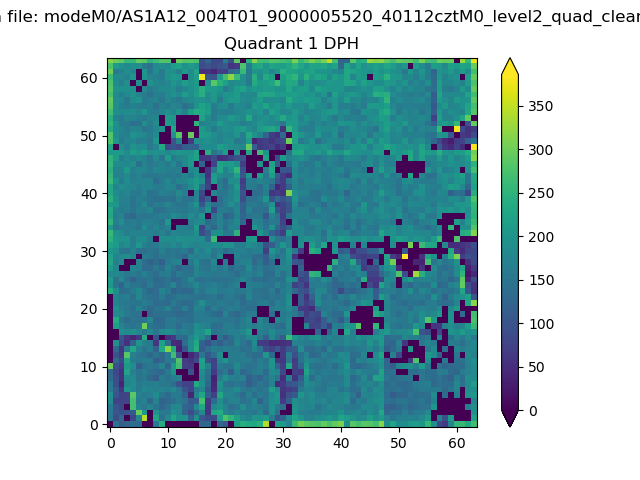 |
Quadrant B |
|---|---|---|---|
| Quadrant D | 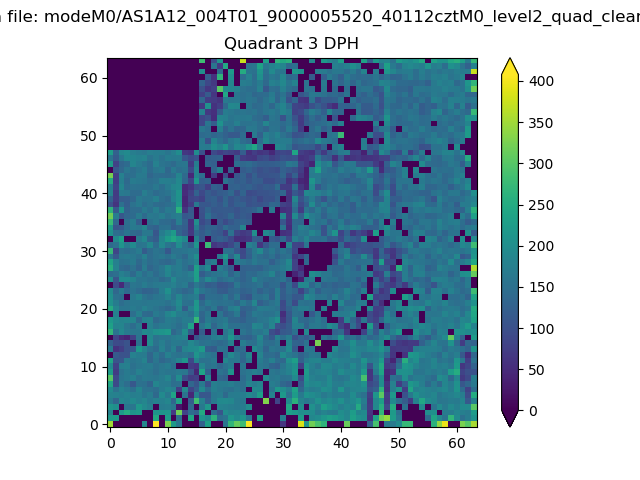 |
 |
Quadrant C |
| Plot type | Count rate plots | Images |
|---|---|---|
| Comparison with Poisson distribution Blue bars denote a histogram of data divided into 1 sec bins. Red curve is a Poisson curve with rate = median count rate of data. |
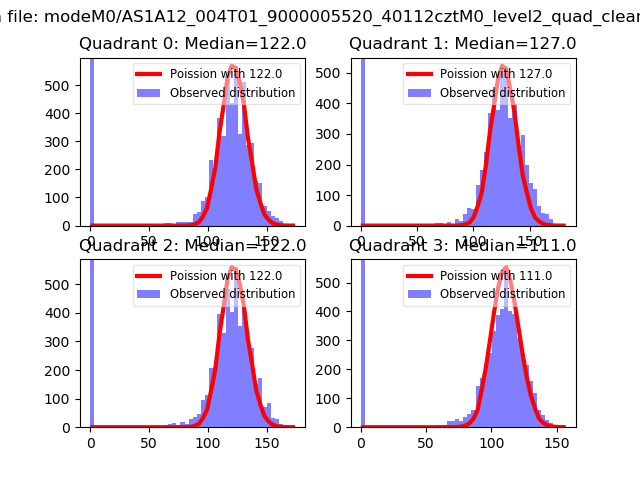 |
 |
| Quadrant-wise count rates Data is divided into 100 sec bins |
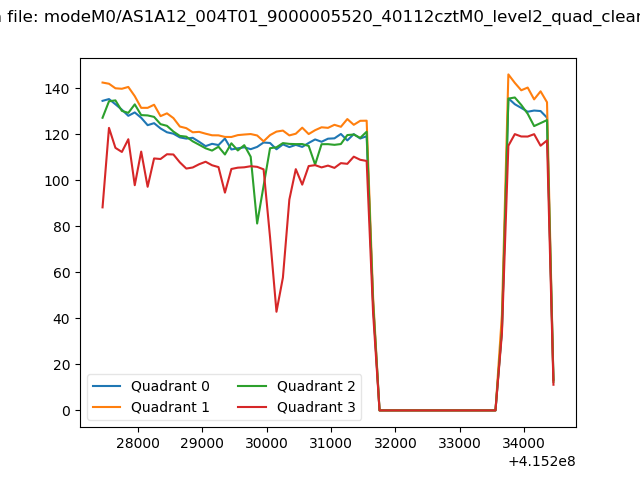 |
|
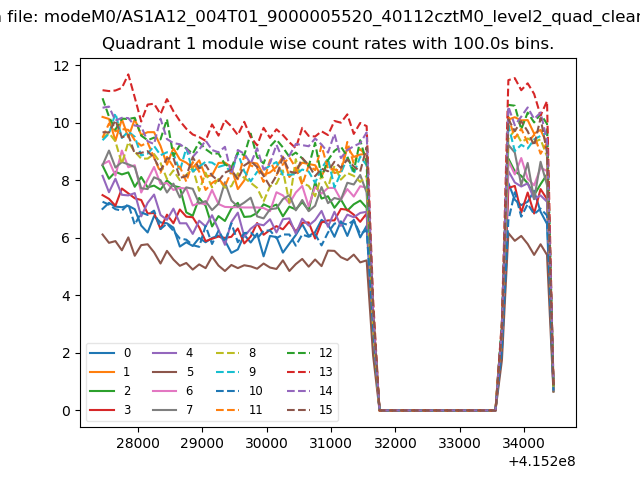
| Module-wise count rates for Quadrant A Data is divided into 100 sec bins |
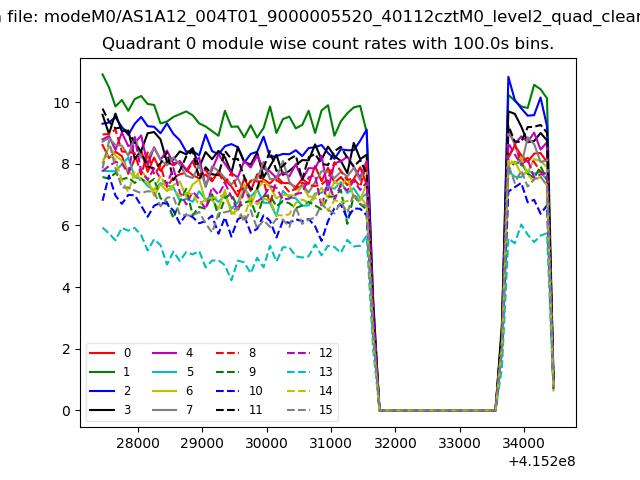 |
 |
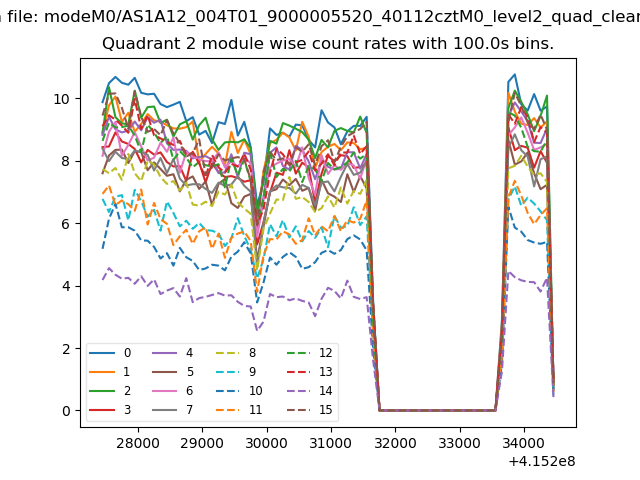
| Module-wise count rates for Quadrant B Data is divided into 100 sec bins |
 |
 |
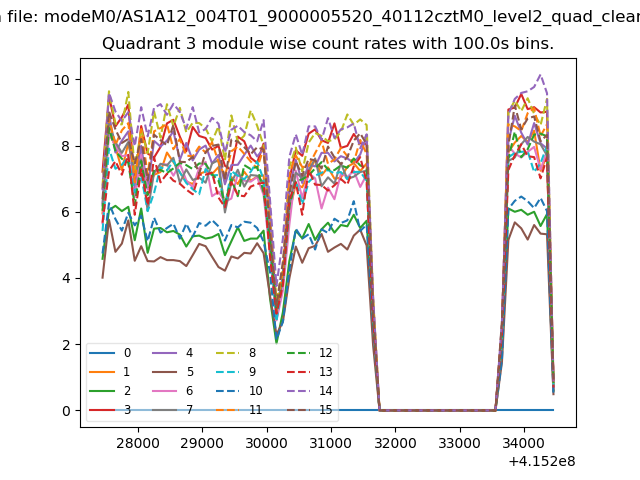
| Module-wise count rates for Quadrant C Data is divided into 100 sec bins |
 |
 |
| Module-wise count rates for Quadrant D Data is divided into 100 sec bins |
 |
 |
| Parameter | Plot |
|---|---|
| CZT HV Monitor | 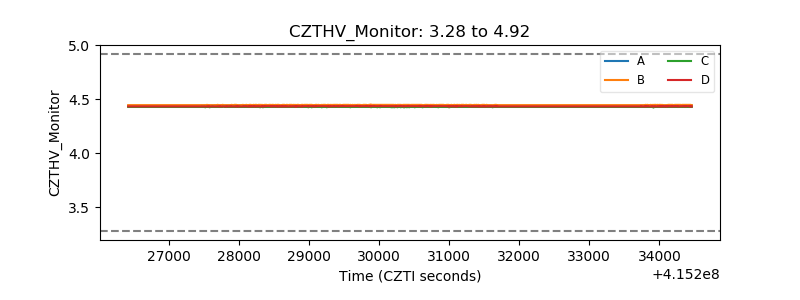 |
| D_VDD | 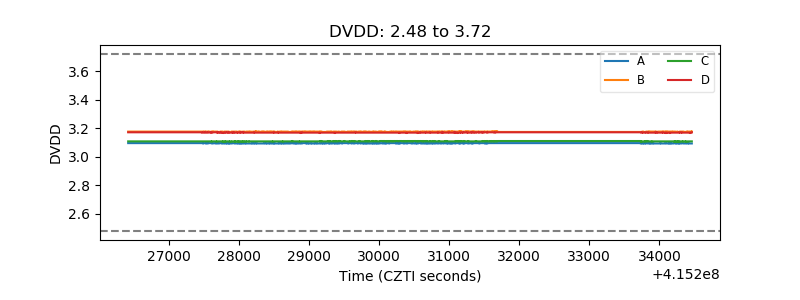 |
| Temperature 1 | 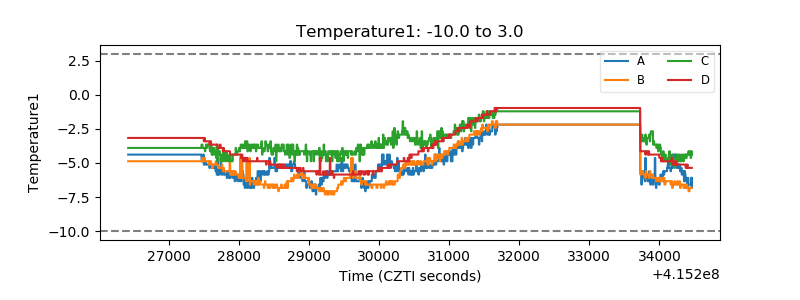 |
| Veto HV Monitor |  |
| Veto LLD | 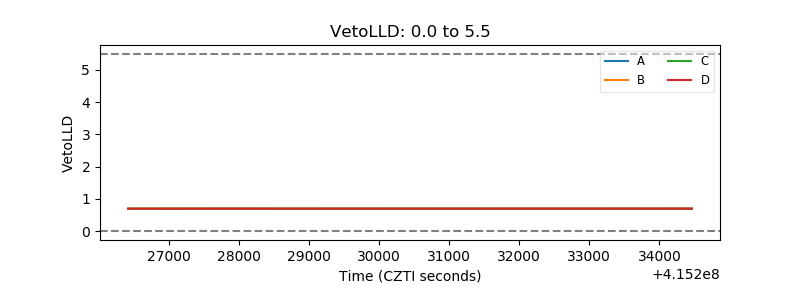 |
| Alpha Counter | 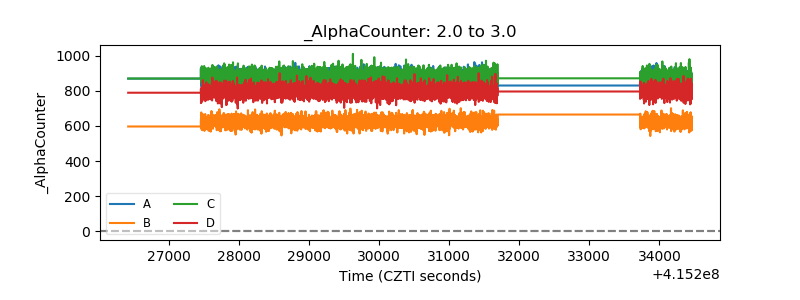 |
| _CPM_Rate | 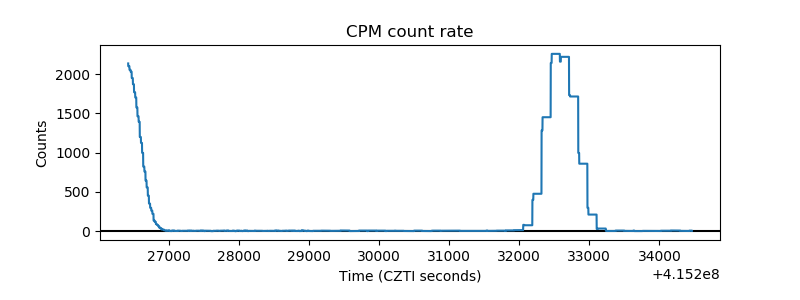 |
| CZT Counter | 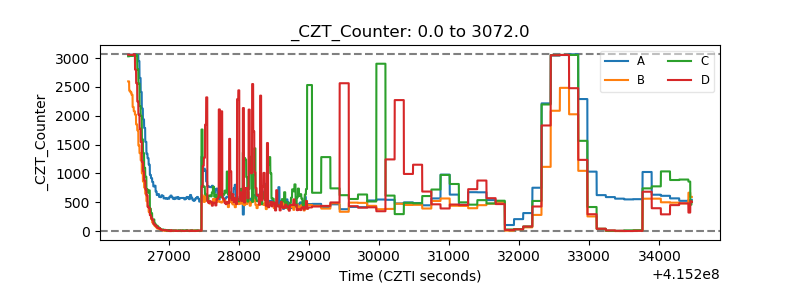 |
| +2.5 Volts monitor | 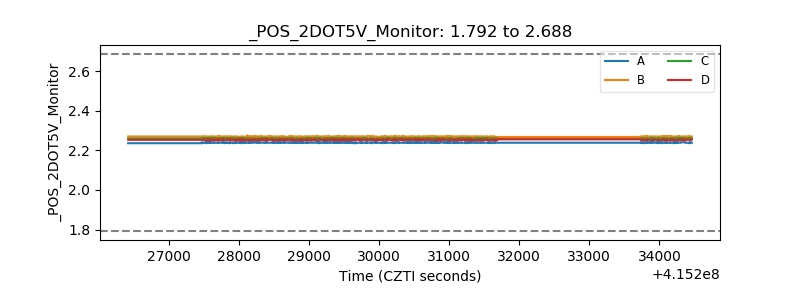 |
| +5 Volts monitor | 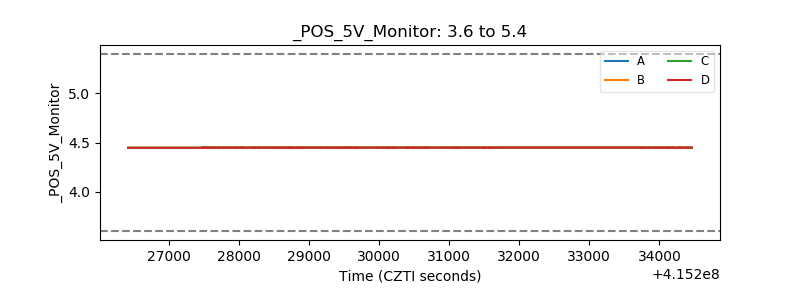 |
| _ROLL_ROT | 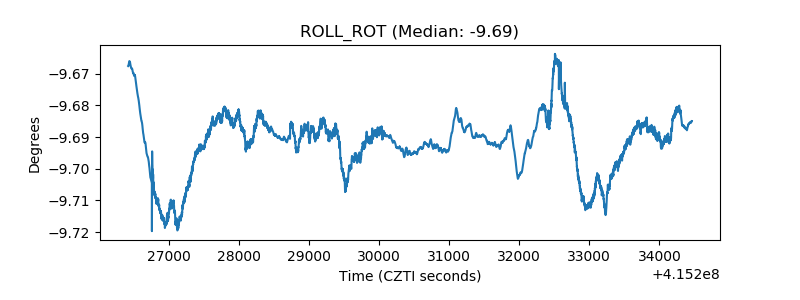 |
| _Roll_DEC | 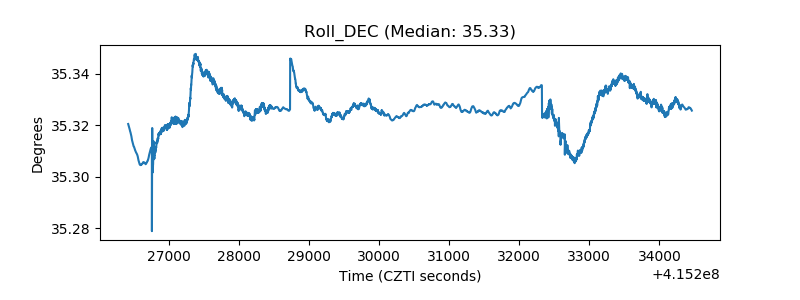 |
| _Roll_RA | 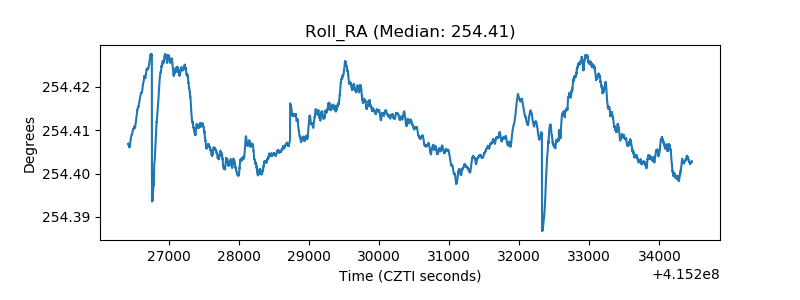 |
| Veto Counter | 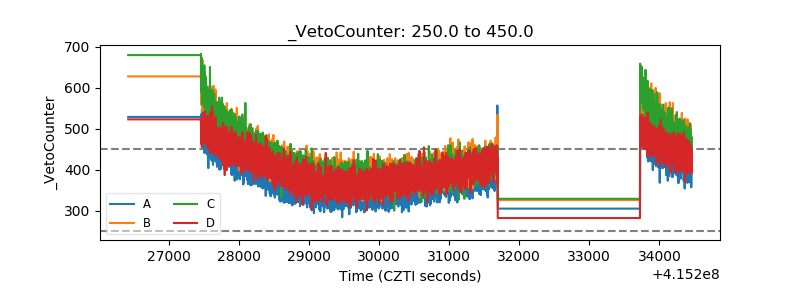 |