| Param | Original file | Final file |
|---|---|---|
| Filename | modeM0/AS1A12_004T01_9000005520_40113cztM0_level2.fits | modeM0/AS1A12_004T01_9000005520_40113cztM0_level2_quad_clean.evt |
| Size (bytes) | 347,927,040 | 86,333,760 |
| Size | 331.8 MB | 82.3 MB |
| Events in quadrant A | 2,677,147 | 584,575 |
| Events in quadrant B | 2,504,074 | 613,598 |
| Events in quadrant C | 4,384,659 | 553,892 |
| Events in quadrant D | 2,935,685 | 522,367 |
| Mode M0 | |||
|---|---|---|---|
| Quadrant | BADHDUFLAG | Total packets | Discarded packets |
| A | 0 | 10994 | 3 |
| B | 0 | 10726 | 2 |
| C | 0 | 16254 | 2 |
| D | 0 | 12249 | 2 |
| Mode M9 | |||
|---|---|---|---|
| Quadrant | BADHDUFLAG | Total packets | Discarded packets |
| A | 0 | 32 | 0 |
| B | 0 | 32 | 0 |
| C | 0 | 32 | 0 |
| D | 0 | 33 | 0 |
| Mode SS | |||
|---|---|---|---|
| Quadrant | BADHDUFLAG | Total packets | Discarded packets |
| A | 0 | 98 | 0 |
| B | 0 | 98 | 0 |
| C | 0 | 98 | 0 |
| D | 0 | 98 | 0 |
| Quadrant | Total seconds | Saturated seconds | Saturation percentage |
|---|---|---|---|
| A | 4847 | 10 | 0.206313% |
| B | 4847 | 43 | 0.887147% |
| C | 4847 | 371 | 7.654219% |
| D | 4847 | 134 | 2.764597% |
Noise dominated data is calculated using 1-second bins in cleaned event files. If a bin has >2000 counts, and if more than 50% of those come from <1% of pixels, then it is considered to be noise-dominated and hence unusable.
| Quadrant | # 1 sec bins | Bins with >0 counts | Bins with >2000 counts | High rate bins dominated by noise | Noise dominated (total time) | Noise dominated (detector-on time) | Marked lightcurve |
|---|---|---|---|---|---|---|---|
| A | 6969 | 4848 | 4 | 4 | 0.06% | 0.08% | 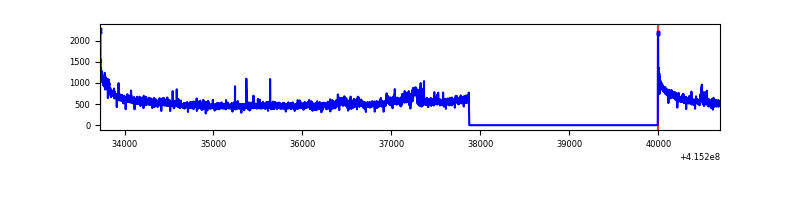 |
| B | 6969 | 4848 | 19 | 19 | 0.27% | 0.39% | 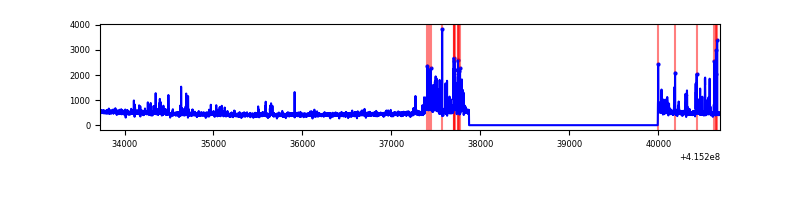 |
| C | 6969 | 4848 | 370 | 370 | 5.31% | 7.63% | 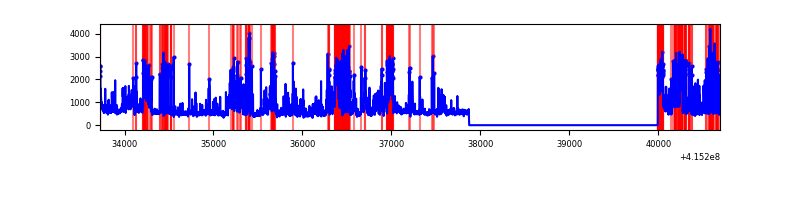 |
| D | 6969 | 4848 | 124 | 124 | 1.78% | 2.56% | 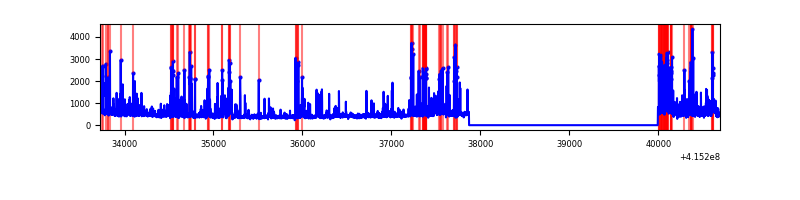 |
Top three noisy pixels from each quadrant. If the there are fewer than three noisy pixels in the level2.evt file, extra rows are filled as -1
| Pixel properties | Quadrant properties | ||||||
|---|---|---|---|---|---|---|---|
| Quadrant | DetID | PixID | Counts | Sigma | Mean | Median | Sigma |
| A | 10 | 83 | 431014 | 3898.45 | 543 | 532 | 110.4 |
| A | 12 | 189 | 96605 | 870.04 | 543 | 532 | 110.4 |
| A | 2 | 79 | 26552 | 235.64 | 543 | 532 | 110.4 |
| B | 5 | 255 | 192785 | 1845.13 | 547 | 532 | 104.2 |
| B | 4 | 171 | 71127 | 677.53 | 547 | 532 | 104.2 |
| B | 5 | 172 | 53090 | 504.42 | 547 | 532 | 104.2 |
| C | 9 | 187 | 2080453 | 17004.3 | 524 | 528 | 122.3 |
| C | 15 | 214 | 195334 | 1592.62 | 524 | 528 | 122.3 |
| C | 0 | 10 | 41160 | 332.18 | 524 | 528 | 122.3 |
| D | 12 | 227 | 272889 | 2114.45 | 525 | 511 | 128.8 |
| D | 2 | 249 | 236147 | 1829.23 | 525 | 511 | 128.8 |
| D | 13 | 249 | 173204 | 1340.6 | 525 | 511 | 128.8 |
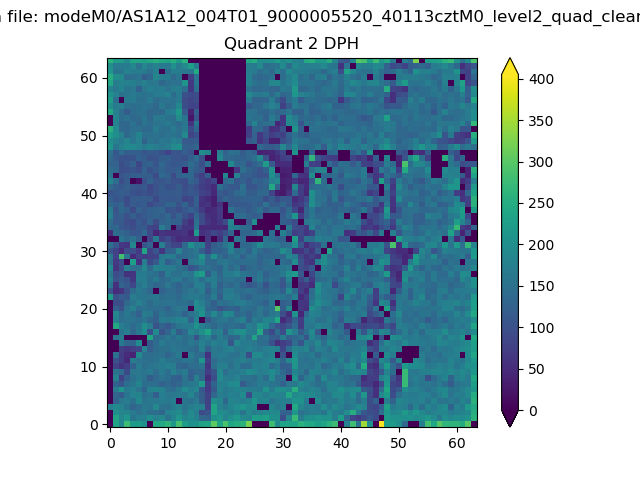
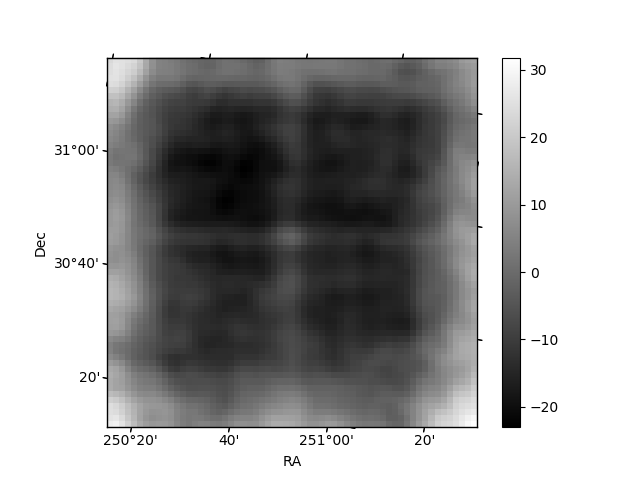
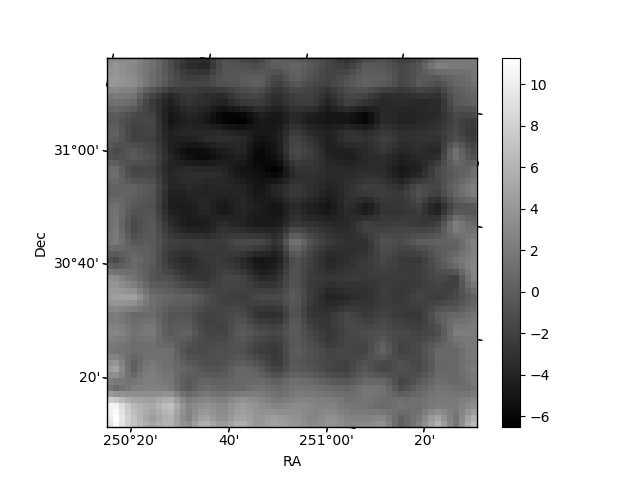
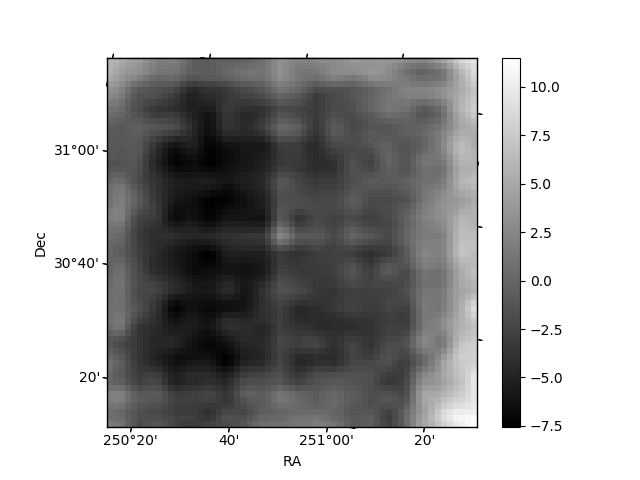
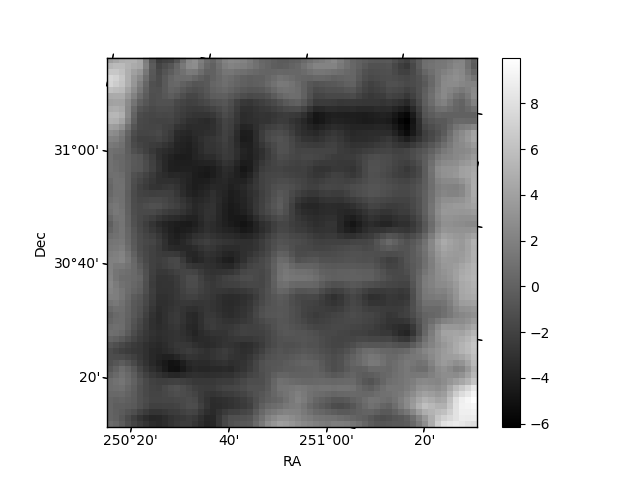
Histogram calculated using DETX and DETY for each event in the final _common_clean file
| Quadrant A | 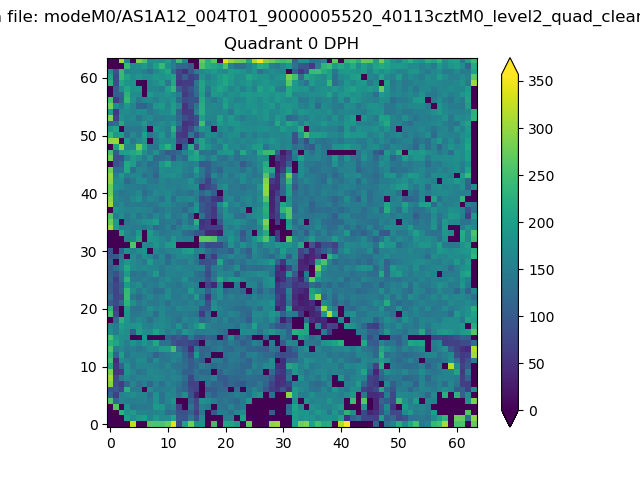 |
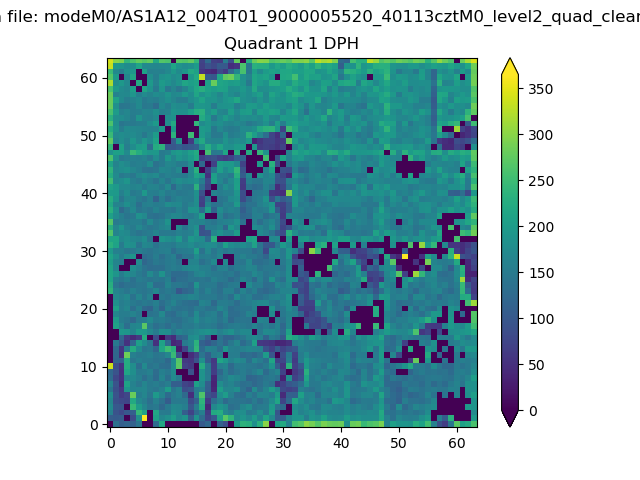 |
Quadrant B |
|---|---|---|---|
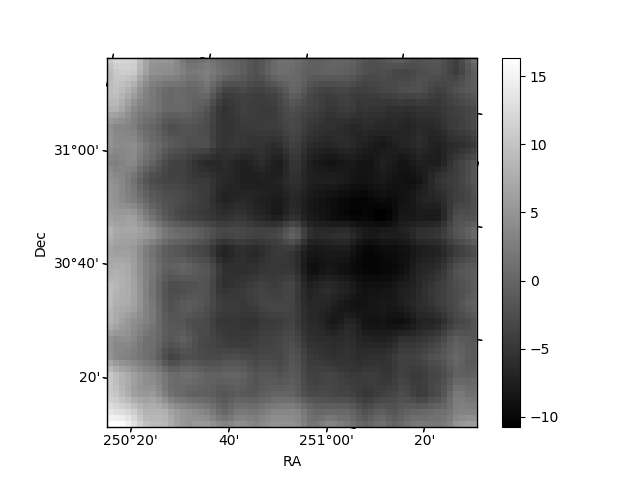
| Quadrant D | 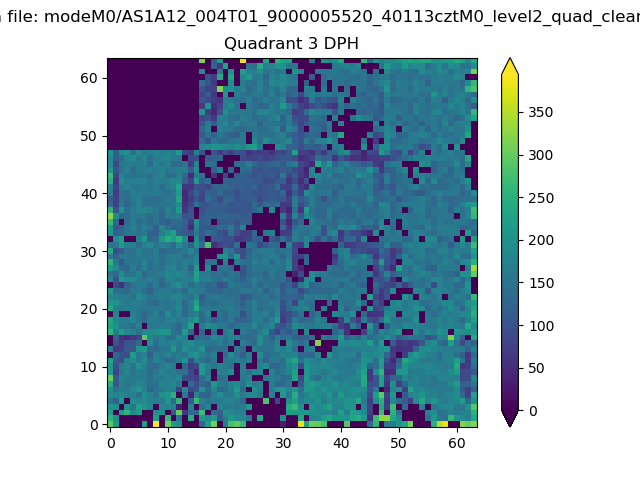 |
 |
Quadrant C |
| Plot type | Count rate plots | Images |
|---|---|---|
| Comparison with Poisson distribution Blue bars denote a histogram of data divided into 1 sec bins. Red curve is a Poisson curve with rate = median count rate of data. |
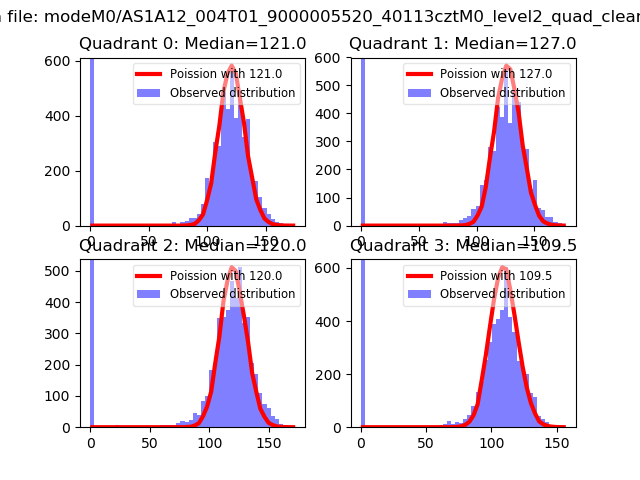 |
 |
| Quadrant-wise count rates Data is divided into 100 sec bins |
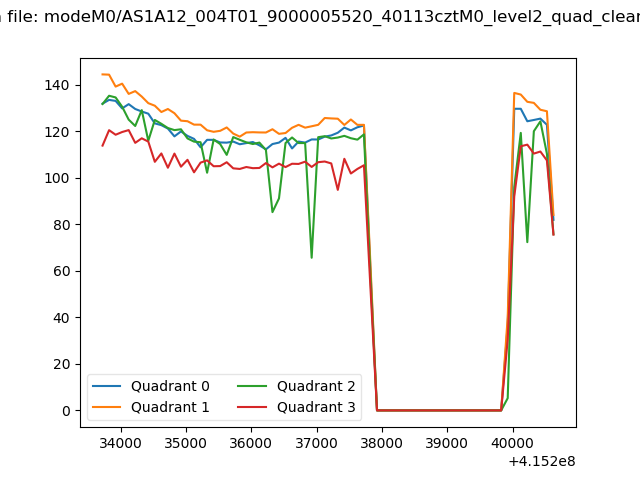 |
|
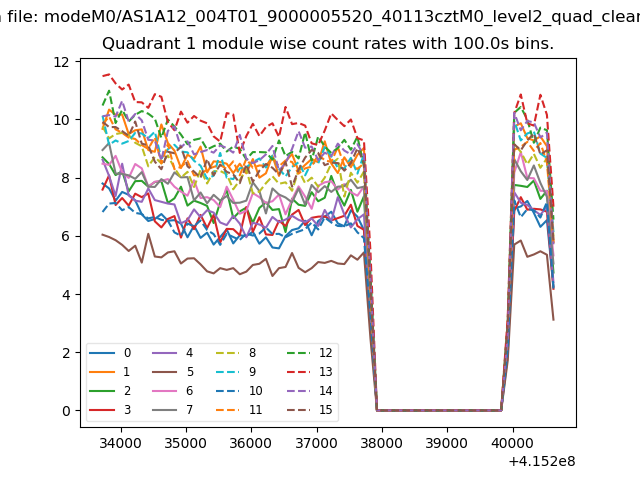
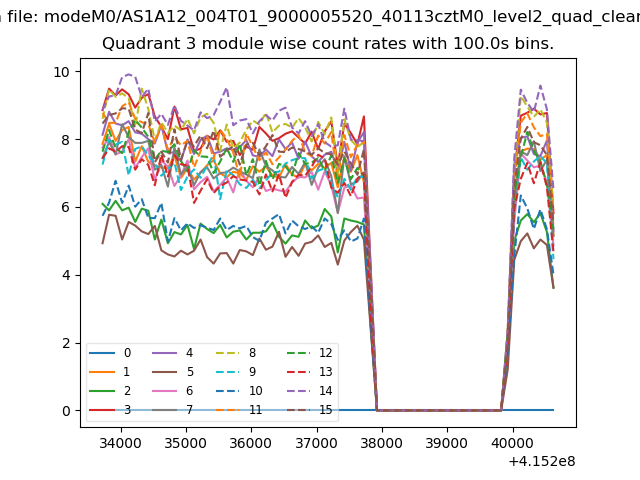
| Module-wise count rates for Quadrant A Data is divided into 100 sec bins |
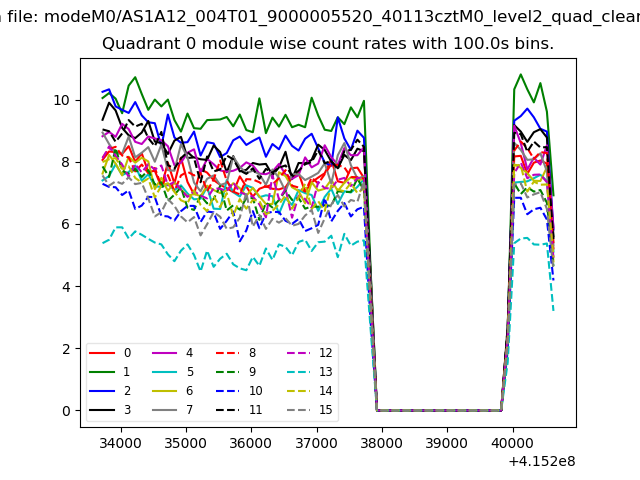 |
 |
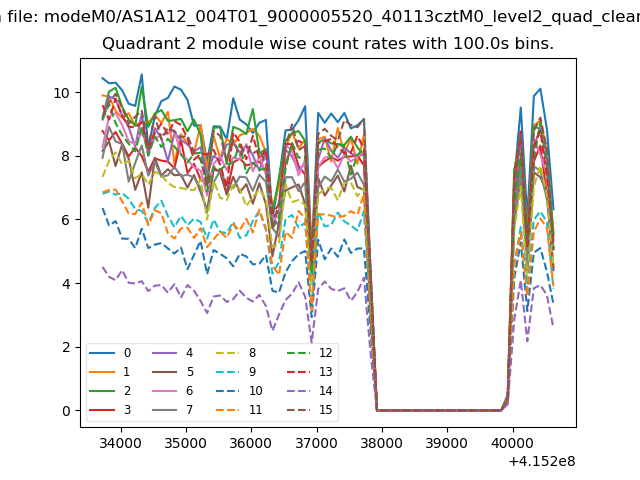
| Module-wise count rates for Quadrant B Data is divided into 100 sec bins |
 |
 |
| Module-wise count rates for Quadrant C Data is divided into 100 sec bins |
 |
 |
| Module-wise count rates for Quadrant D Data is divided into 100 sec bins |
 |
 |
| Parameter | Plot |
|---|---|
| CZT HV Monitor | 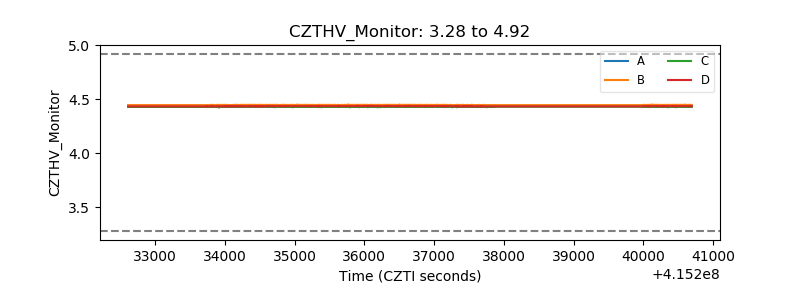 |
| D_VDD | 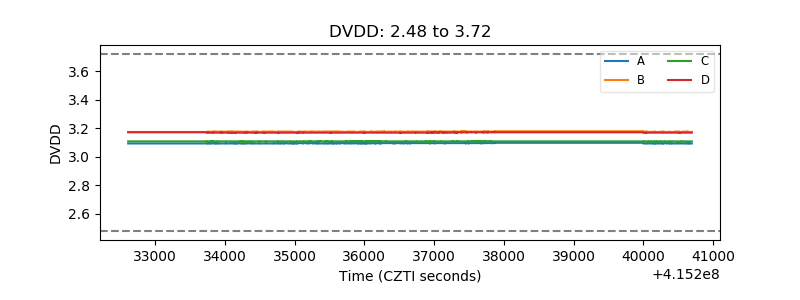 |
| Temperature 1 | 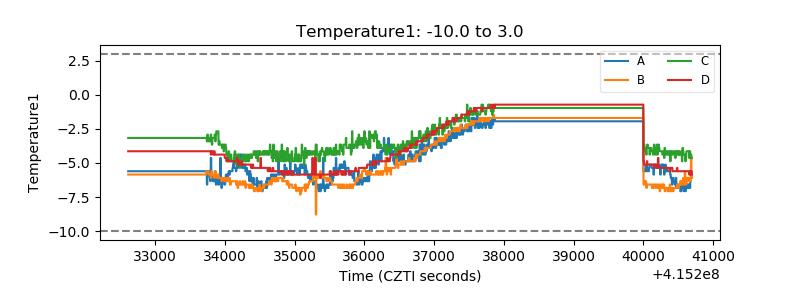 |
| Veto HV Monitor | 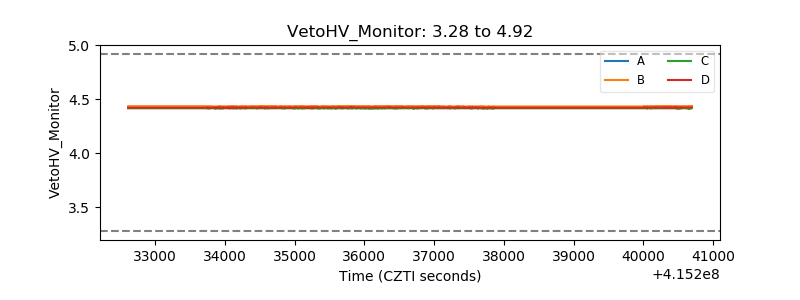 |
| Veto LLD | 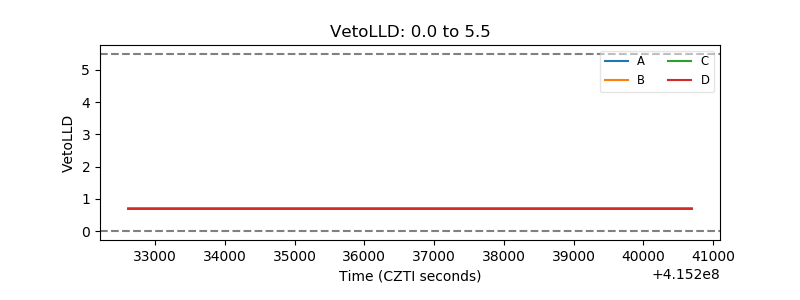 |
| Alpha Counter | 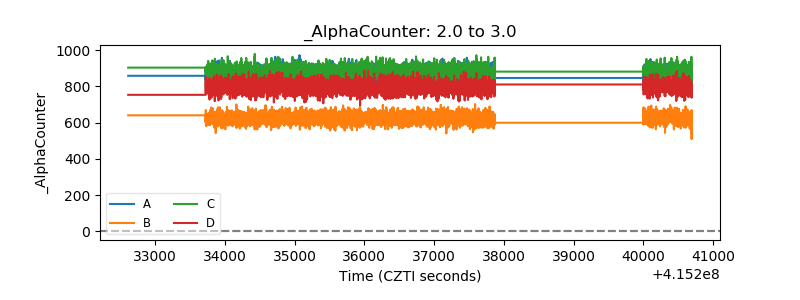 |
| _CPM_Rate | 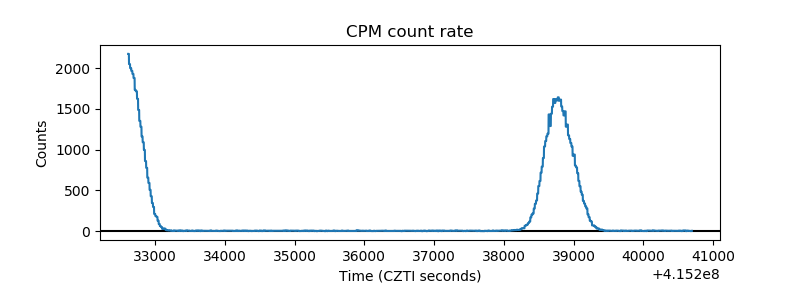 |
| CZT Counter | 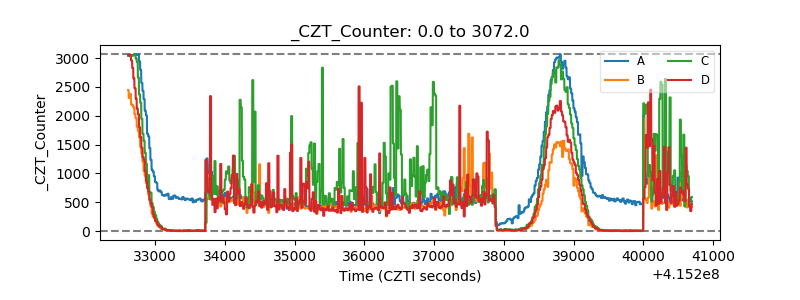 |
| +2.5 Volts monitor | 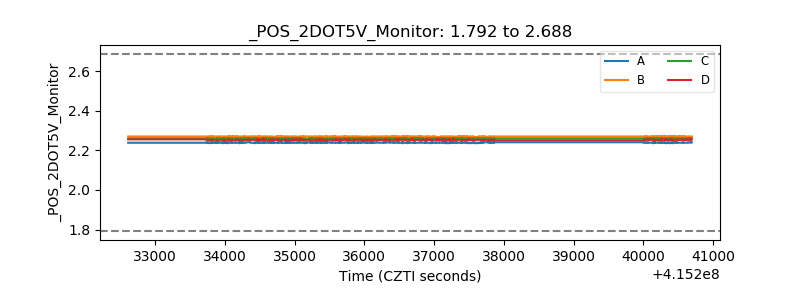 |
| +5 Volts monitor | 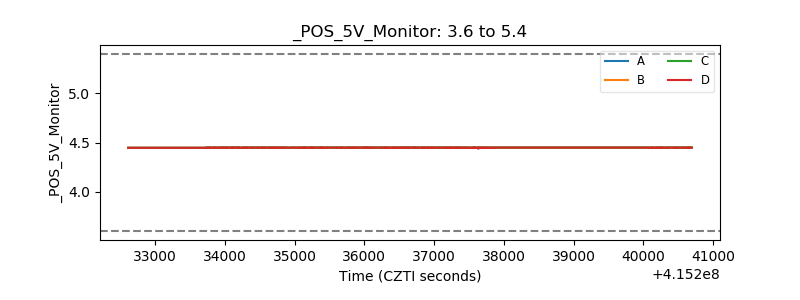 |
| _ROLL_ROT | 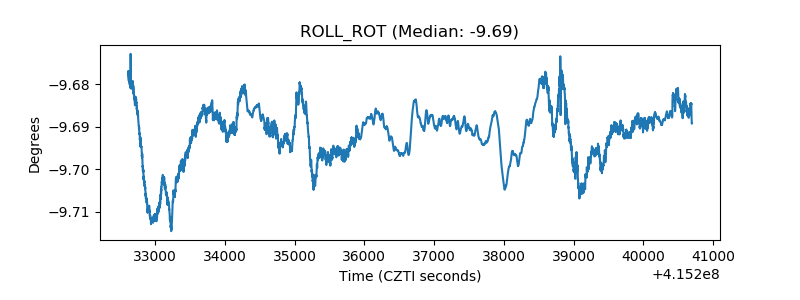 |
| _Roll_DEC | 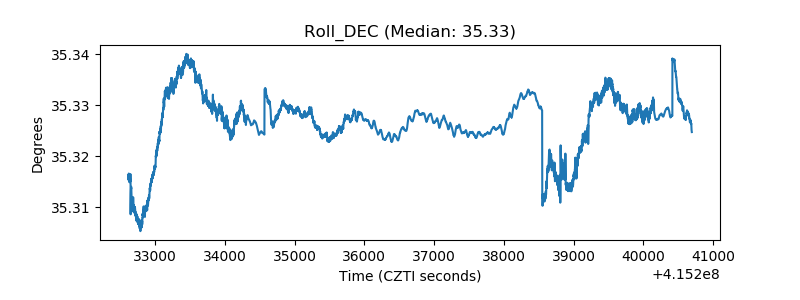 |
| _Roll_RA | 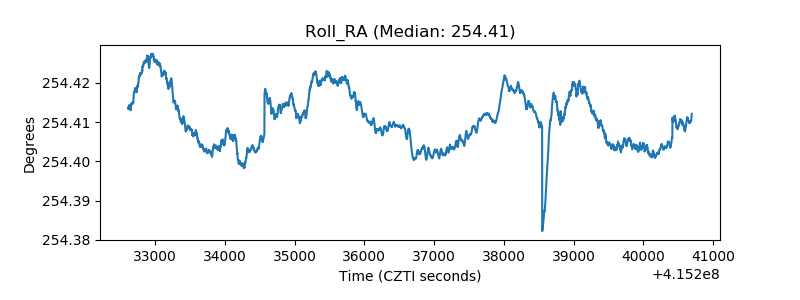 |
| Veto Counter | 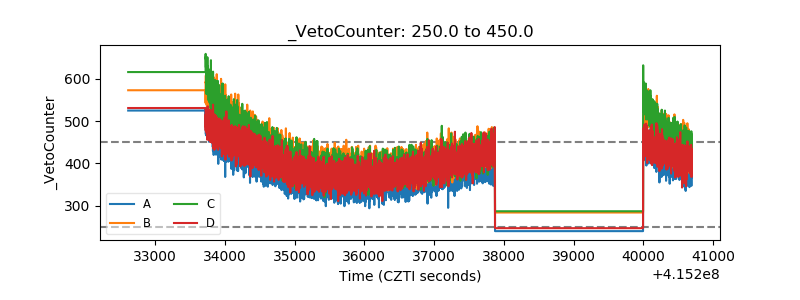 |