| Param | Original file | Final file |
|---|---|---|
| Filename | modeM0/AS1A12_004T01_9000005520_40114cztM0_level2.fits | modeM0/AS1A12_004T01_9000005520_40114cztM0_level2_quad_clean.evt |
| Size (bytes) | 397,224,000 | 80,830,080 |
| Size | 378.8 MB | 77.1 MB |
| Events in quadrant A | 2,572,721 | 559,751 |
| Events in quadrant B | 2,541,885 | 585,019 |
| Events in quadrant C | 5,619,726 | 490,595 |
| Events in quadrant D | 3,595,134 | 474,375 |
| Mode M0 | |||
|---|---|---|---|
| Quadrant | BADHDUFLAG | Total packets | Discarded packets |
| A | 0 | 10669 | 3 |
| B | 0 | 10835 | 2 |
| C | 0 | 20097 | 2 |
| D | 0 | 14256 | 2 |
| Mode M9 | |||
|---|---|---|---|
| Quadrant | BADHDUFLAG | Total packets | Discarded packets |
| A | 0 | 36 | 0 |
| B | 0 | 36 | 0 |
| C | 0 | 36 | 0 |
| D | 0 | 37 | 0 |
| Mode SS | |||
|---|---|---|---|
| Quadrant | BADHDUFLAG | Total packets | Discarded packets |
| A | 0 | 98 | 0 |
| B | 0 | 98 | 0 |
| C | 0 | 98 | 0 |
| D | 0 | 98 | 0 |
| Quadrant | Total seconds | Saturated seconds | Saturation percentage |
|---|---|---|---|
| A | 4813 | 8 | 0.166216% |
| B | 4813 | 55 | 1.142738% |
| C | 4813 | 766 | 15.915230% |
| D | 4813 | 407 | 8.456264% |
Noise dominated data is calculated using 1-second bins in cleaned event files. If a bin has >2000 counts, and if more than 50% of those come from <1% of pixels, then it is considered to be noise-dominated and hence unusable.
| Quadrant | # 1 sec bins | Bins with >0 counts | Bins with >2000 counts | High rate bins dominated by noise | Noise dominated (total time) | Noise dominated (detector-on time) | Marked lightcurve |
|---|---|---|---|---|---|---|---|
| A | 6965 | 4814 | 4 | 4 | 0.06% | 0.08% | 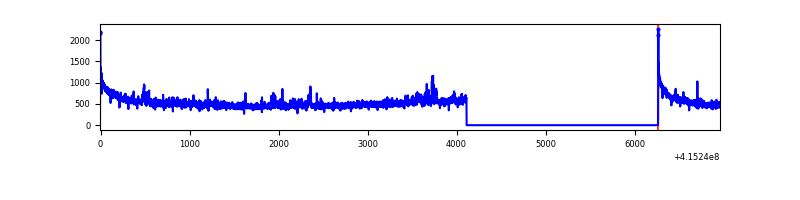 |
| B | 6965 | 4814 | 39 | 39 | 0.56% | 0.81% | 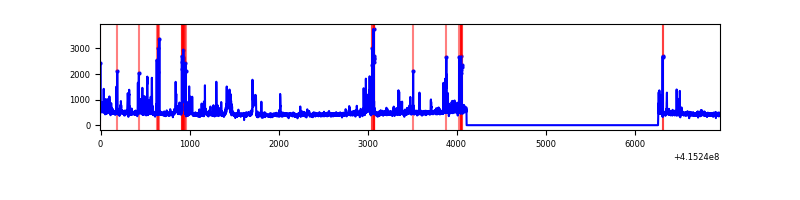 |
| C | 6965 | 4814 | 754 | 754 | 10.83% | 15.66% | 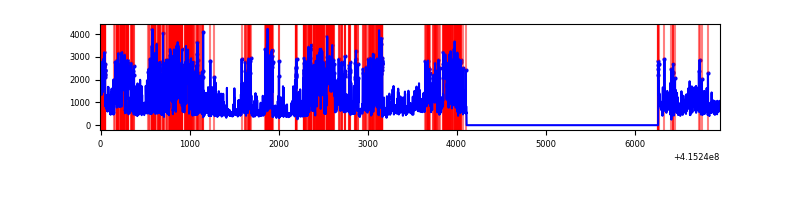 |
| D | 6965 | 4814 | 390 | 390 | 5.60% | 8.10% | 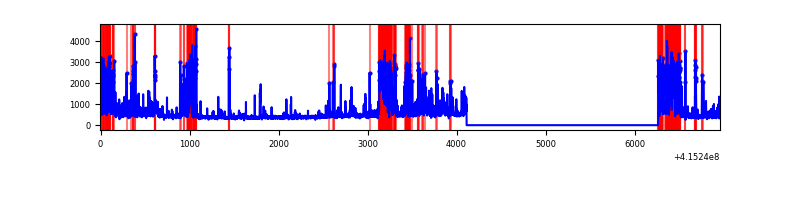 |
Top three noisy pixels from each quadrant. If the there are fewer than three noisy pixels in the level2.evt file, extra rows are filled as -1
| Pixel properties | Quadrant properties | ||||||
|---|---|---|---|---|---|---|---|
| Quadrant | DetID | PixID | Counts | Sigma | Mean | Median | Sigma |
| A | 10 | 83 | 420317 | 3939.73 | 525 | 516 | 106.6 |
| A | 12 | 189 | 98391 | 918.53 | 525 | 516 | 106.6 |
| A | 15 | 223 | 14012 | 126.66 | 525 | 516 | 106.6 |
| B | 5 | 255 | 243105 | 2380.48 | 529 | 514 | 101.9 |
| B | 4 | 171 | 99432 | 970.65 | 529 | 514 | 101.9 |
| B | 5 | 172 | 90823 | 886.18 | 529 | 514 | 101.9 |
| C | 9 | 187 | 3461207 | 30295.11 | 486 | 489 | 114.2 |
| C | 15 | 214 | 190732 | 1665.38 | 486 | 489 | 114.2 |
| C | 0 | 10 | 49479 | 428.85 | 486 | 489 | 114.2 |
| D | 12 | 227 | 1000207 | 8343.41 | 491 | 479 | 119.8 |
| D | 2 | 249 | 271951 | 2265.62 | 491 | 479 | 119.8 |
| D | 2 | 250 | 192025 | 1598.58 | 491 | 479 | 119.8 |
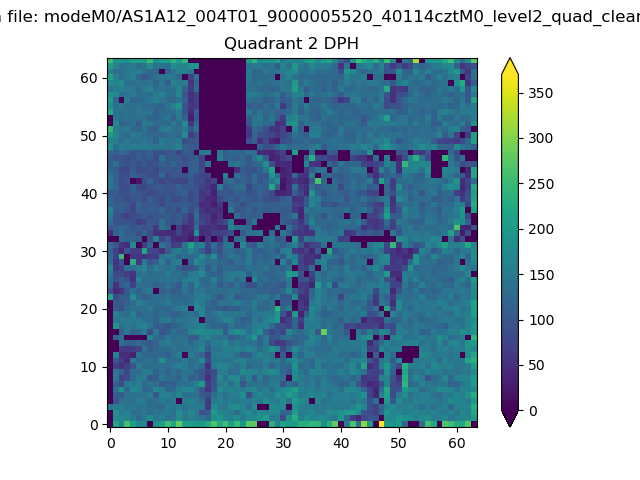
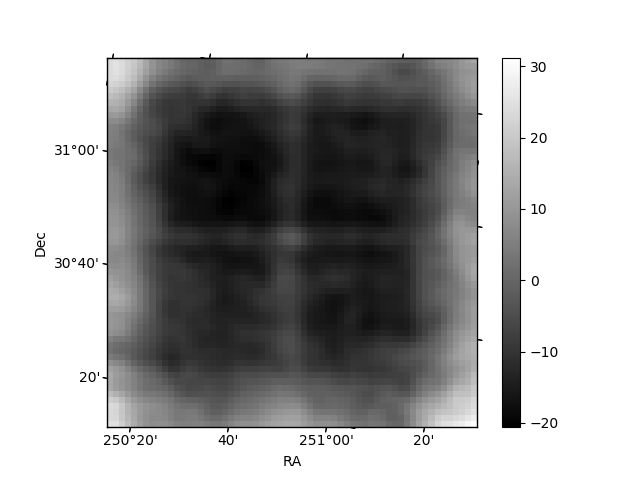
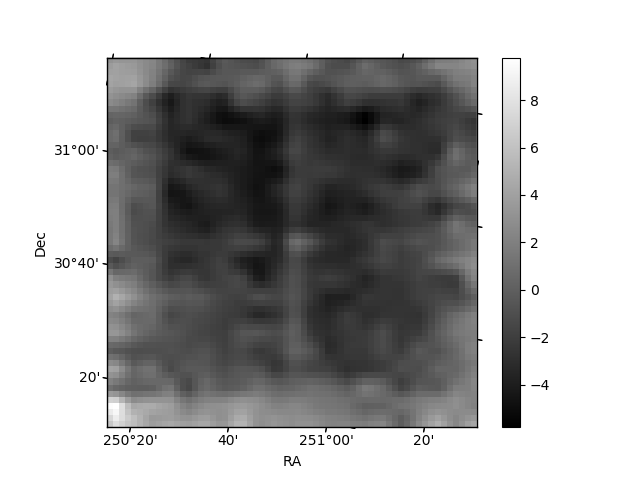
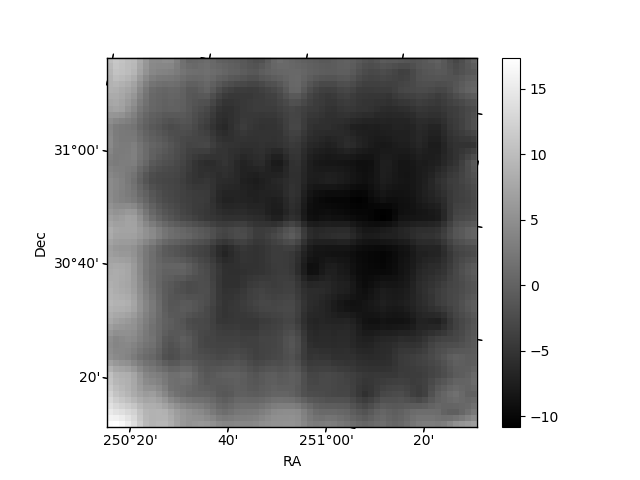
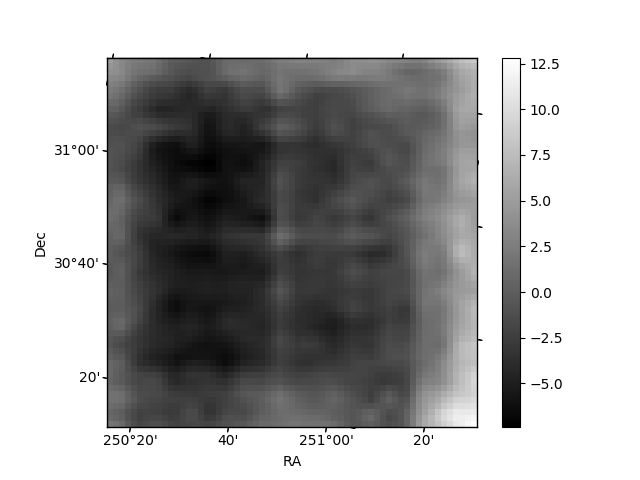
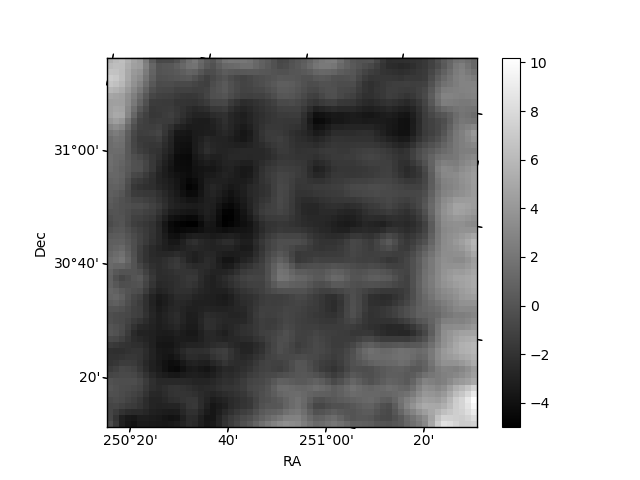
Histogram calculated using DETX and DETY for each event in the final _common_clean file
| Quadrant A | 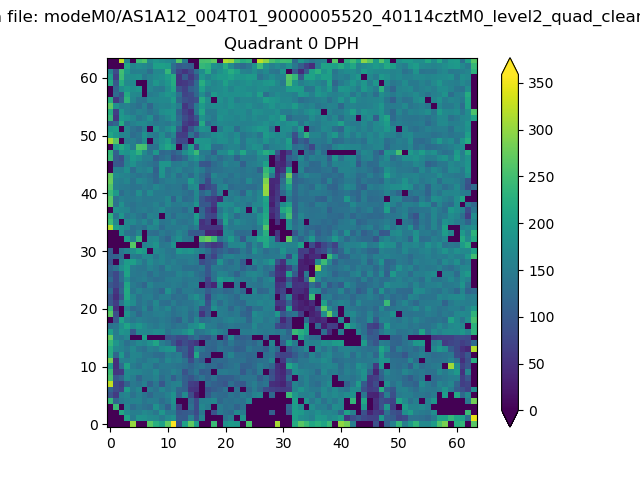 |
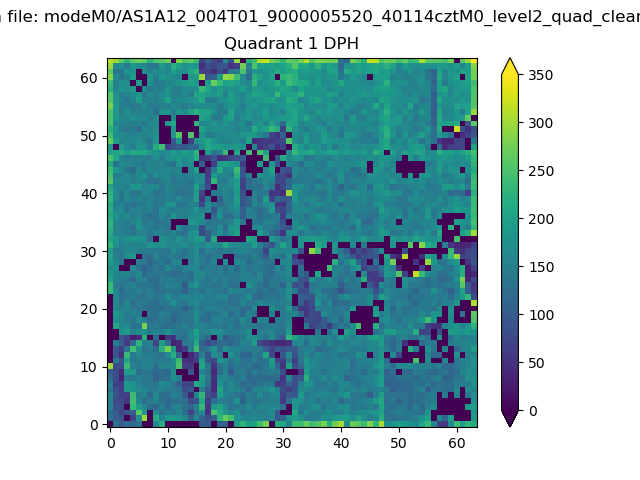 |
Quadrant B |
|---|---|---|---|
| Quadrant D | 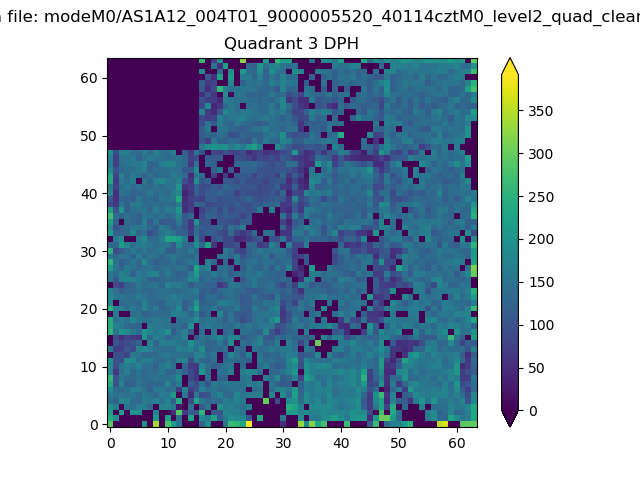 |
 |
Quadrant C |
| Plot type | Count rate plots | Images |
|---|---|---|
| Comparison with Poisson distribution Blue bars denote a histogram of data divided into 1 sec bins. Red curve is a Poisson curve with rate = median count rate of data. |
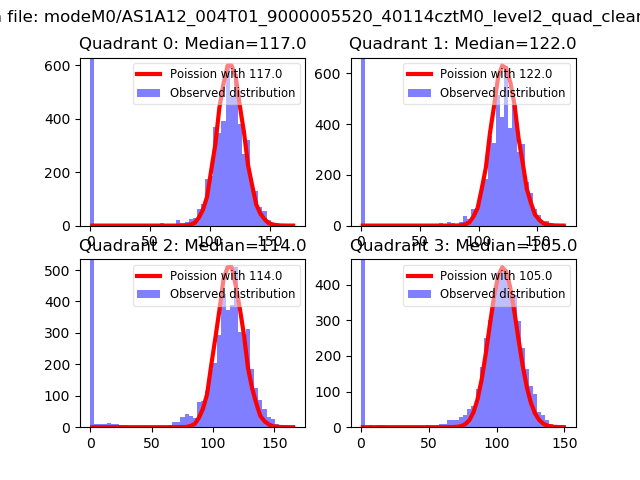 |
 |
| Quadrant-wise count rates Data is divided into 100 sec bins |
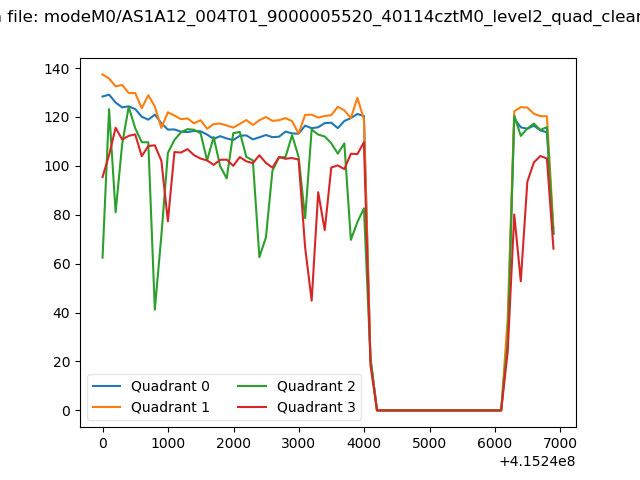 |
|
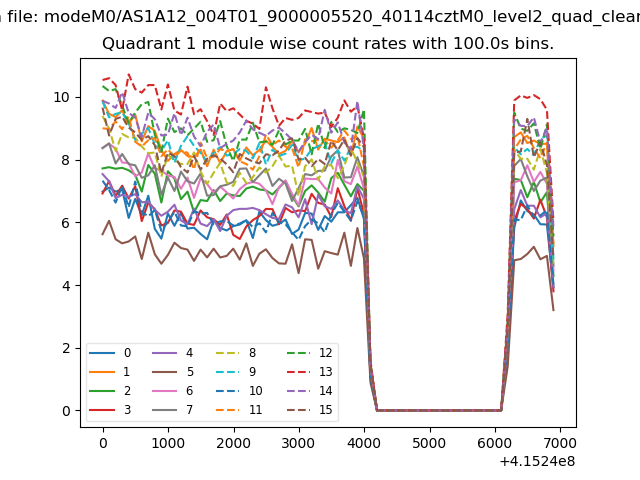
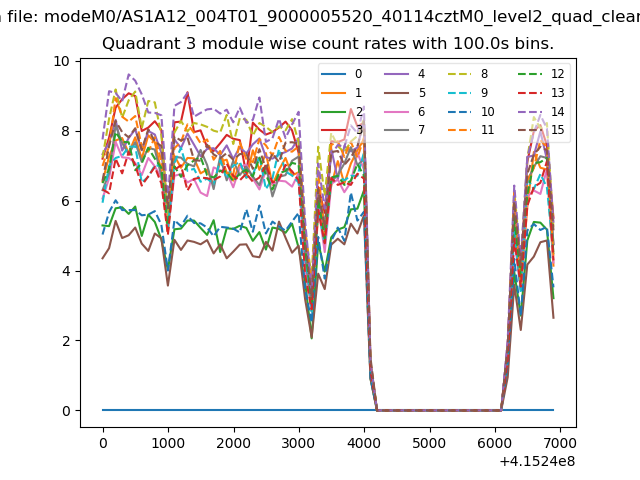
| Module-wise count rates for Quadrant A Data is divided into 100 sec bins |
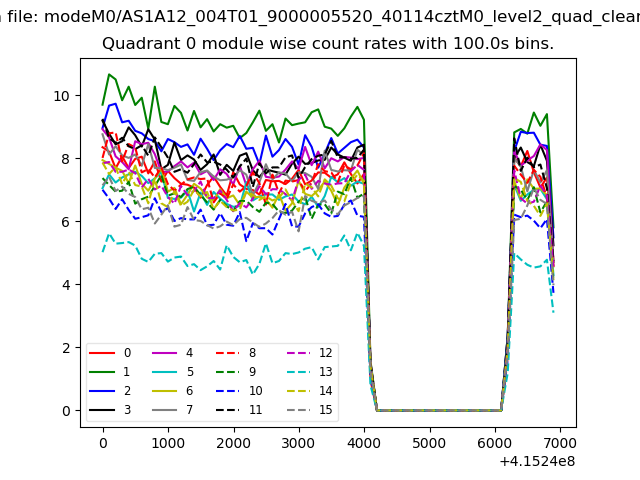 |
 |
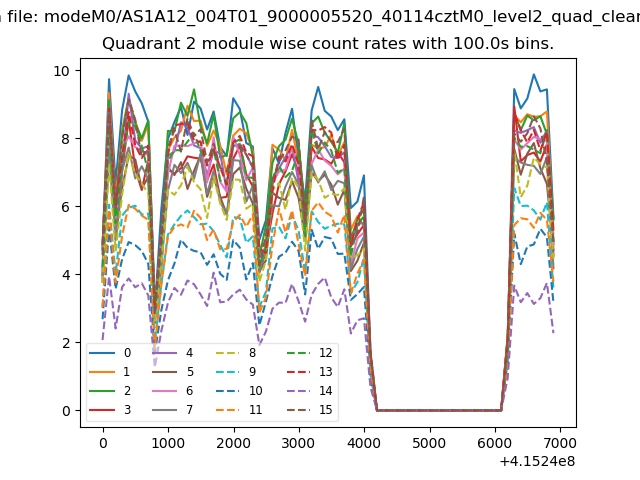
| Module-wise count rates for Quadrant B Data is divided into 100 sec bins |
 |
 |
| Module-wise count rates for Quadrant C Data is divided into 100 sec bins |
 |
 |
| Module-wise count rates for Quadrant D Data is divided into 100 sec bins |
 |
 |
| Parameter | Plot |
|---|---|
| CZT HV Monitor | 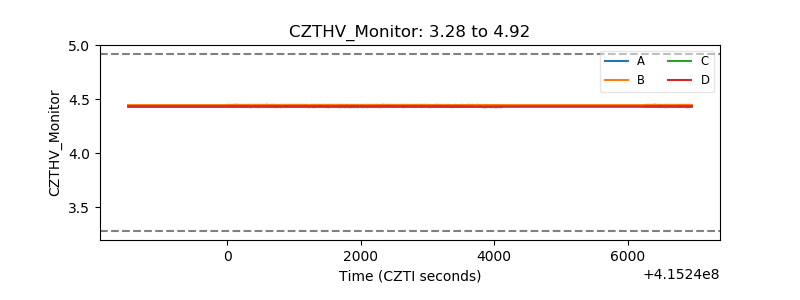 |
| D_VDD | 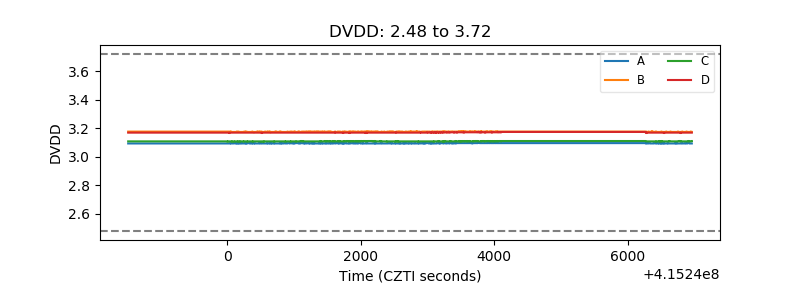 |
| Temperature 1 | 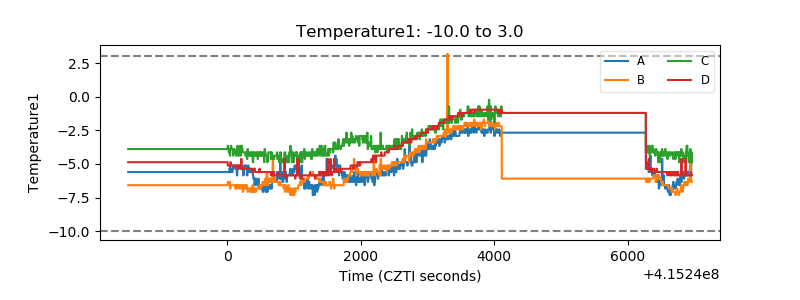 |
| Veto HV Monitor | 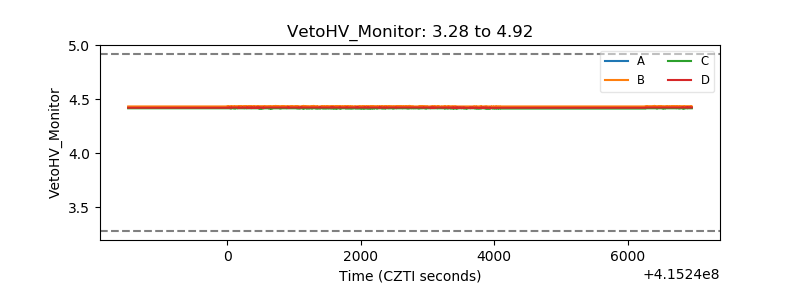 |
| Veto LLD | 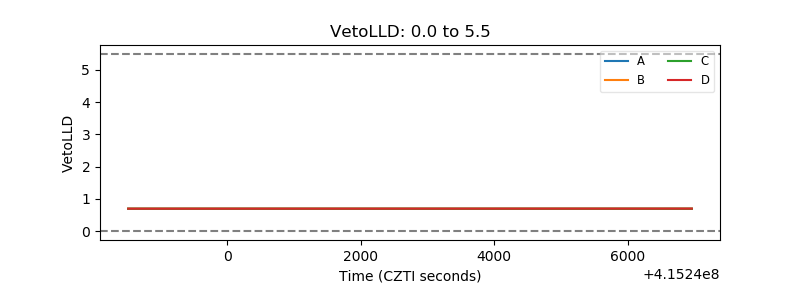 |
| Alpha Counter | 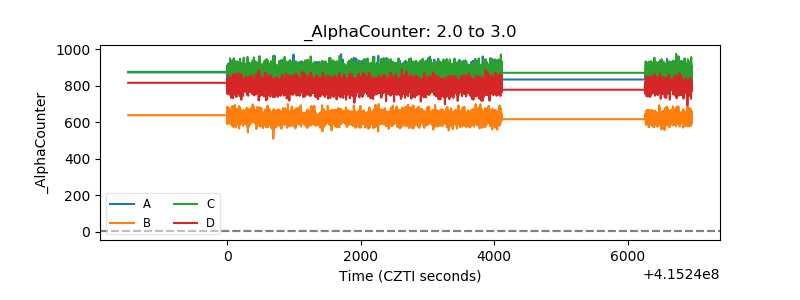 |
| _CPM_Rate | 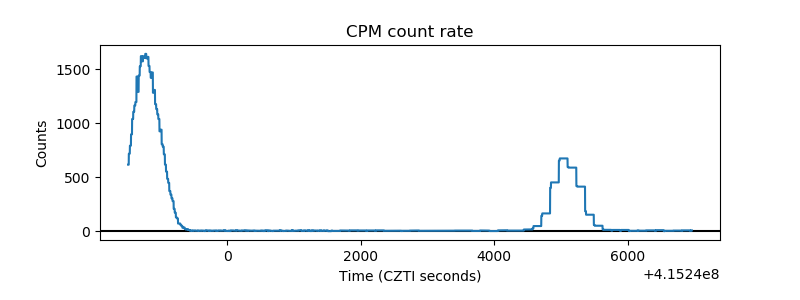 |
| CZT Counter | 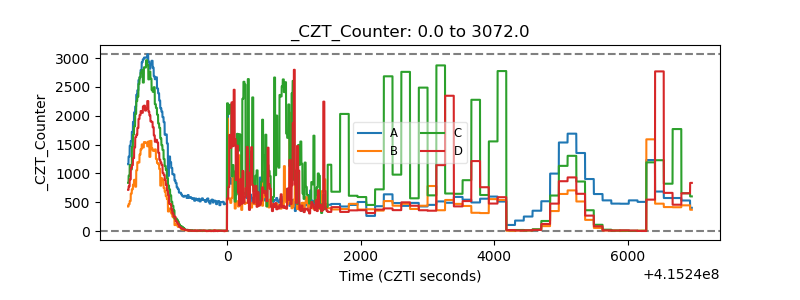 |
| +2.5 Volts monitor | 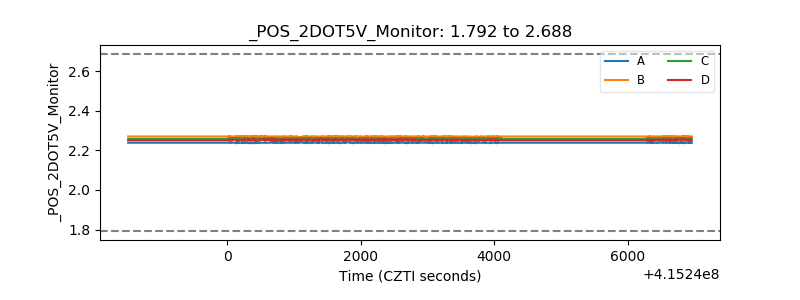 |
| +5 Volts monitor | 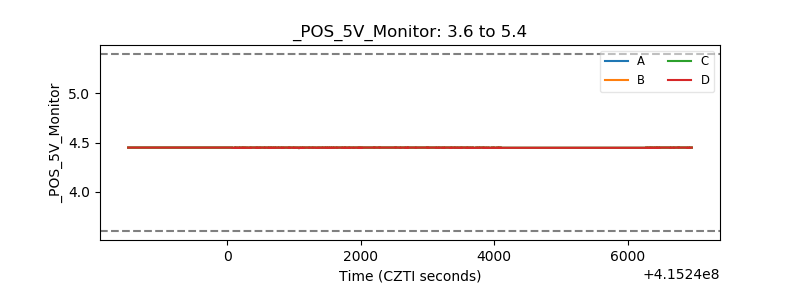 |
| _ROLL_ROT | 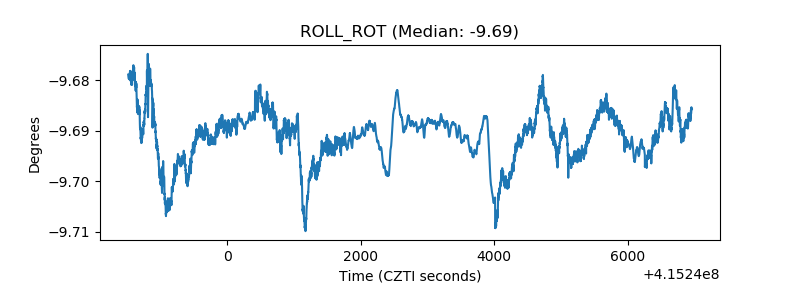 |
| _Roll_DEC |  |
| _Roll_RA | 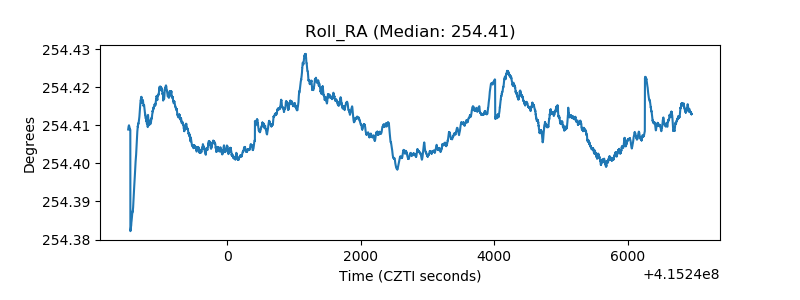 |
| Veto Counter | 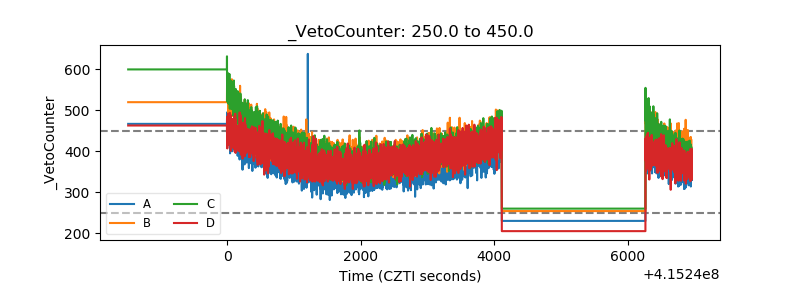 |