| Param | Original file | Final file |
|---|---|---|
| Filename | modeM0/AS1A12_004T01_9000005520_40115cztM0_level2.fits | modeM0/AS1A12_004T01_9000005520_40115cztM0_level2_quad_clean.evt |
| Size (bytes) | 388,661,760 | 87,238,080 |
| Size | 370.7 MB | 83.2 MB |
| Events in quadrant A | 2,770,396 | 593,916 |
| Events in quadrant B | 2,466,017 | 617,188 |
| Events in quadrant C | 5,457,581 | 534,533 |
| Events in quadrant D | 3,280,028 | 524,782 |
| Mode M0 | |||
|---|---|---|---|
| Quadrant | BADHDUFLAG | Total packets | Discarded packets |
| A | 0 | 11768 | 3 |
| B | 0 | 11096 | 2 |
| C | 0 | 19836 | 2 |
| D | 0 | 13645 | 2 |
| Mode M9 | |||
|---|---|---|---|
| Quadrant | BADHDUFLAG | Total packets | Discarded packets |
| A | 0 | 43 | 0 |
| B | 0 | 43 | 0 |
| C | 0 | 43 | 0 |
| D | 0 | 43 | 0 |
| Mode SS | |||
|---|---|---|---|
| Quadrant | BADHDUFLAG | Total packets | Discarded packets |
| A | 0 | 108 | 0 |
| B | 0 | 108 | 0 |
| C | 0 | 108 | 0 |
| D | 0 | 108 | 0 |
| Quadrant | Total seconds | Saturated seconds | Saturation percentage |
|---|---|---|---|
| A | 5309 | 12 | 0.226031% |
| B | 5309 | 17 | 0.320211% |
| C | 5309 | 653 | 12.299868% |
| D | 5309 | 192 | 3.616500% |
Noise dominated data is calculated using 1-second bins in cleaned event files. If a bin has >2000 counts, and if more than 50% of those come from <1% of pixels, then it is considered to be noise-dominated and hence unusable.
| Quadrant | # 1 sec bins | Bins with >0 counts | Bins with >2000 counts | High rate bins dominated by noise | Noise dominated (total time) | Noise dominated (detector-on time) | Marked lightcurve |
|---|---|---|---|---|---|---|---|
| A | 9523 | 5311 | 3 | 3 | 0.03% | 0.06% | 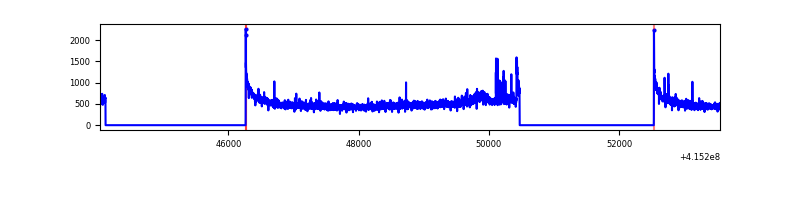 |
| B | 9523 | 5311 | 10 | 10 | 0.11% | 0.19% | 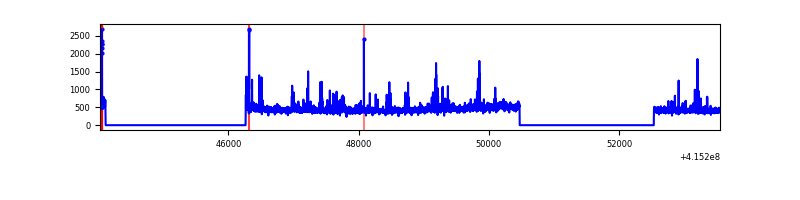 |
| C | 9523 | 5311 | 637 | 637 | 6.69% | 11.99% | 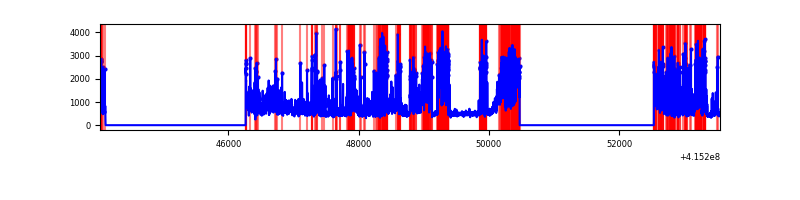 |
| D | 9523 | 5311 | 189 | 189 | 1.98% | 3.56% | 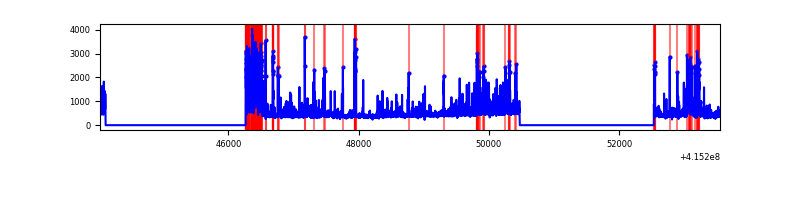 |
Top three noisy pixels from each quadrant. If the there are fewer than three noisy pixels in the level2.evt file, extra rows are filled as -1
| Pixel properties | Quadrant properties | ||||||
|---|---|---|---|---|---|---|---|
| Quadrant | DetID | PixID | Counts | Sigma | Mean | Median | Sigma |
| A | 10 | 83 | 459805 | 3930.38 | 568 | 557 | 116.8 |
| A | 12 | 189 | 101140 | 860.82 | 568 | 557 | 116.8 |
| A | 9 | 143 | 8145 | 64.94 | 568 | 557 | 116.8 |
| B | 4 | 171 | 127115 | 1146.98 | 567 | 552 | 110.3 |
| B | 5 | 255 | 62674 | 562.98 | 567 | 552 | 110.3 |
| B | 0 | 189 | 38643 | 345.2 | 567 | 552 | 110.3 |
| C | 9 | 187 | 3084789 | 25073.47 | 529 | 534 | 123.0 |
| C | 15 | 214 | 213244 | 1729.23 | 529 | 534 | 123.0 |
| C | 0 | 10 | 42476 | 340.97 | 529 | 534 | 123.0 |
| D | 12 | 227 | 604257 | 4540.02 | 544 | 530 | 133.0 |
| D | 2 | 249 | 225108 | 1688.83 | 544 | 530 | 133.0 |
| D | 12 | 0 | 121826 | 912.15 | 544 | 530 | 133.0 |
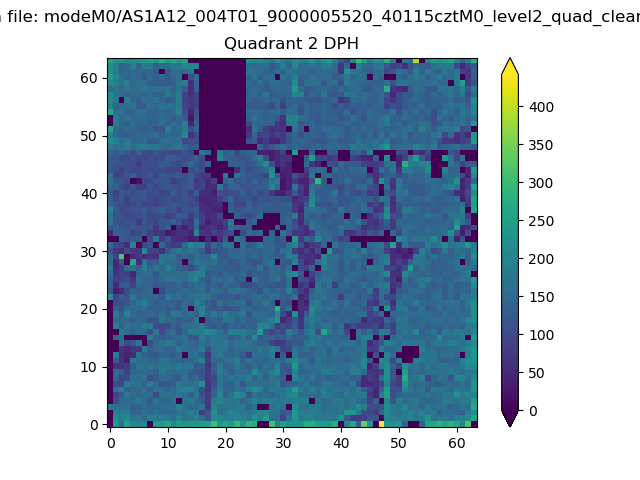
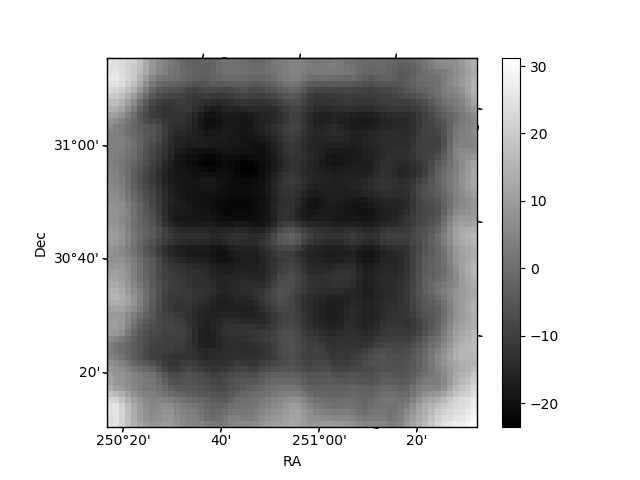
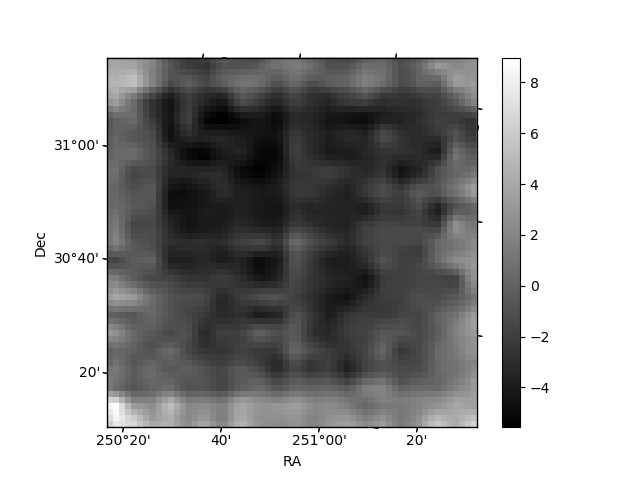
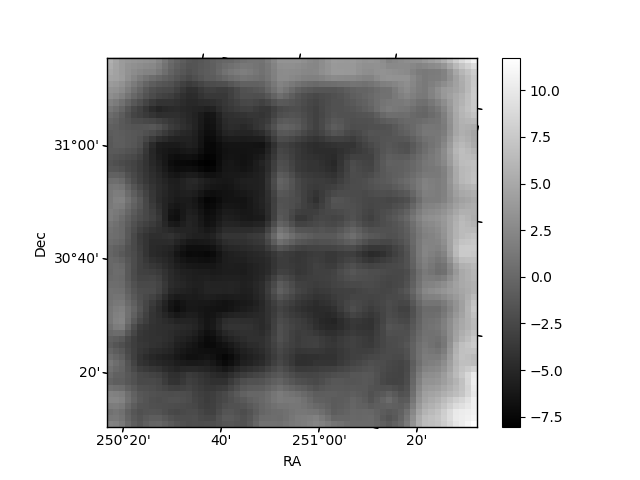
Histogram calculated using DETX and DETY for each event in the final _common_clean file
| Quadrant A | 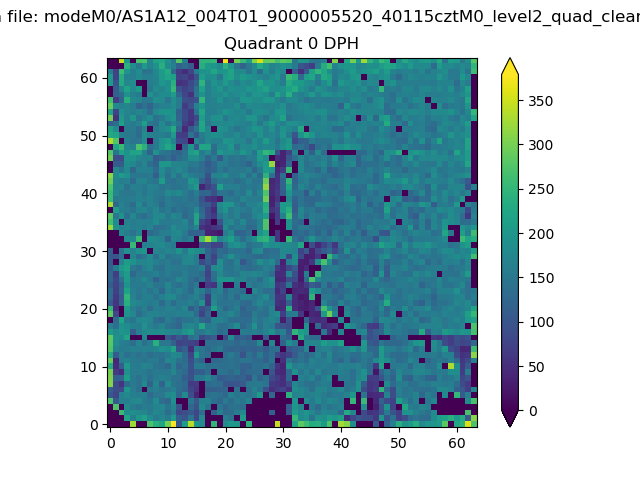 |
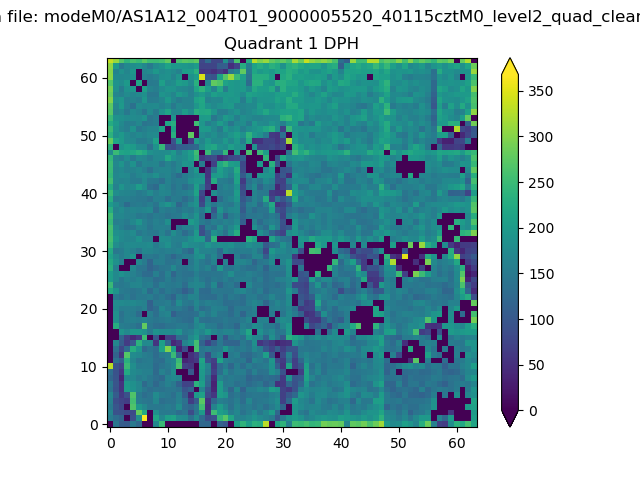 |
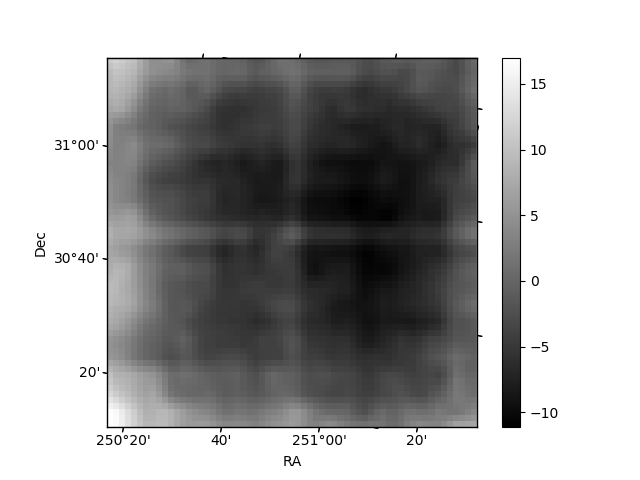
Quadrant B |
|---|---|---|---|
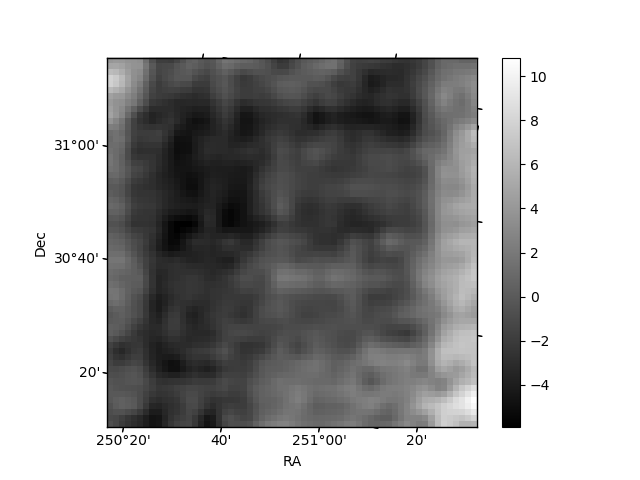
| Quadrant D | 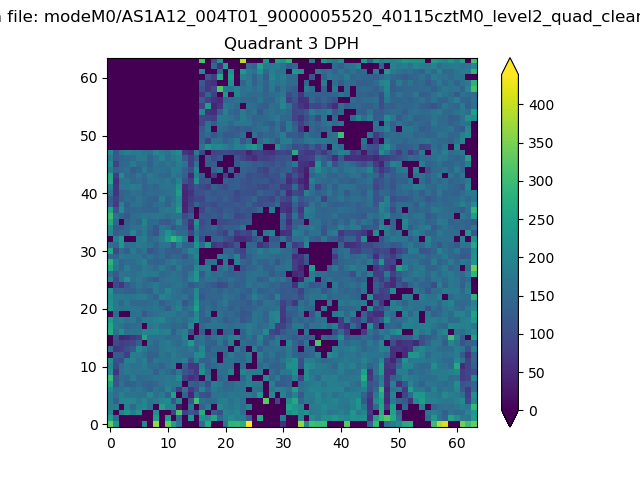 |
 |
Quadrant C |
| Plot type | Count rate plots | Images |
|---|---|---|
| Comparison with Poisson distribution Blue bars denote a histogram of data divided into 1 sec bins. Red curve is a Poisson curve with rate = median count rate of data. |
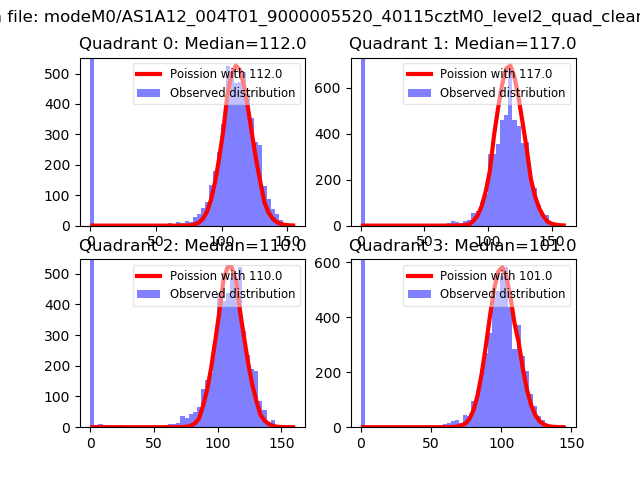 |
 |
| Quadrant-wise count rates Data is divided into 100 sec bins |
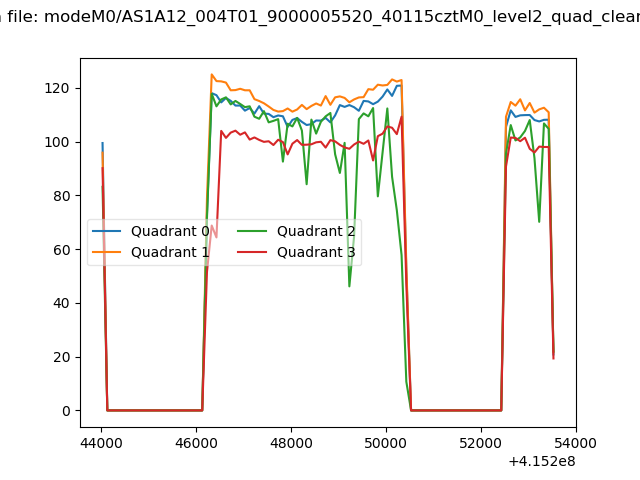 |
|
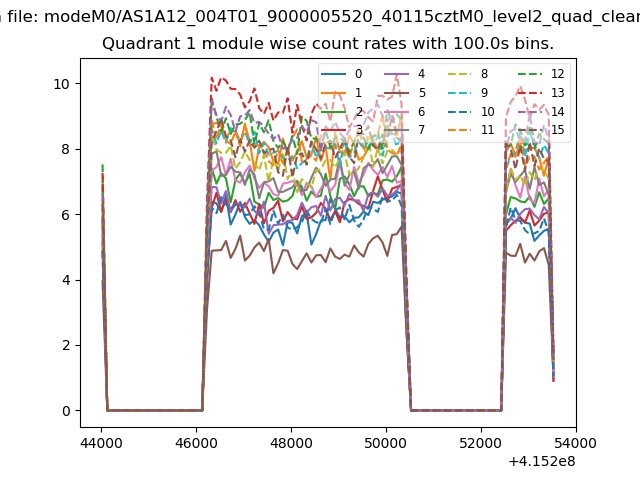
| Module-wise count rates for Quadrant A Data is divided into 100 sec bins |
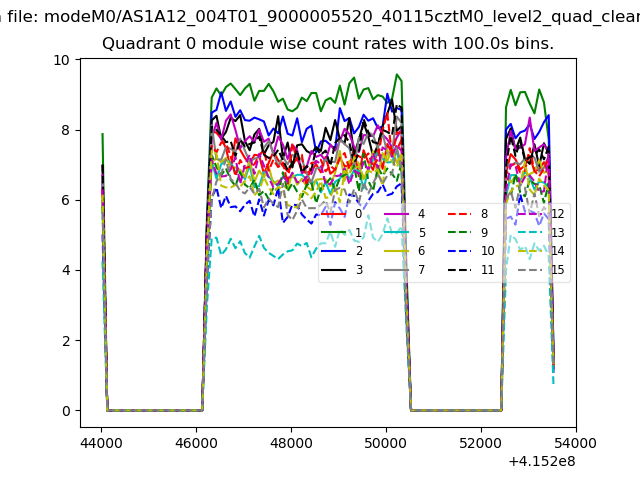 |
 |
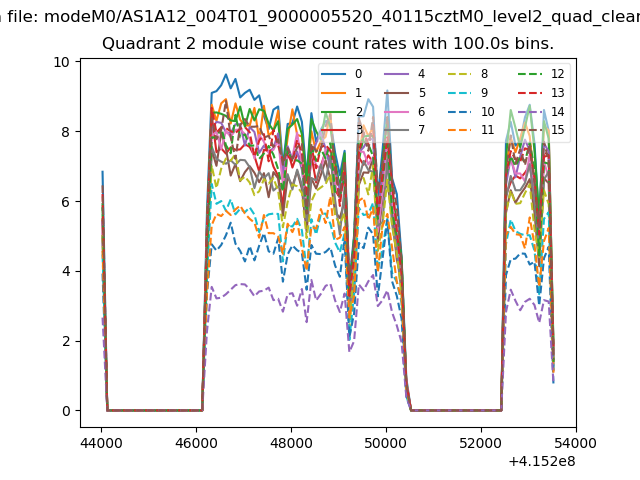
| Module-wise count rates for Quadrant B Data is divided into 100 sec bins |
 |
 |
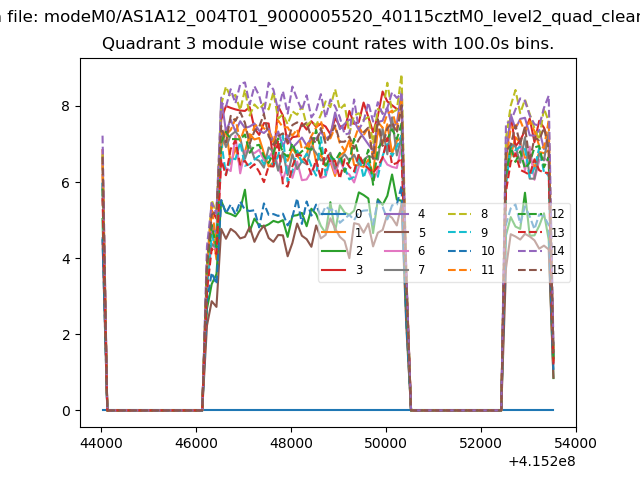
| Module-wise count rates for Quadrant C Data is divided into 100 sec bins |
 |
 |
| Module-wise count rates for Quadrant D Data is divided into 100 sec bins |
 |
 |
| Parameter | Plot |
|---|---|
| CZT HV Monitor | 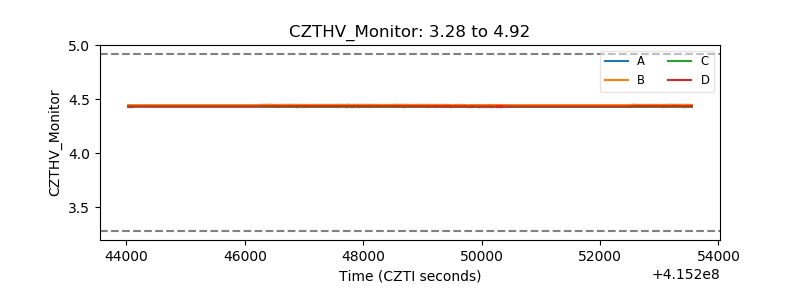 |
| D_VDD | 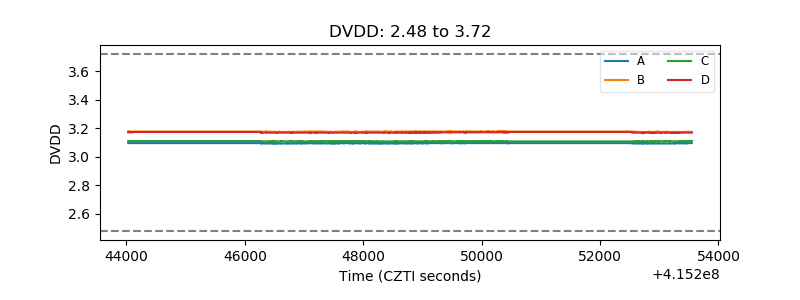 |
| Temperature 1 | 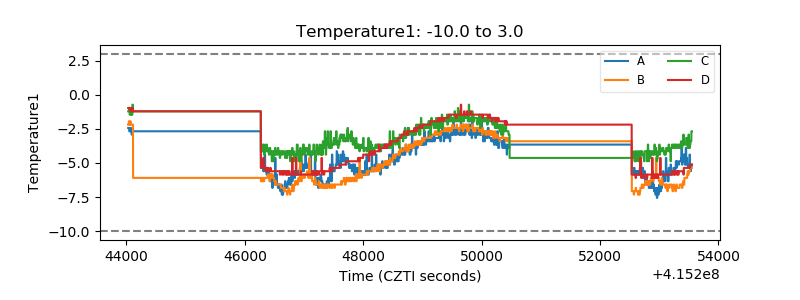 |
| Veto HV Monitor | 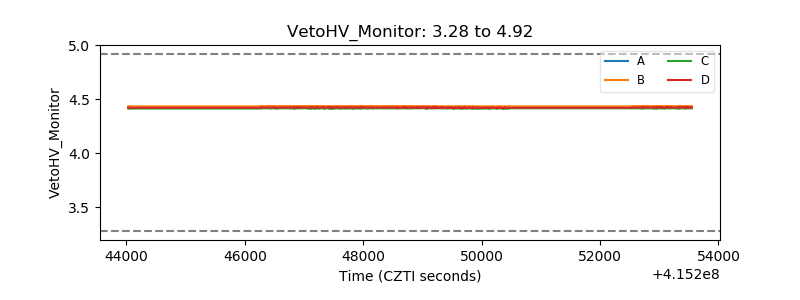 |
| Veto LLD | 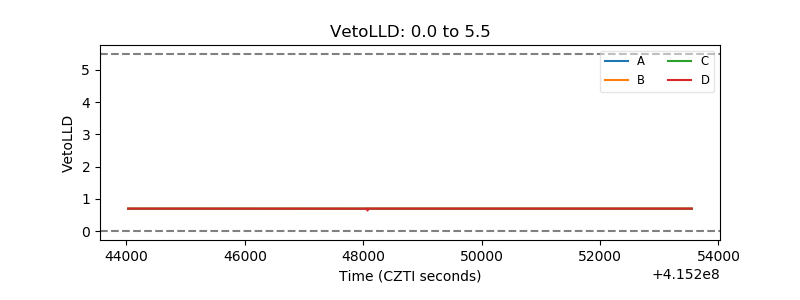 |
| Alpha Counter |  |
| _CPM_Rate | 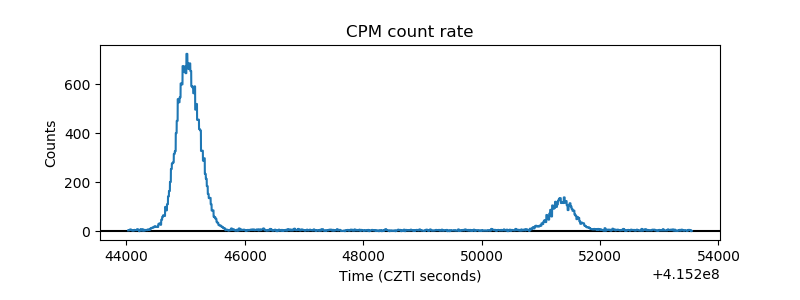 |
| CZT Counter | 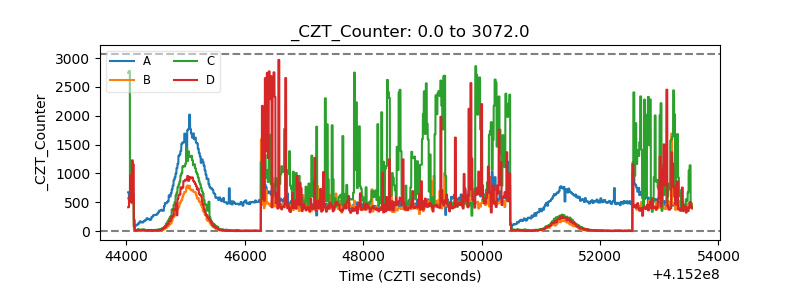 |
| +2.5 Volts monitor |  |
| +5 Volts monitor | 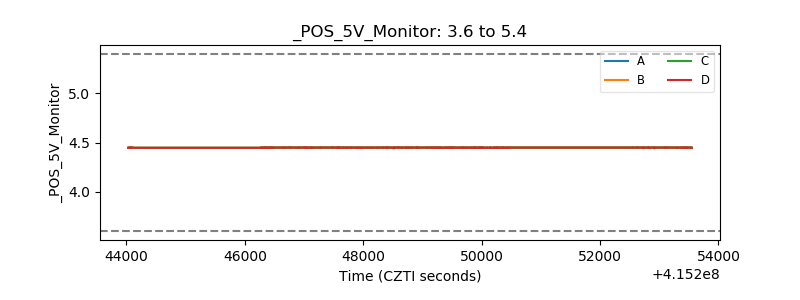 |
| _ROLL_ROT | 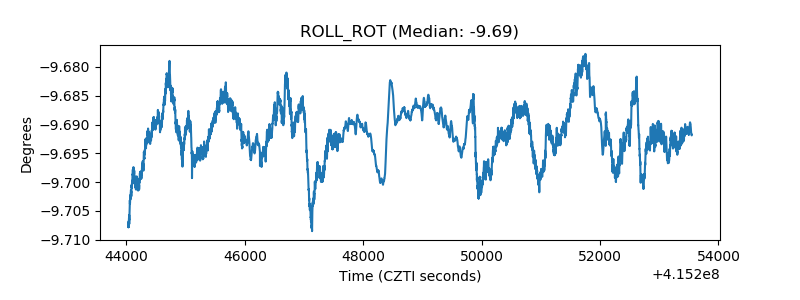 |
| _Roll_DEC | 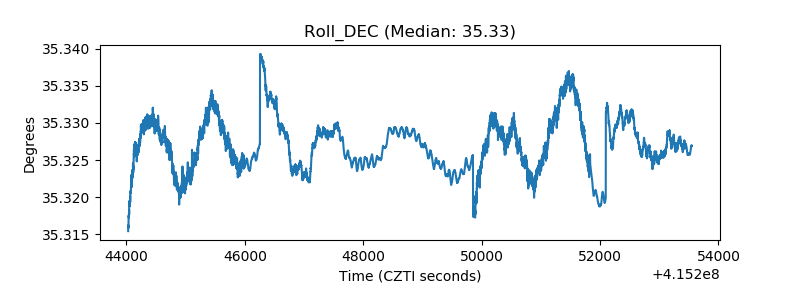 |
| _Roll_RA | 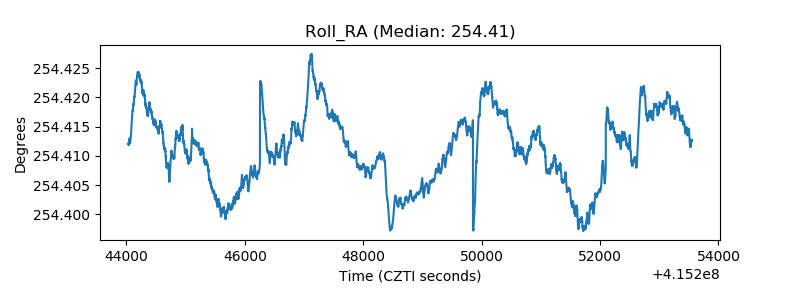 |
| Veto Counter |  |