| Param | Original file | Final file |
|---|---|---|
| Filename | modeM0/AS1A12_004T01_9000005520_40116cztM0_level2.fits | modeM0/AS1A12_004T01_9000005520_40116cztM0_level2_quad_clean.evt |
| Size (bytes) | 382,927,680 | 88,721,280 |
| Size | 365.2 MB | 84.6 MB |
| Events in quadrant A | 2,793,044 | 596,385 |
| Events in quadrant B | 2,486,853 | 620,505 |
| Events in quadrant C | 4,930,974 | 554,656 |
| Events in quadrant D | 3,534,792 | 528,943 |
| Mode M0 | |||
|---|---|---|---|
| Quadrant | BADHDUFLAG | Total packets | Discarded packets |
| A | 0 | 11744 | 3 |
| B | 0 | 11387 | 2 |
| C | 0 | 18217 | 2 |
| D | 0 | 14539 | 2 |
| Mode M9 | |||
|---|---|---|---|
| Quadrant | BADHDUFLAG | Total packets | Discarded packets |
| A | 0 | 31 | 0 |
| B | 0 | 31 | 0 |
| C | 0 | 31 | 0 |
| D | 0 | 32 | 0 |
| Mode SS | |||
|---|---|---|---|
| Quadrant | BADHDUFLAG | Total packets | Discarded packets |
| A | 0 | 112 | 0 |
| B | 0 | 112 | 0 |
| C | 0 | 112 | 0 |
| D | 0 | 112 | 0 |
| Quadrant | Total seconds | Saturated seconds | Saturation percentage |
|---|---|---|---|
| A | 5516 | 8 | 0.145033% |
| B | 5516 | 7 | 0.126904% |
| C | 5516 | 489 | 8.865120% |
| D | 5516 | 184 | 3.335751% |
Noise dominated data is calculated using 1-second bins in cleaned event files. If a bin has >2000 counts, and if more than 50% of those come from <1% of pixels, then it is considered to be noise-dominated and hence unusable.
| Quadrant | # 1 sec bins | Bins with >0 counts | Bins with >2000 counts | High rate bins dominated by noise | Noise dominated (total time) | Noise dominated (detector-on time) | Marked lightcurve |
|---|---|---|---|---|---|---|---|
| A | 7309 | 5517 | 3 | 3 | 0.04% | 0.05% | 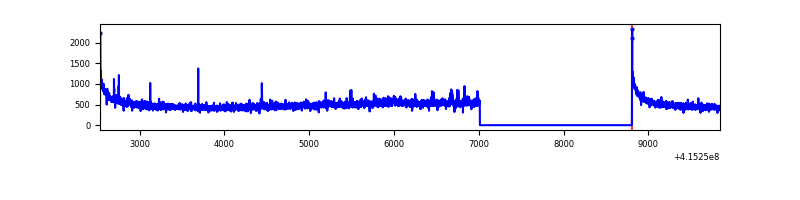 |
| B | 7309 | 5517 | 2 | 2 | 0.03% | 0.04% | 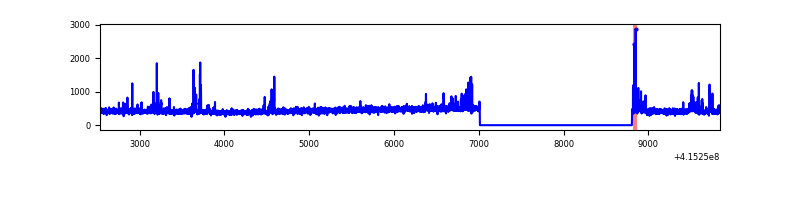 |
| C | 7309 | 5516 | 510 | 510 | 6.98% | 9.25% | 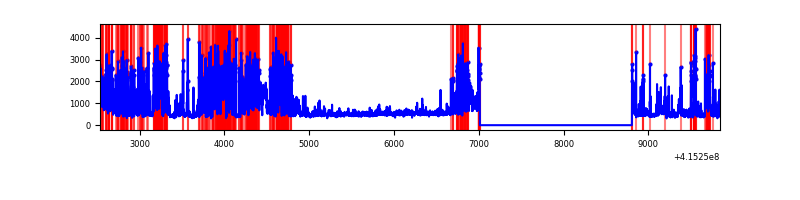 |
| D | 7309 | 5517 | 176 | 176 | 2.41% | 3.19% | 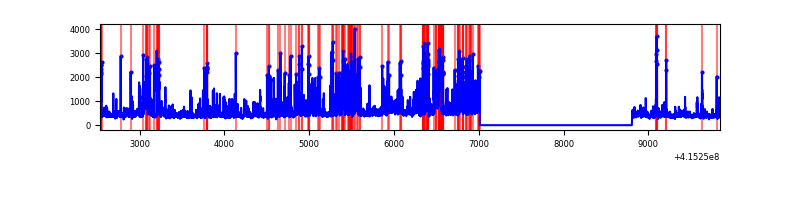 |
Top three noisy pixels from each quadrant. If the there are fewer than three noisy pixels in the level2.evt file, extra rows are filled as -1
| Pixel properties | Quadrant properties | ||||||
|---|---|---|---|---|---|---|---|
| Quadrant | DetID | PixID | Counts | Sigma | Mean | Median | Sigma |
| A | 10 | 83 | 472951 | 3899.64 | 586 | 576 | 121.1 |
| A | 2 | 79 | 37402 | 304.01 | 586 | 576 | 121.1 |
| A | 9 | 143 | 9601 | 74.5 | 586 | 576 | 121.1 |
| B | 4 | 171 | 88384 | 777.45 | 583 | 567 | 113.0 |
| B | 0 | 189 | 36017 | 313.84 | 583 | 567 | 113.0 |
| B | 5 | 255 | 34337 | 298.97 | 583 | 567 | 113.0 |
| C | 9 | 187 | 2459115 | 18845.92 | 555 | 556 | 130.5 |
| C | 15 | 214 | 226141 | 1729.21 | 555 | 556 | 130.5 |
| C | 0 | 10 | 30644 | 230.64 | 555 | 556 | 130.5 |
| D | 12 | 227 | 342085 | 2508.77 | 561 | 546 | 136.1 |
| D | 12 | 0 | 304476 | 2232.51 | 561 | 546 | 136.1 |
| D | 10 | 204 | 277803 | 2036.58 | 561 | 546 | 136.1 |
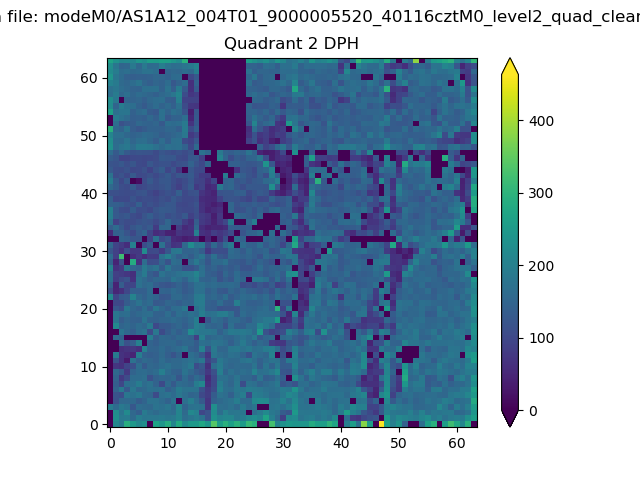
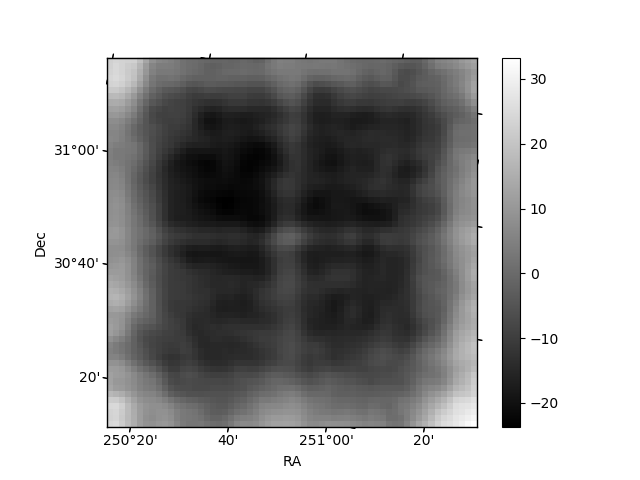
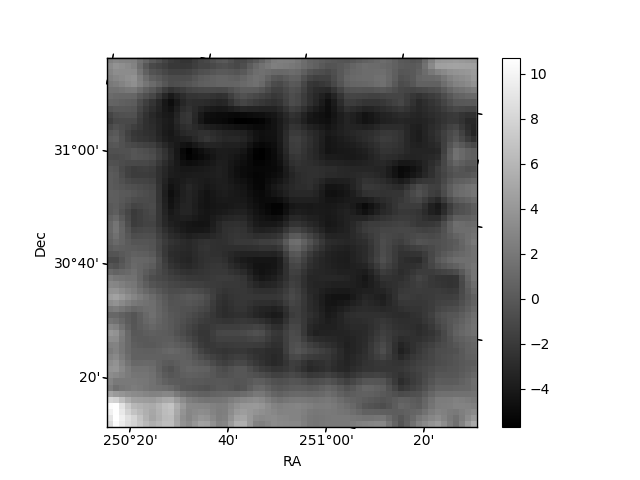
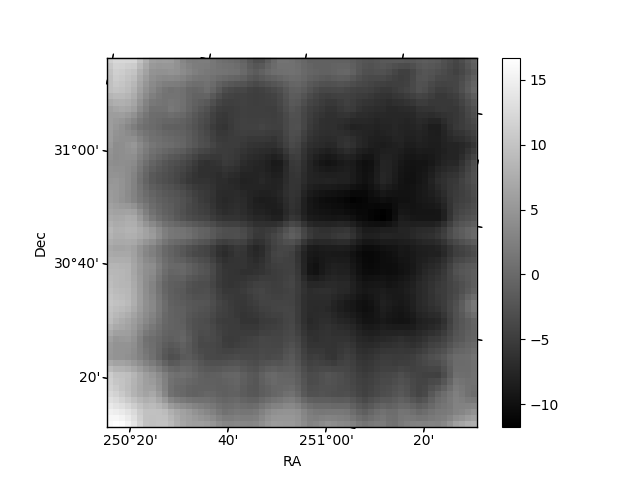
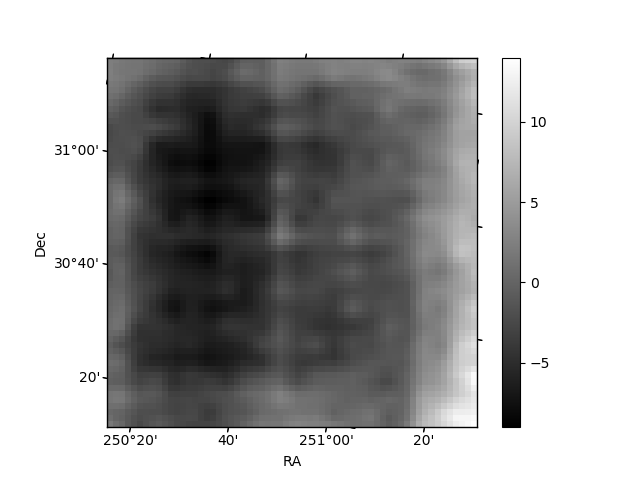
Histogram calculated using DETX and DETY for each event in the final _common_clean file
| Quadrant A | 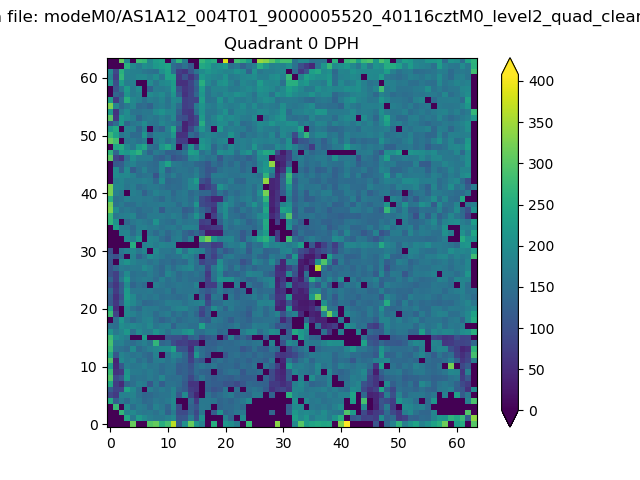 |
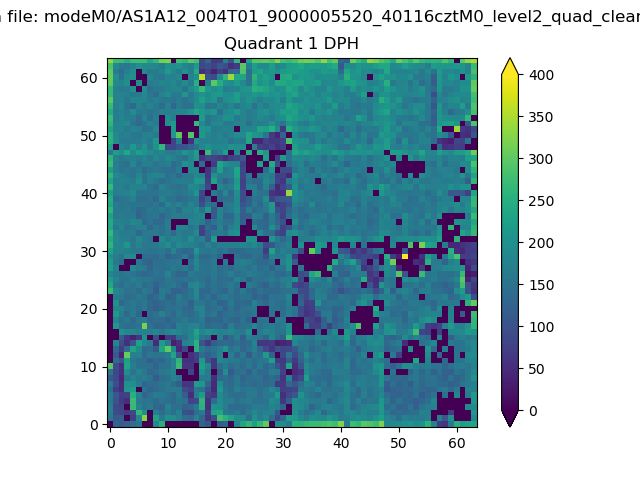 |
Quadrant B |
|---|---|---|---|
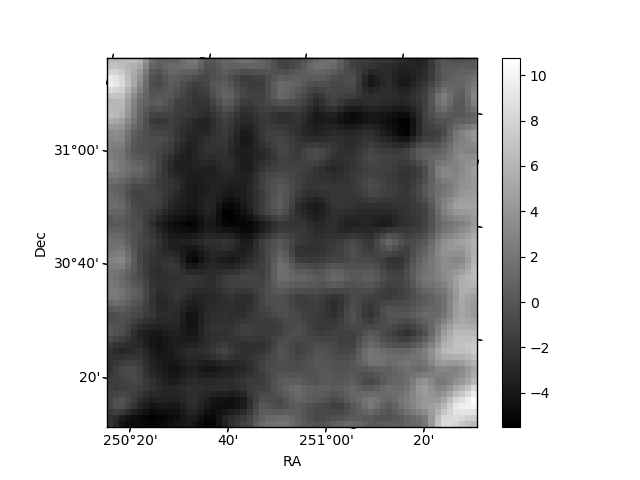
| Quadrant D | 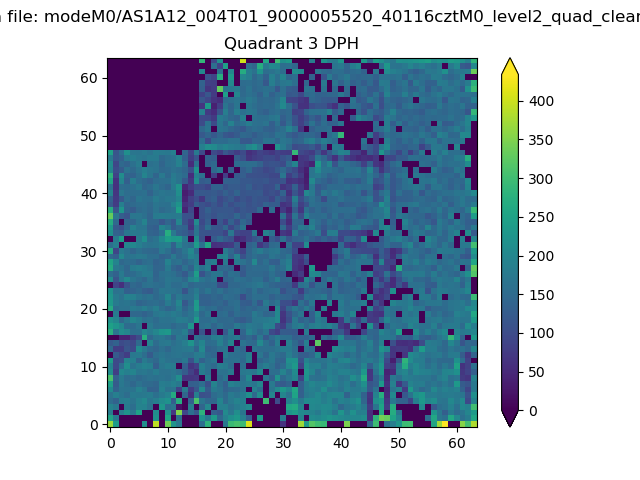 |
 |
Quadrant C |
| Plot type | Count rate plots | Images |
|---|---|---|
| Comparison with Poisson distribution Blue bars denote a histogram of data divided into 1 sec bins. Red curve is a Poisson curve with rate = median count rate of data. |
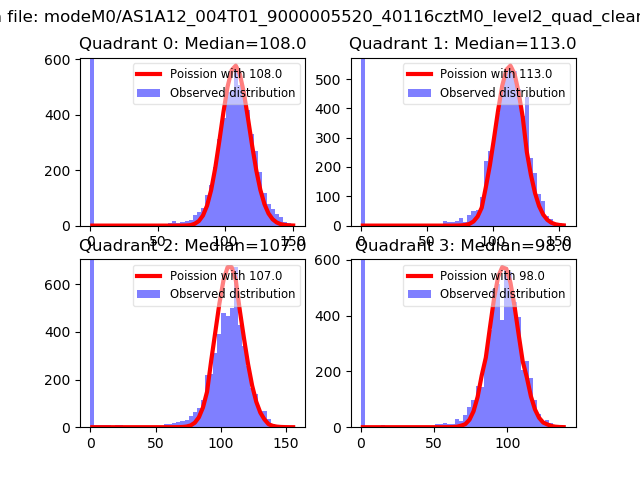 |
 |
| Quadrant-wise count rates Data is divided into 100 sec bins |
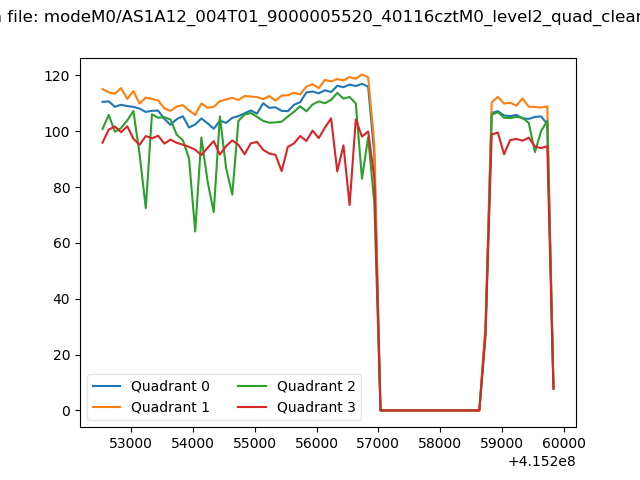 |
|
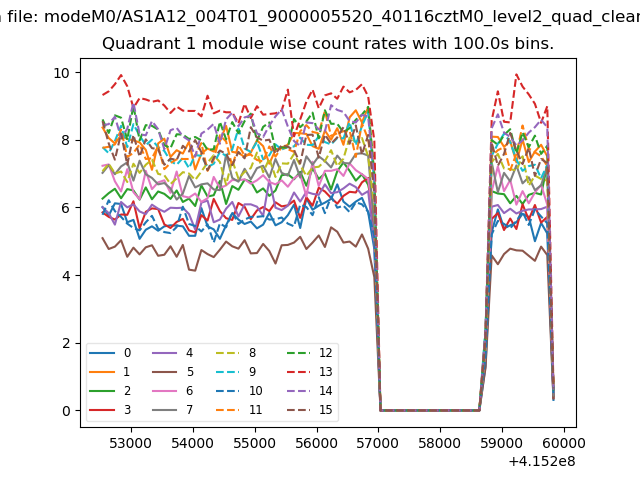
| Module-wise count rates for Quadrant A Data is divided into 100 sec bins |
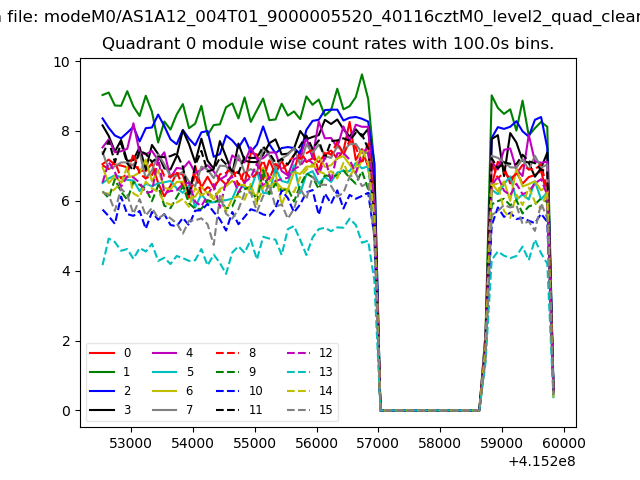 |
 |
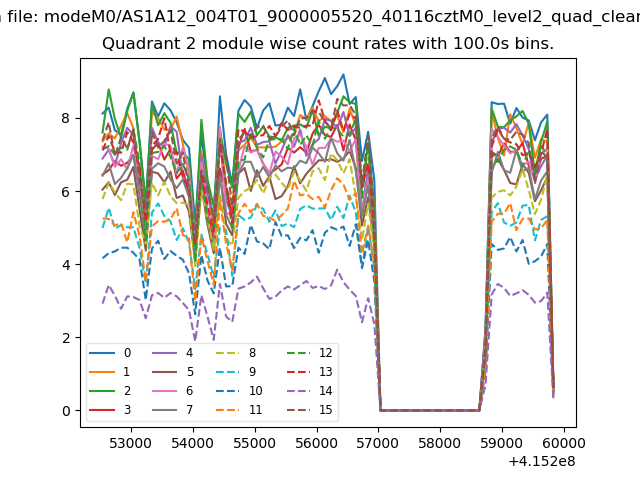
| Module-wise count rates for Quadrant B Data is divided into 100 sec bins |
 |
 |
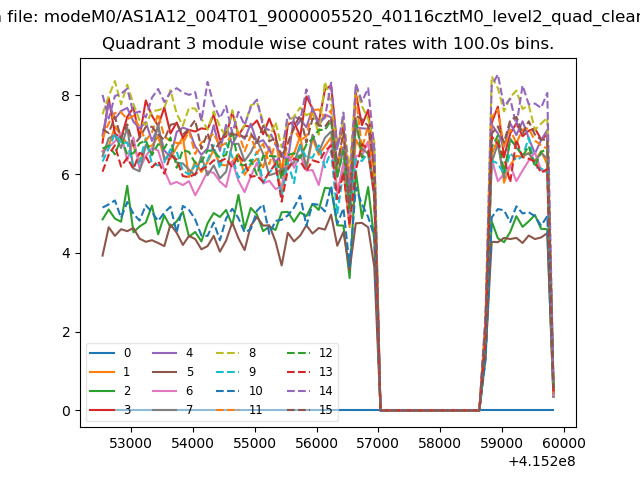
| Module-wise count rates for Quadrant C Data is divided into 100 sec bins |
 |
 |
| Module-wise count rates for Quadrant D Data is divided into 100 sec bins |
 |
 |
| Parameter | Plot |
|---|---|
| CZT HV Monitor | 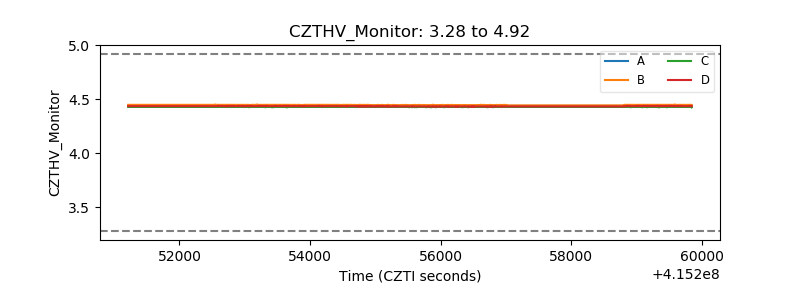 |
| D_VDD | 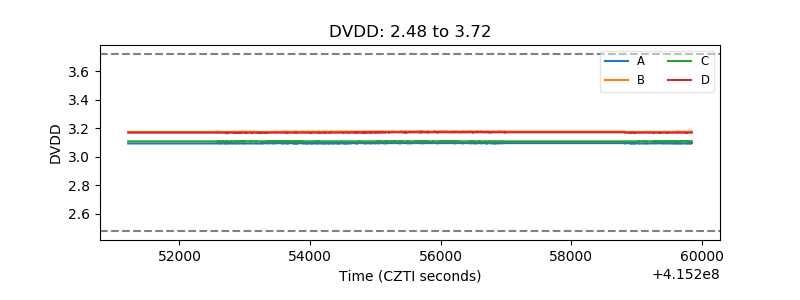 |
| Temperature 1 | 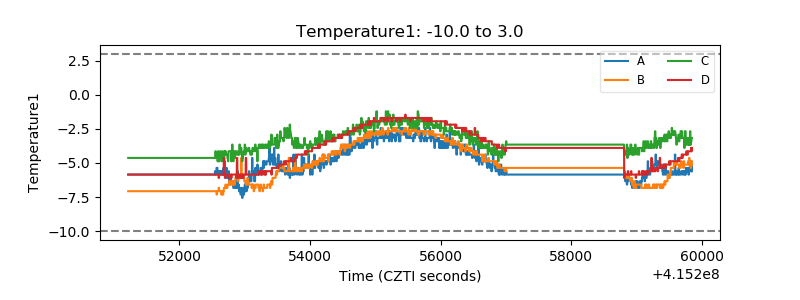 |
| Veto HV Monitor | 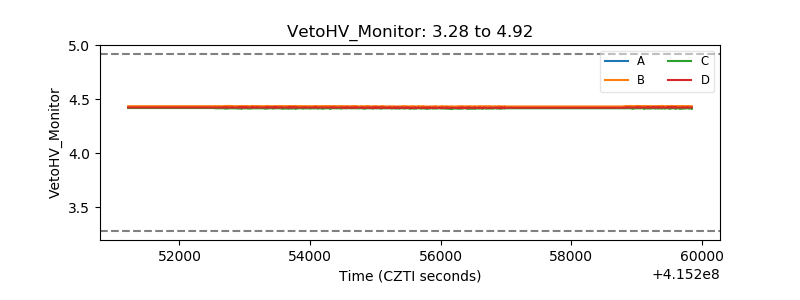 |
| Veto LLD | 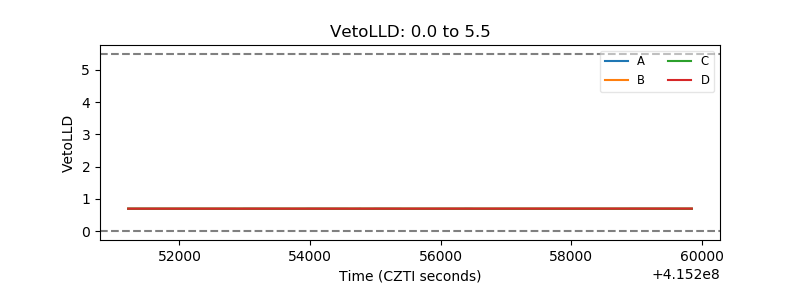 |
| Alpha Counter | 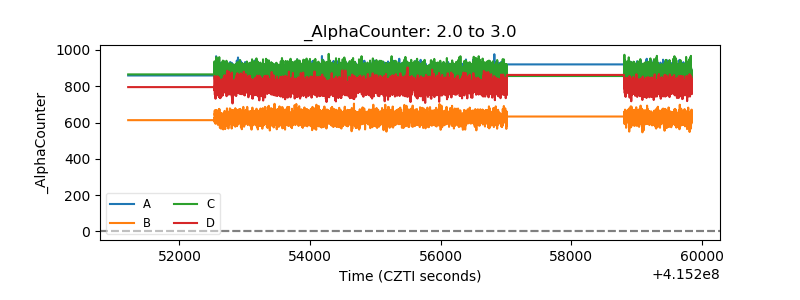 |
| _CPM_Rate | 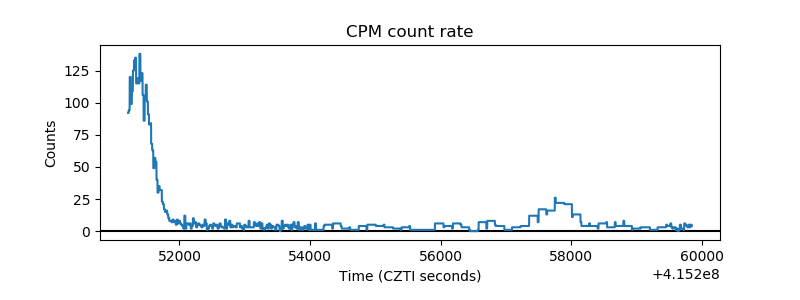 |
| CZT Counter | 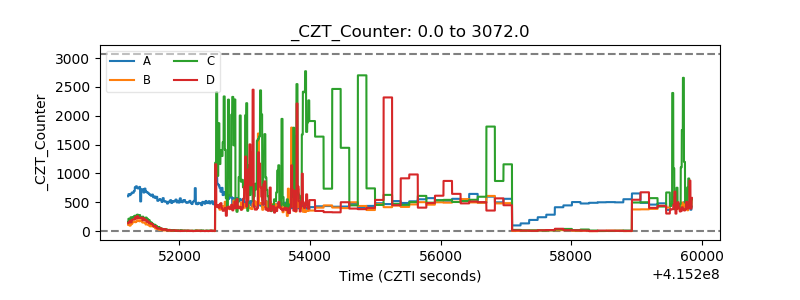 |
| +2.5 Volts monitor | 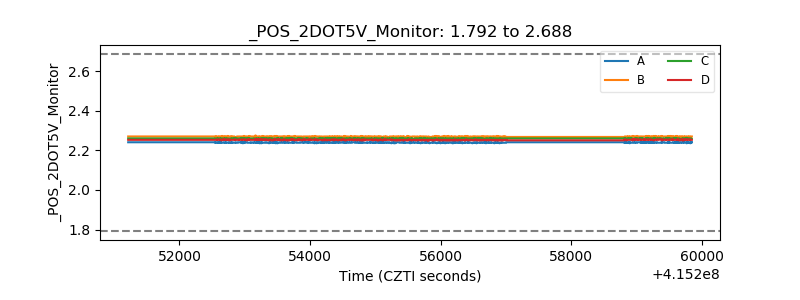 |
| +5 Volts monitor | 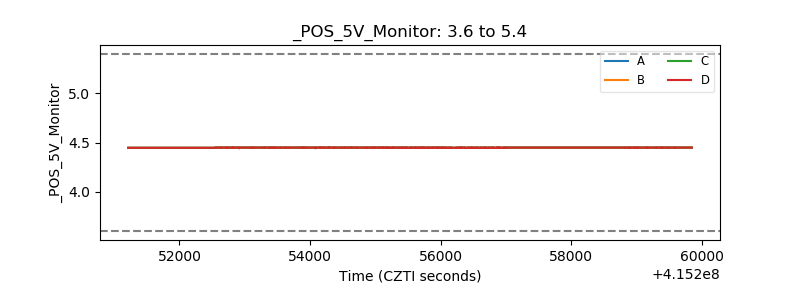 |
| _ROLL_ROT | 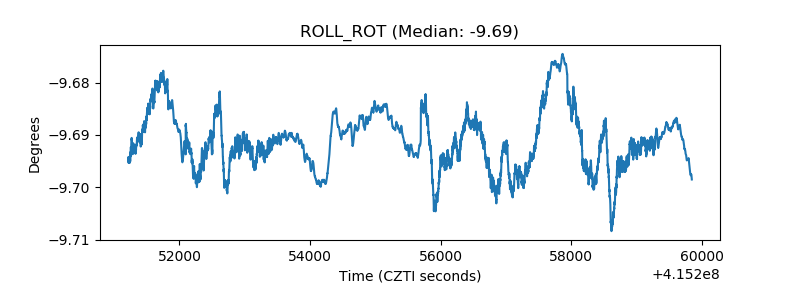 |
| _Roll_DEC |  |
| _Roll_RA | 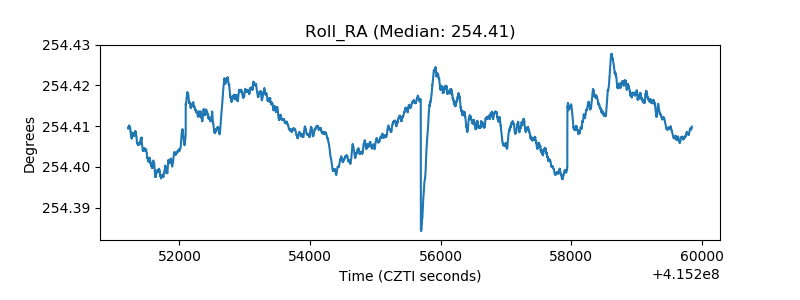 |
| Veto Counter | 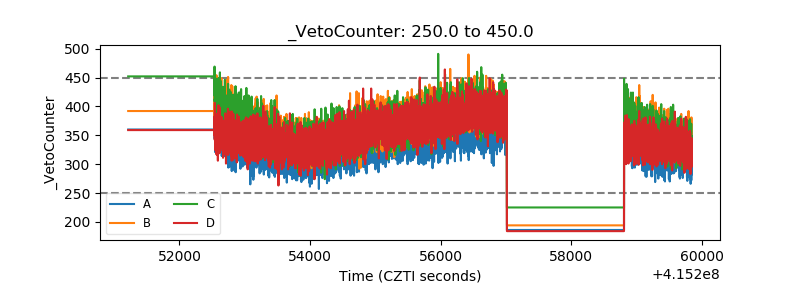 |