| Param | Original file | Final file |
|---|---|---|
| Filename | modeM0/AS1A12_004T01_9000005520_40117cztM0_level2.fits | modeM0/AS1A12_004T01_9000005520_40117cztM0_level2_quad_clean.evt |
| Size (bytes) | 407,894,400 | 92,856,960 |
| Size | 389.0 MB | 88.6 MB |
| Events in quadrant A | 2,907,448 | 633,747 |
| Events in quadrant B | 2,717,207 | 650,495 |
| Events in quadrant C | 5,691,616 | 557,852 |
| Events in quadrant D | 3,330,581 | 563,594 |
| Mode M0 | |||
|---|---|---|---|
| Quadrant | BADHDUFLAG | Total packets | Discarded packets |
| A | 0 | 12147 | 3 |
| B | 0 | 12206 | 2 |
| C | 0 | 20789 | 4 |
| D | 0 | 14075 | 2 |
| Mode M9 | |||
|---|---|---|---|
| Quadrant | BADHDUFLAG | Total packets | Discarded packets |
| A | 0 | 33 | 0 |
| B | 0 | 33 | 0 |
| C | 0 | 33 | 0 |
| D | 0 | 33 | 0 |
| Mode SS | |||
|---|---|---|---|
| Quadrant | BADHDUFLAG | Total packets | Discarded packets |
| A | 0 | 120 | 0 |
| B | 0 | 120 | 0 |
| C | 0 | 120 | 0 |
| D | 0 | 120 | 0 |
| Quadrant | Total seconds | Saturated seconds | Saturation percentage |
|---|---|---|---|
| A | 5810 | 6 | 0.103270% |
| B | 5810 | 16 | 0.275387% |
| C | 5809 | 732 | 12.601136% |
| D | 5810 | 131 | 2.254733% |
Noise dominated data is calculated using 1-second bins in cleaned event files. If a bin has >2000 counts, and if more than 50% of those come from <1% of pixels, then it is considered to be noise-dominated and hence unusable.
| Quadrant | # 1 sec bins | Bins with >0 counts | Bins with >2000 counts | High rate bins dominated by noise | Noise dominated (total time) | Noise dominated (detector-on time) | Marked lightcurve |
|---|---|---|---|---|---|---|---|
| A | 9065 | 5812 | 3 | 3 | 0.03% | 0.05% | 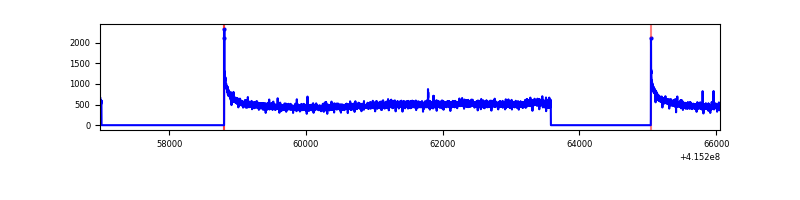 |
| B | 9065 | 5812 | 11 | 11 | 0.12% | 0.19% | 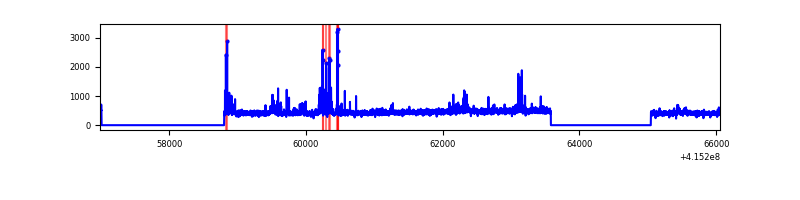 |
| C | 9065 | 5811 | 728 | 728 | 8.03% | 12.53% | 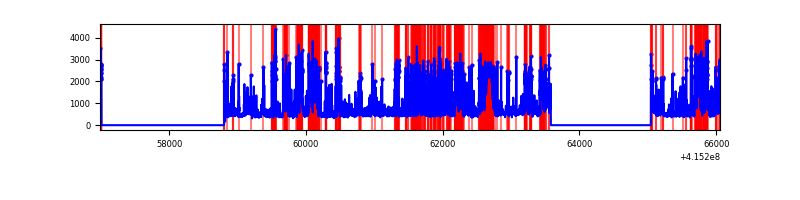 |
| D | 9065 | 5812 | 120 | 120 | 1.32% | 2.06% | 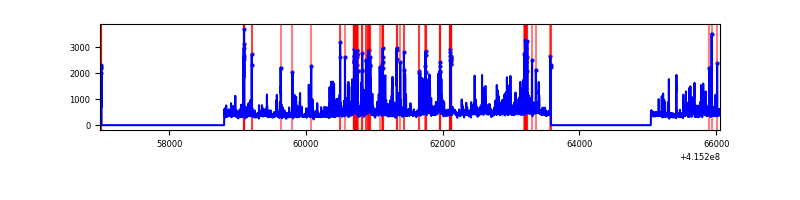 |
Top three noisy pixels from each quadrant. If the there are fewer than three noisy pixels in the level2.evt file, extra rows are filled as -1
| Pixel properties | Quadrant properties | ||||||
|---|---|---|---|---|---|---|---|
| Quadrant | DetID | PixID | Counts | Sigma | Mean | Median | Sigma |
| A | 10 | 83 | 491562 | 3831.44 | 623 | 611 | 128.1 |
| A | 3 | 137 | 6824 | 48.49 | 623 | 611 | 128.1 |
| A | 0 | 226 | 5237 | 36.1 | 623 | 611 | 128.1 |
| B | 4 | 171 | 178599 | 1461.93 | 619 | 600 | 121.8 |
| B | 0 | 189 | 40763 | 329.86 | 619 | 600 | 121.8 |
| B | 0 | 245 | 39603 | 320.34 | 619 | 600 | 121.8 |
| C | 9 | 187 | 3003085 | 22166.99 | 576 | 580 | 135.4 |
| C | 15 | 214 | 232649 | 1713.33 | 576 | 580 | 135.4 |
| C | 14 | 254 | 142193 | 1045.5 | 576 | 580 | 135.4 |
| D | 13 | 249 | 324330 | 2190.31 | 603 | 588 | 147.8 |
| D | 2 | 249 | 200508 | 1352.58 | 603 | 588 | 147.8 |
| D | 9 | 19 | 155841 | 1050.38 | 603 | 588 | 147.8 |
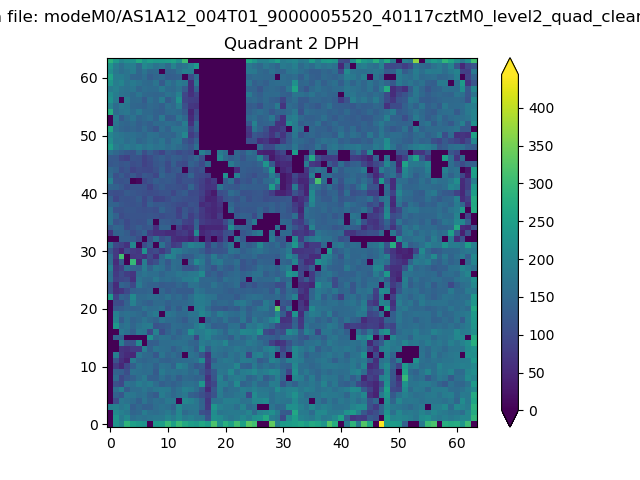
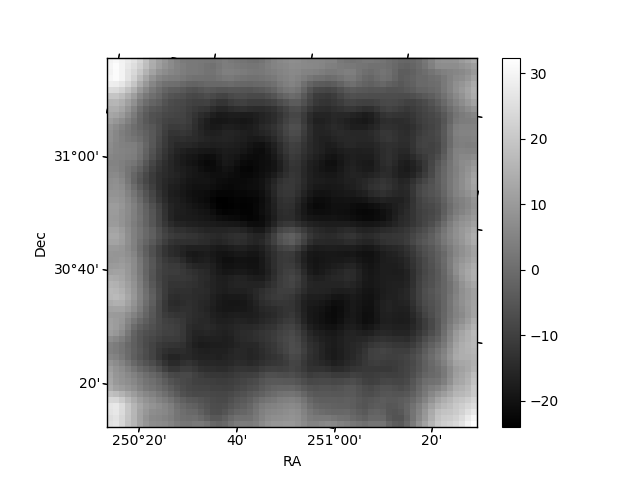
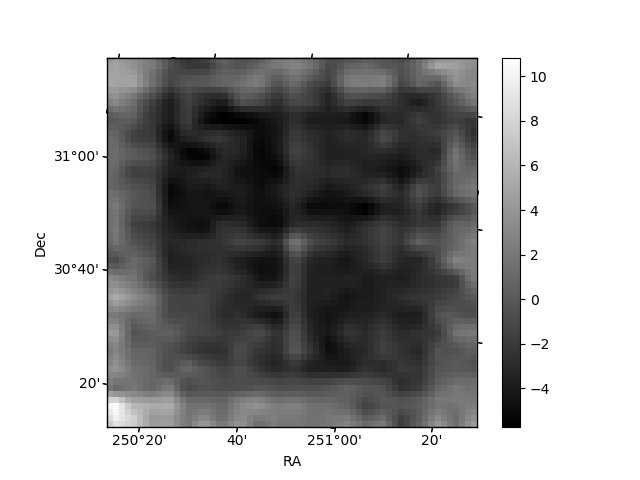
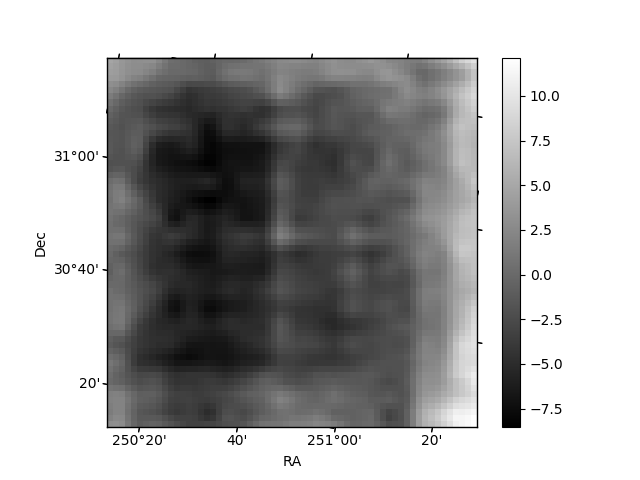
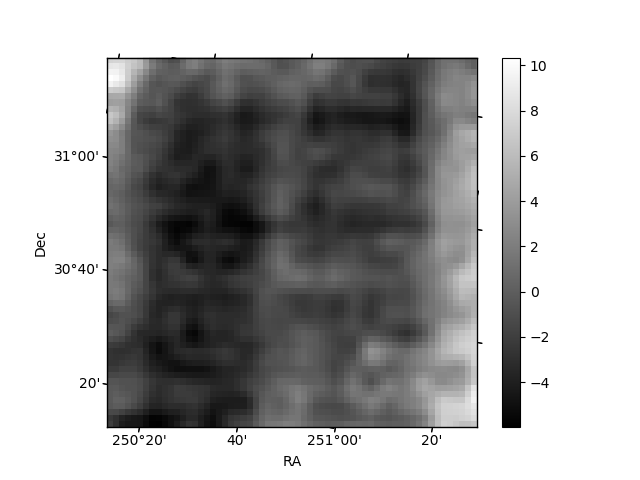
Histogram calculated using DETX and DETY for each event in the final _common_clean file
| Quadrant A | 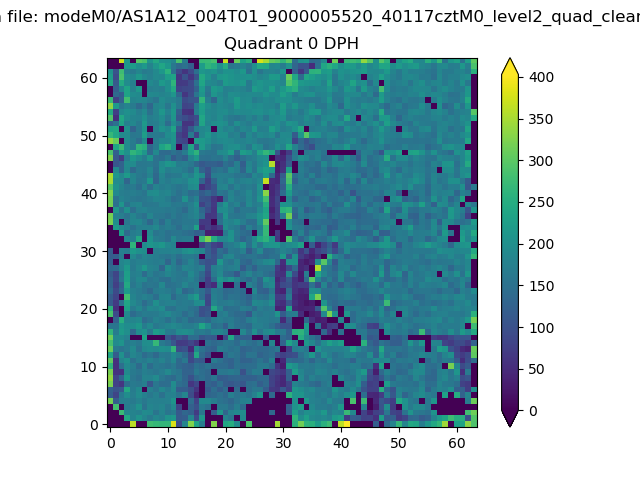 |
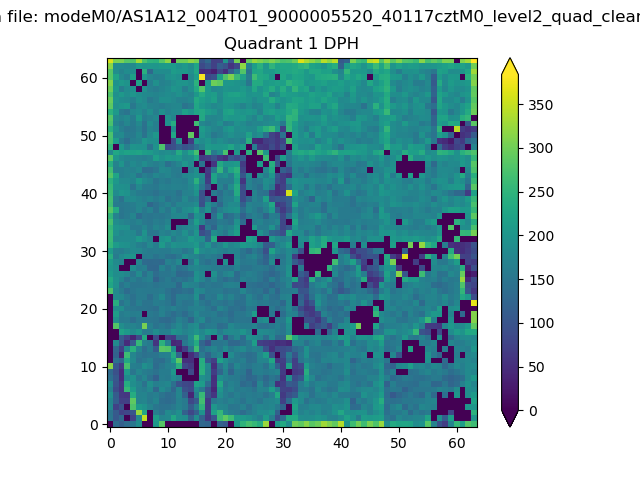 |
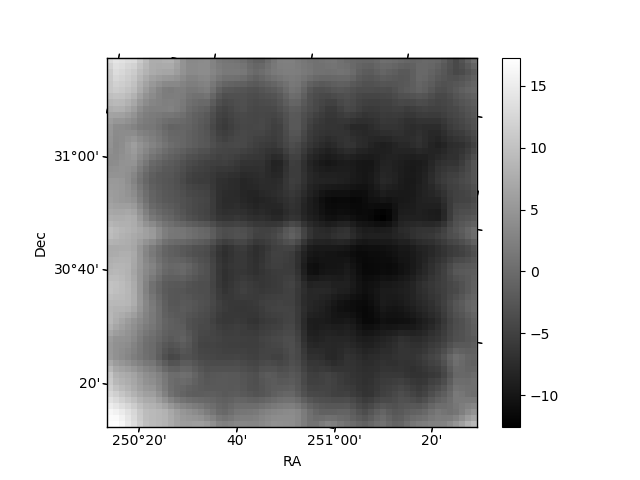
Quadrant B |
|---|---|---|---|
| Quadrant D | 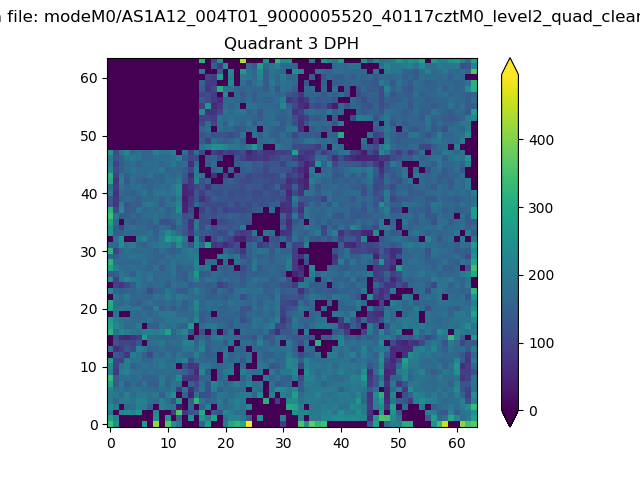 |
 |
Quadrant C |
| Plot type | Count rate plots | Images |
|---|---|---|
| Comparison with Poisson distribution Blue bars denote a histogram of data divided into 1 sec bins. Red curve is a Poisson curve with rate = median count rate of data. |
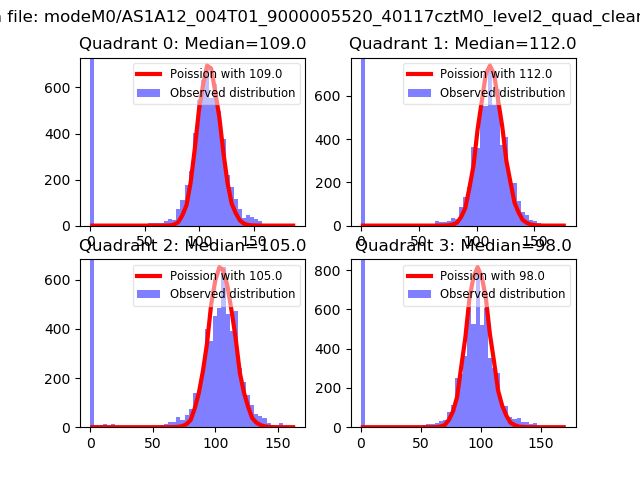 |
 |
| Quadrant-wise count rates Data is divided into 100 sec bins |
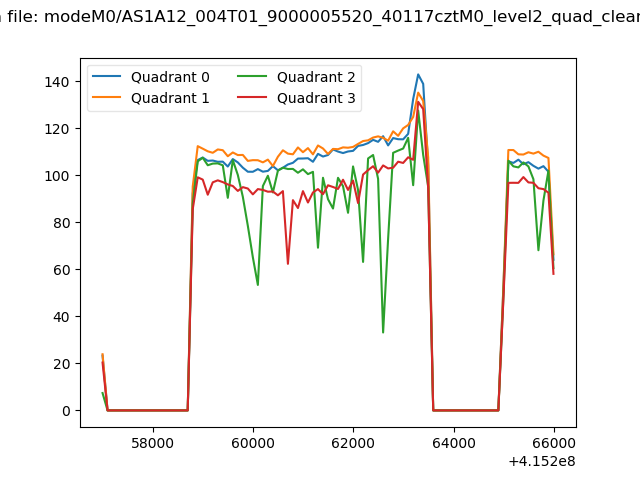 |
|
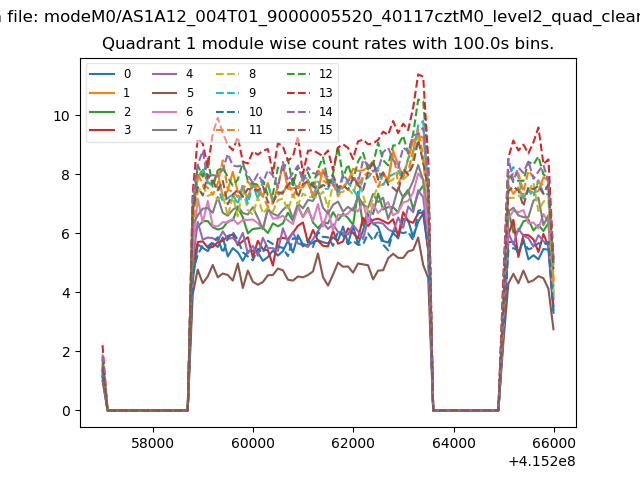
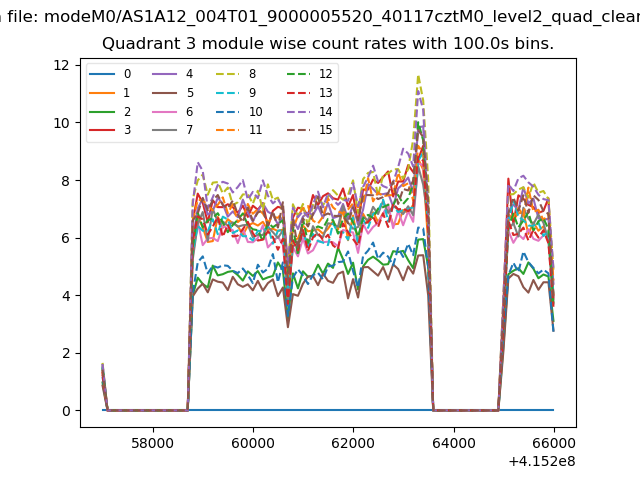
| Module-wise count rates for Quadrant A Data is divided into 100 sec bins |
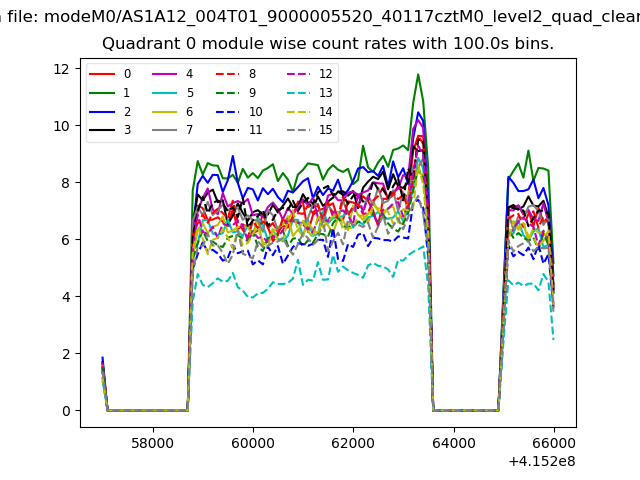 |
 |
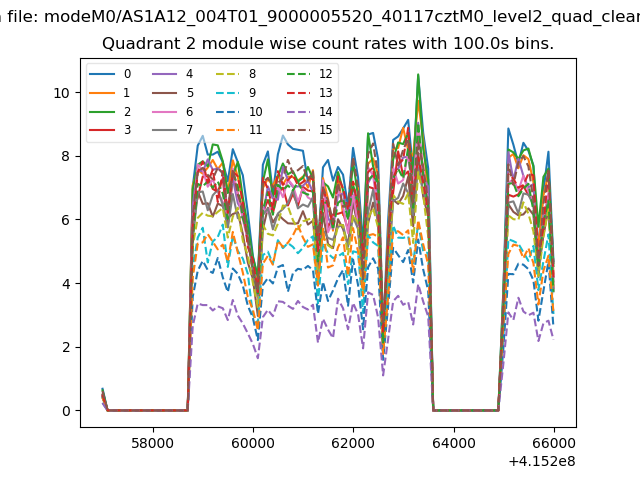
| Module-wise count rates for Quadrant B Data is divided into 100 sec bins |
 |
 |
| Module-wise count rates for Quadrant C Data is divided into 100 sec bins |
 |
 |
| Module-wise count rates for Quadrant D Data is divided into 100 sec bins |
 |
 |
| Parameter | Plot |
|---|---|
| CZT HV Monitor | 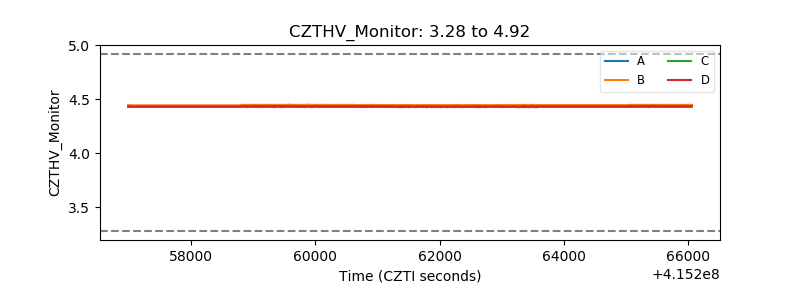 |
| D_VDD | 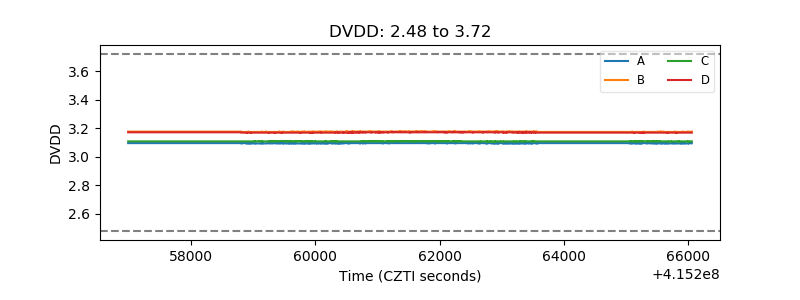 |
| Temperature 1 | 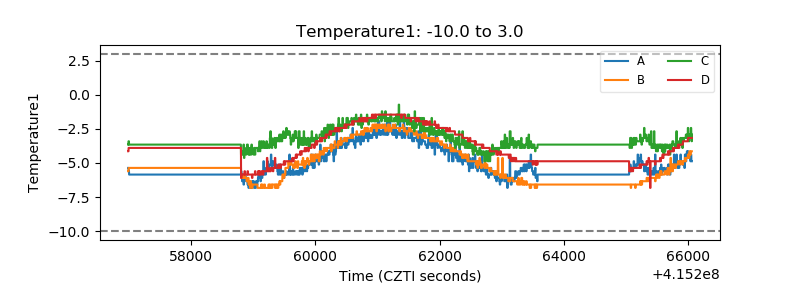 |
| Veto HV Monitor | 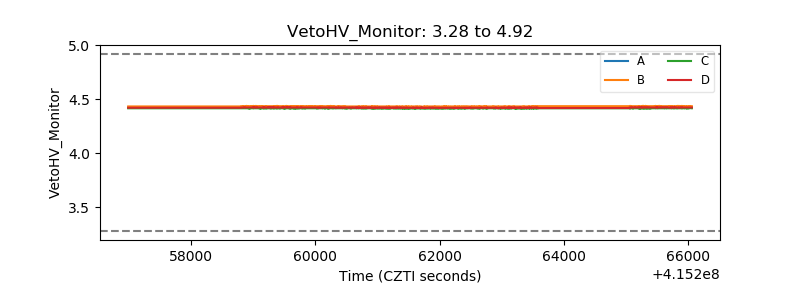 |
| Veto LLD | 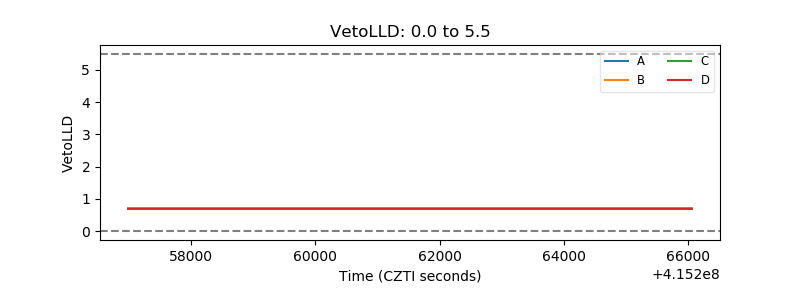 |
| Alpha Counter | 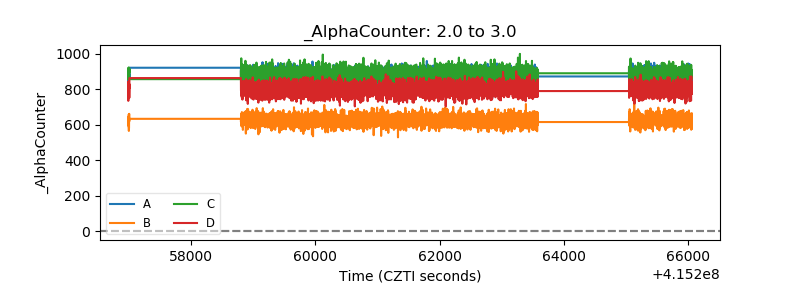 |
| _CPM_Rate | 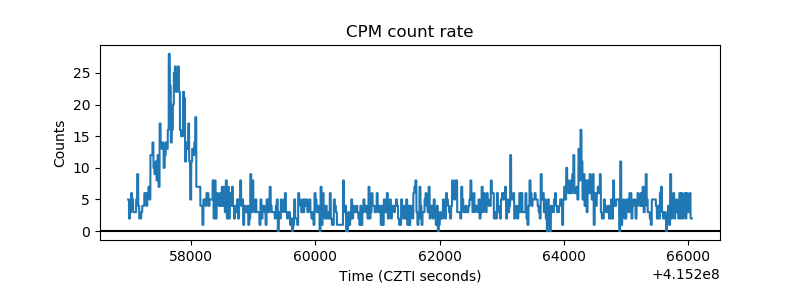 |
| CZT Counter | 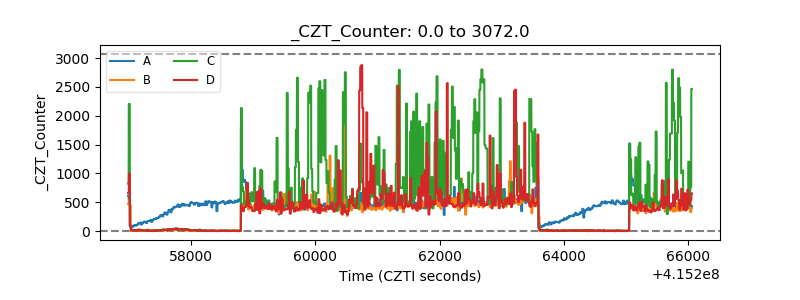 |
| +2.5 Volts monitor | 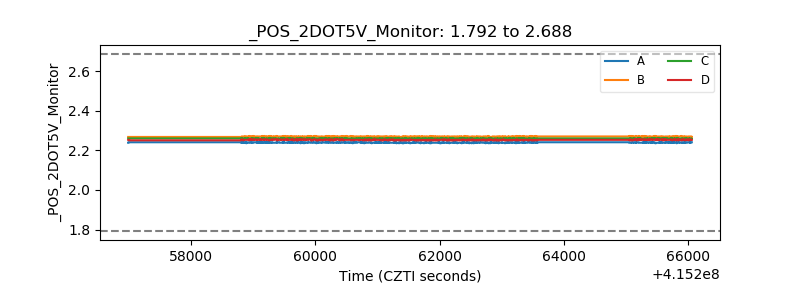 |
| +5 Volts monitor |  |
| _ROLL_ROT | 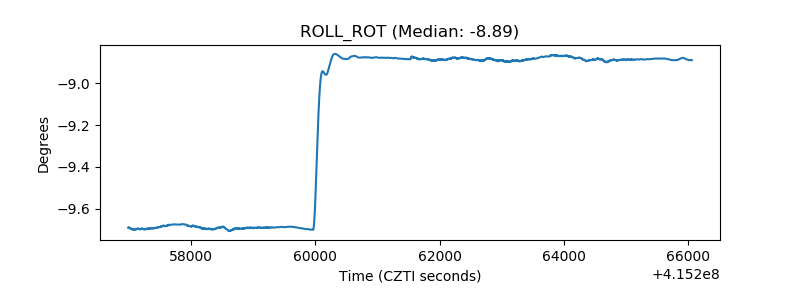 |
| _Roll_DEC | 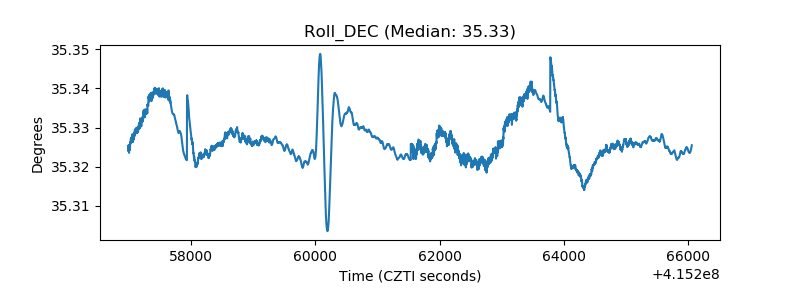 |
| _Roll_RA | 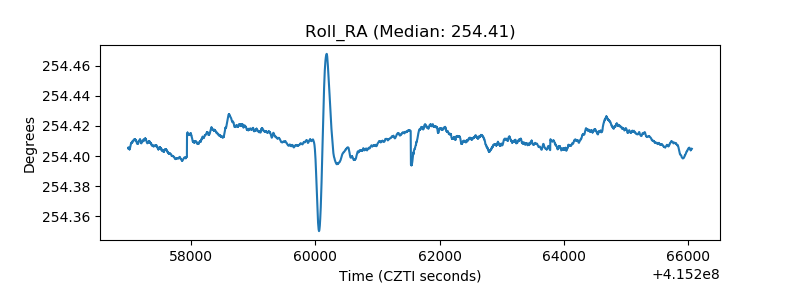 |
| Veto Counter | 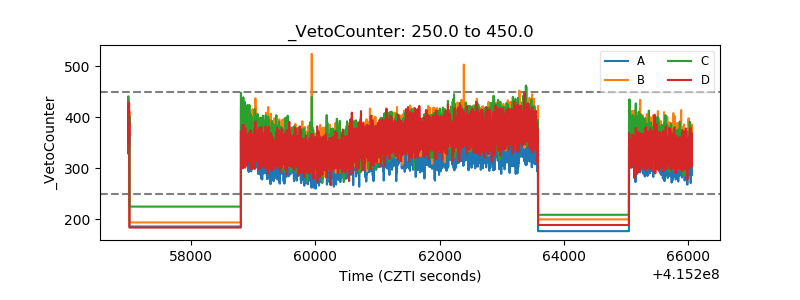 |