| Param | Original file | Final file |
|---|---|---|
| Filename | modeM0/AS1A12_004T01_9000005520_40118cztM0_level2.fits | modeM0/AS1A12_004T01_9000005520_40118cztM0_level2_quad_clean.evt |
| Size (bytes) | 472,579,200 | 91,333,440 |
| Size | 450.7 MB | 87.1 MB |
| Events in quadrant A | 2,928,077 | 630,152 |
| Events in quadrant B | 2,756,799 | 649,783 |
| Events in quadrant C | 7,406,141 | 529,852 |
| Events in quadrant D | 3,947,117 | 546,433 |
| Mode M0 | |||
|---|---|---|---|
| Quadrant | BADHDUFLAG | Total packets | Discarded packets |
| A | 0 | 12205 | 2 |
| B | 0 | 12408 | 1 |
| C | 0 | 26068 | 1 |
| D | 0 | 15864 | 1 |
| Mode M9 | |||
|---|---|---|---|
| Quadrant | BADHDUFLAG | Total packets | Discarded packets |
| A | 0 | 14 | 0 |
| B | 0 | 14 | 0 |
| C | 0 | 14 | 0 |
| D | 0 | 14 | 0 |
| Mode SS | |||
|---|---|---|---|
| Quadrant | BADHDUFLAG | Total packets | Discarded packets |
| A | 0 | 116 | 0 |
| B | 0 | 116 | 0 |
| C | 0 | 116 | 0 |
| D | 0 | 116 | 0 |
| Quadrant | Total seconds | Saturated seconds | Saturation percentage |
|---|---|---|---|
| A | 5862 | 7 | 0.119413% |
| B | 5862 | 30 | 0.511771% |
| C | 5862 | 1135 | 19.361992% |
| D | 5862 | 298 | 5.083589% |
Noise dominated data is calculated using 1-second bins in cleaned event files. If a bin has >2000 counts, and if more than 50% of those come from <1% of pixels, then it is considered to be noise-dominated and hence unusable.
| Quadrant | # 1 sec bins | Bins with >0 counts | Bins with >2000 counts | High rate bins dominated by noise | Noise dominated (total time) | Noise dominated (detector-on time) | Marked lightcurve |
|---|---|---|---|---|---|---|---|
| A | 7175 | 5863 | 3 | 3 | 0.04% | 0.05% | 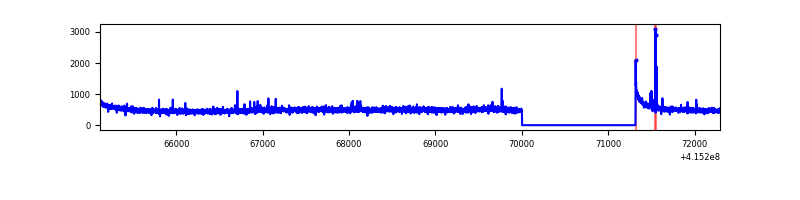 |
| B | 7175 | 5863 | 18 | 18 | 0.25% | 0.31% | 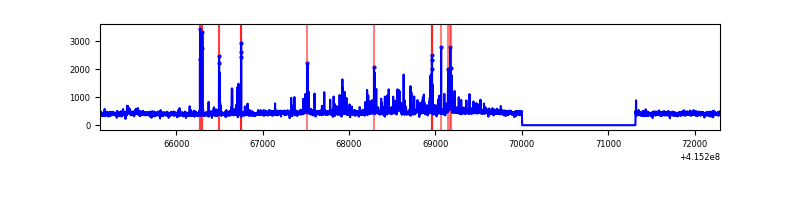 |
| C | 7175 | 5863 | 1080 | 1080 | 15.05% | 18.42% | 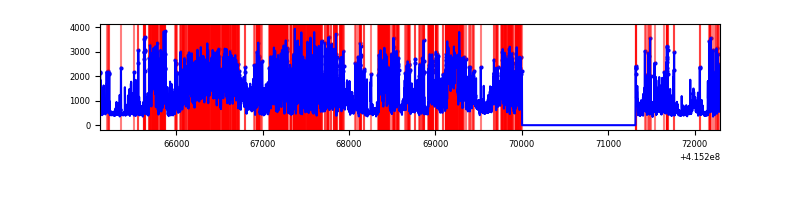 |
| D | 7175 | 5863 | 281 | 281 | 3.92% | 4.79% | 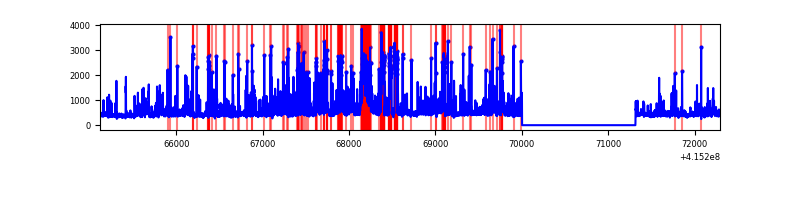 |
Top three noisy pixels from each quadrant. If the there are fewer than three noisy pixels in the level2.evt file, extra rows are filled as -1
| Pixel properties | Quadrant properties | ||||||
|---|---|---|---|---|---|---|---|
| Quadrant | DetID | PixID | Counts | Sigma | Mean | Median | Sigma |
| A | 10 | 83 | 452009 | 3456.62 | 633 | 620 | 130.6 |
| A | 10 | 255 | 23283 | 173.55 | 633 | 620 | 130.6 |
| A | 3 | 137 | 6900 | 48.09 | 633 | 620 | 130.6 |
| B | 0 | 190 | 124660 | 1008.78 | 628 | 610 | 123.0 |
| B | 5 | 255 | 112736 | 911.82 | 628 | 610 | 123.0 |
| B | 12 | 111 | 15387 | 120.17 | 628 | 610 | 123.0 |
| C | 9 | 187 | 4859122 | 35889.37 | 574 | 578 | 135.4 |
| C | 15 | 214 | 230184 | 1696.07 | 574 | 578 | 135.4 |
| C | 1 | 241 | 24964 | 180.14 | 574 | 578 | 135.4 |
| D | 13 | 249 | 530776 | 3584.58 | 601 | 585 | 147.9 |
| D | 12 | 227 | 320533 | 2163.14 | 601 | 585 | 147.9 |
| D | 2 | 249 | 218380 | 1472.49 | 601 | 585 | 147.9 |
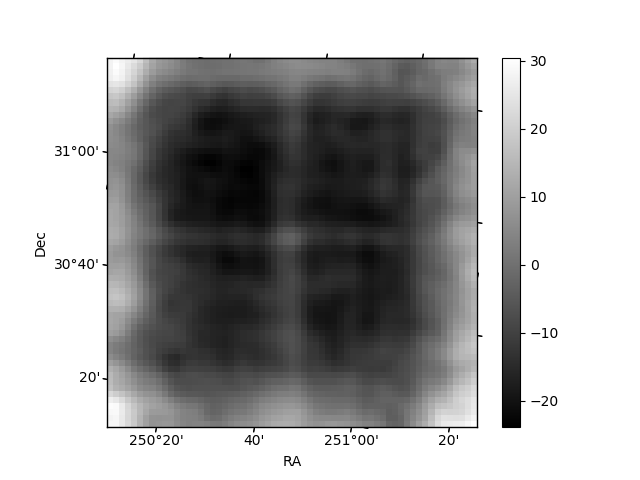
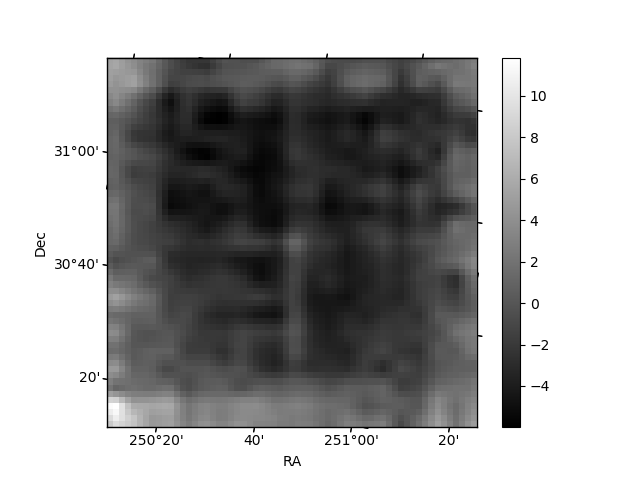
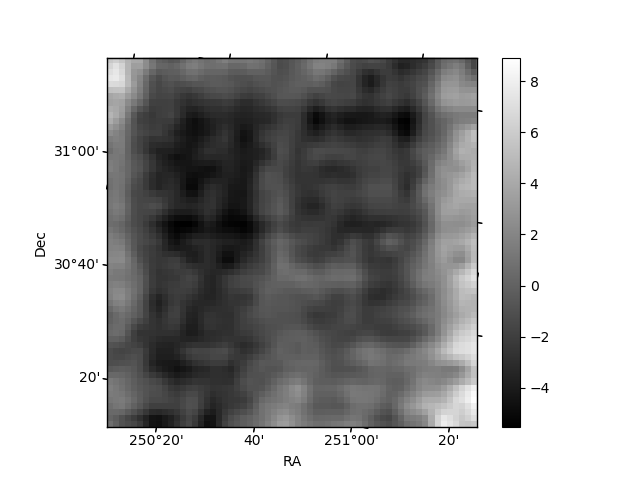
Histogram calculated using DETX and DETY for each event in the final _common_clean file
| Quadrant A | 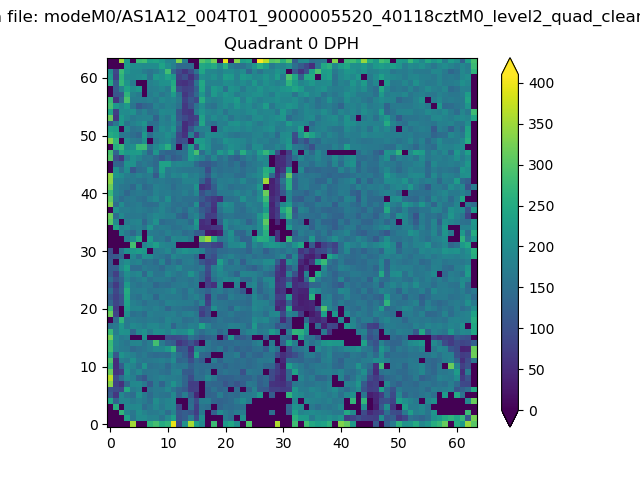 |
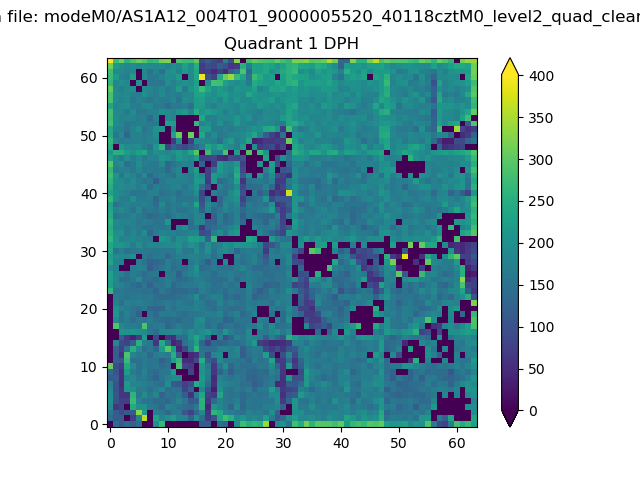 |
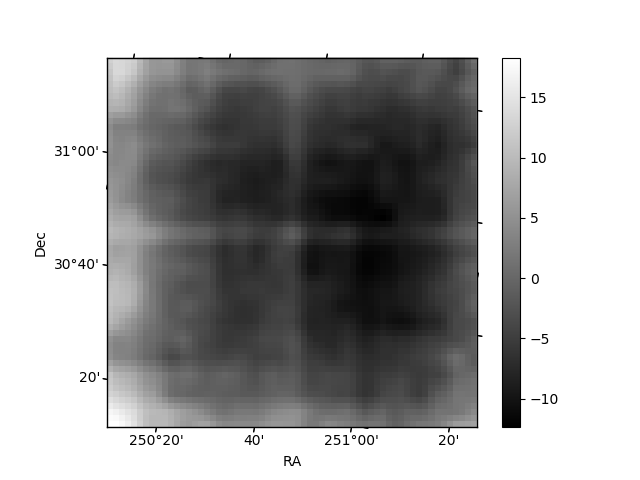
Quadrant B |
|---|---|---|---|
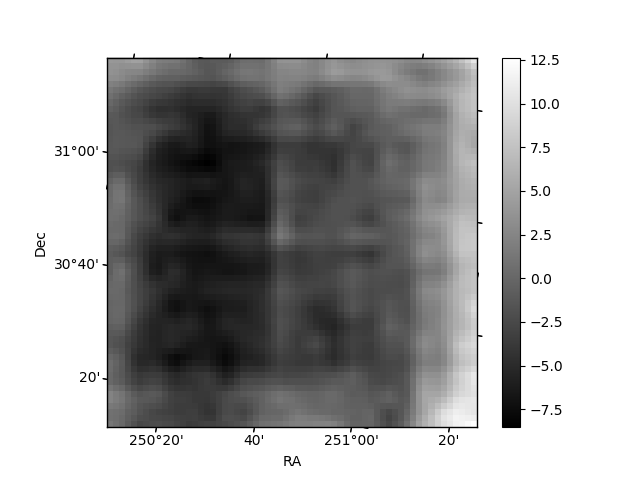
| Quadrant D | 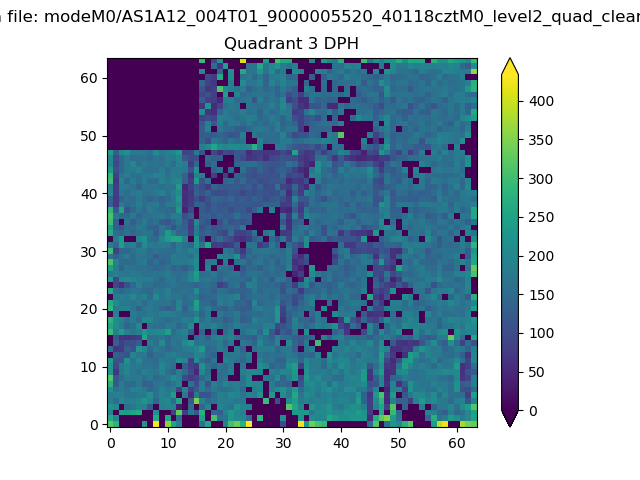 |
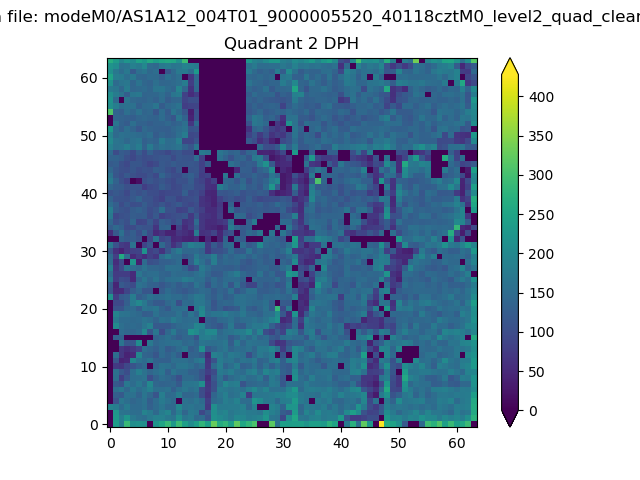 |
Quadrant C |
| Plot type | Count rate plots | Images |
|---|---|---|
| Comparison with Poisson distribution Blue bars denote a histogram of data divided into 1 sec bins. Red curve is a Poisson curve with rate = median count rate of data. |
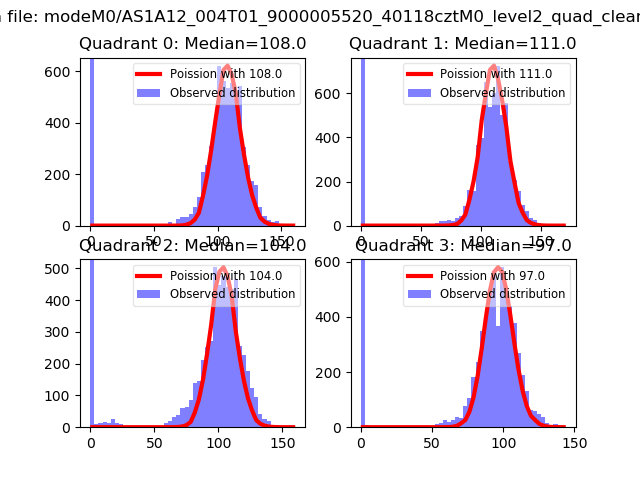 |
 |
| Quadrant-wise count rates Data is divided into 100 sec bins |
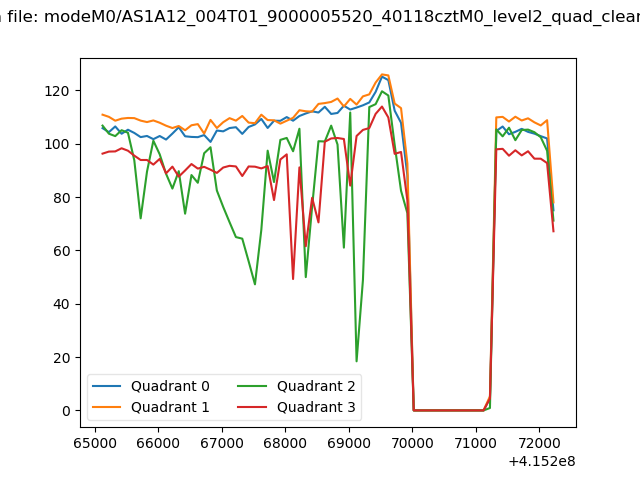 |
|
| Module-wise count rates for Quadrant A Data is divided into 100 sec bins |
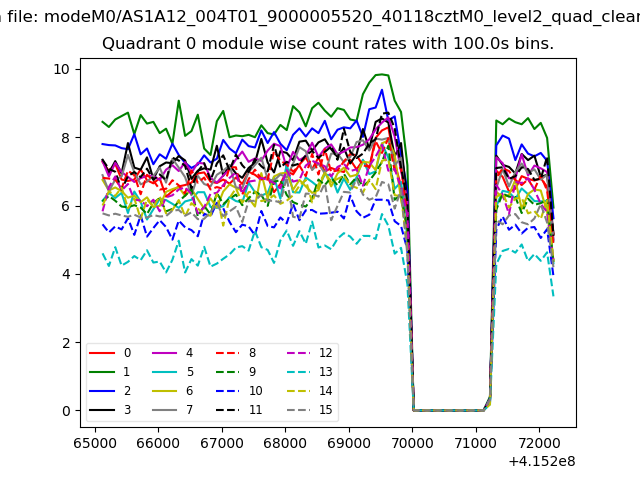 |
 |
| Module-wise count rates for Quadrant B Data is divided into 100 sec bins |
 |
 |
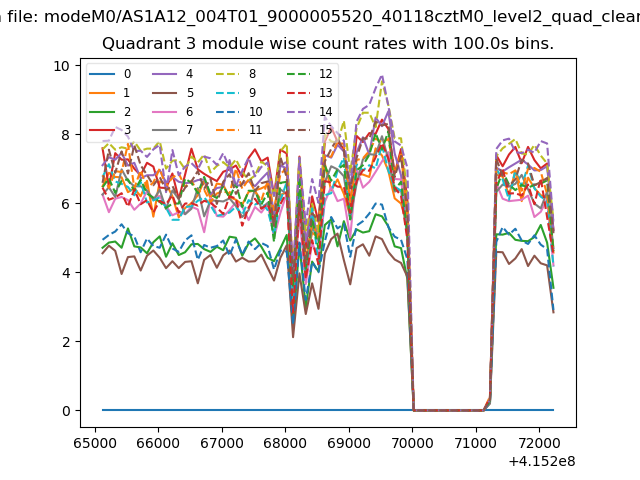
| Module-wise count rates for Quadrant C Data is divided into 100 sec bins |
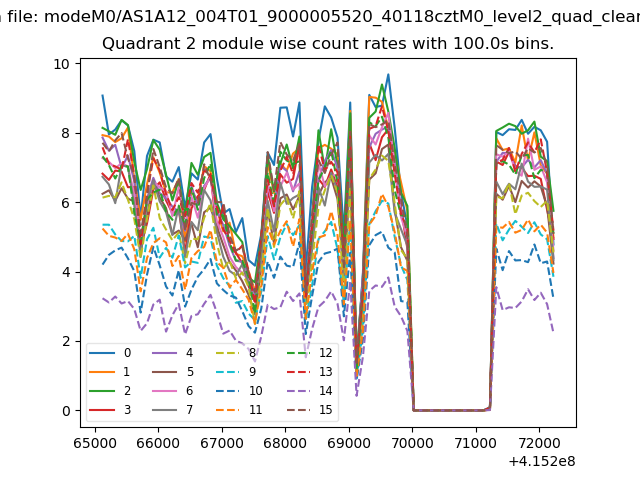 |
 |
| Module-wise count rates for Quadrant D Data is divided into 100 sec bins |
 |
 |
| Parameter | Plot |
|---|---|
| CZT HV Monitor | 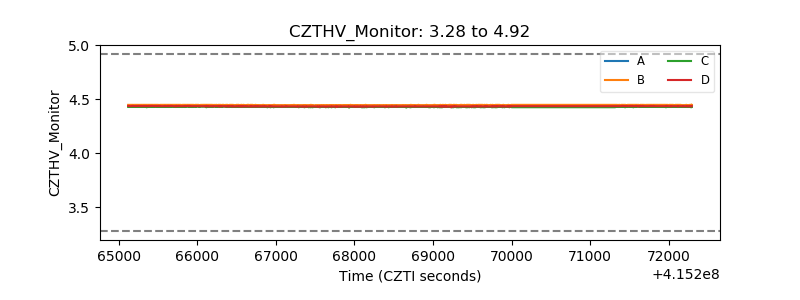 |
| D_VDD | 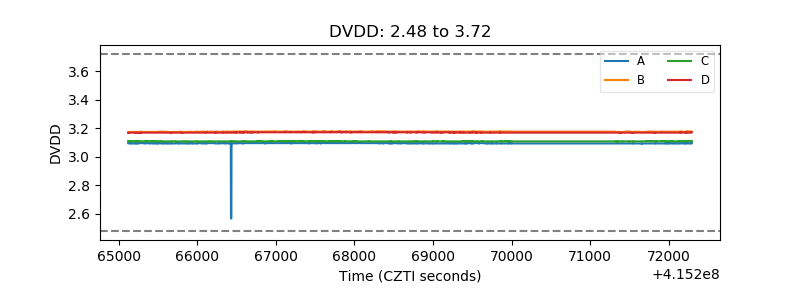 |
| Temperature 1 | 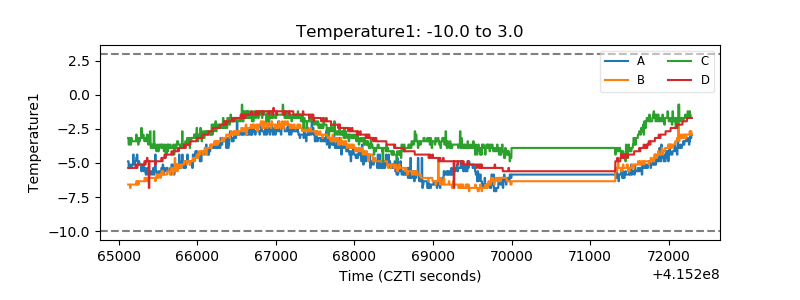 |
| Veto HV Monitor | 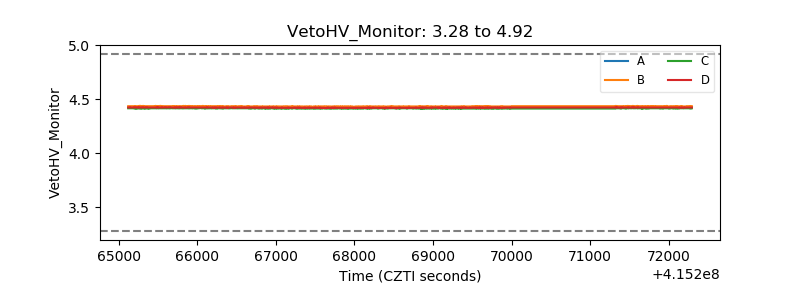 |
| Veto LLD | 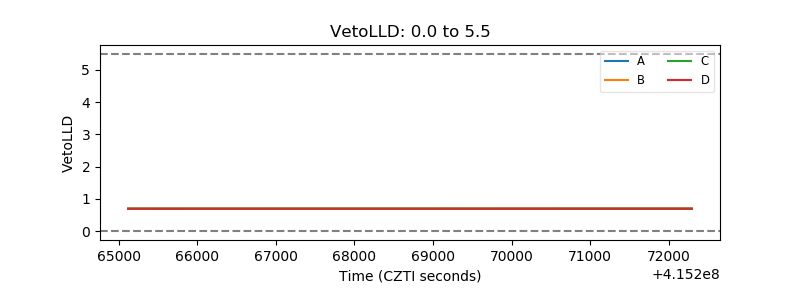 |
| Alpha Counter |  |
| _CPM_Rate | 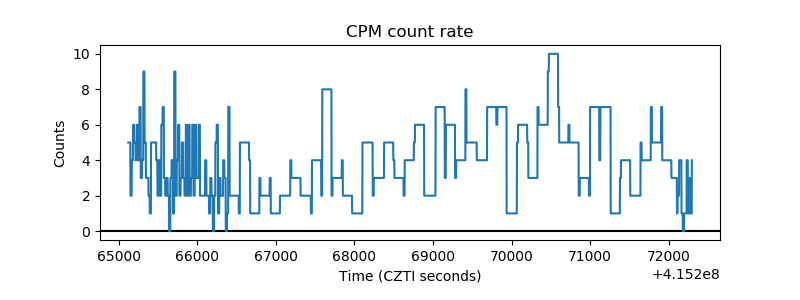 |
| CZT Counter | 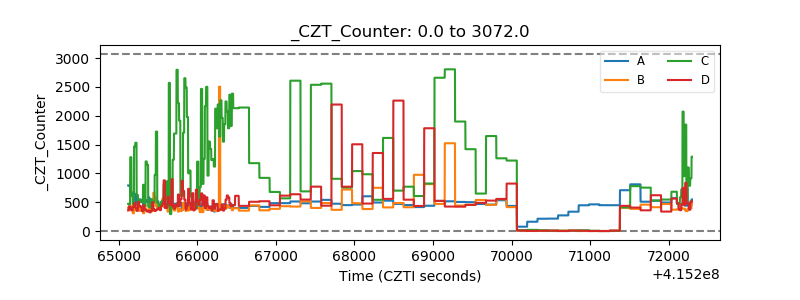 |
| +2.5 Volts monitor | 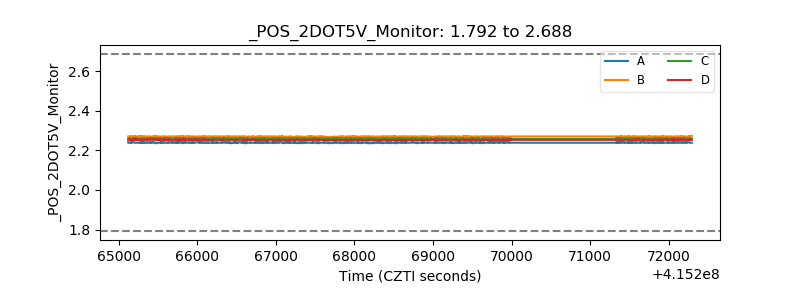 |
| +5 Volts monitor | 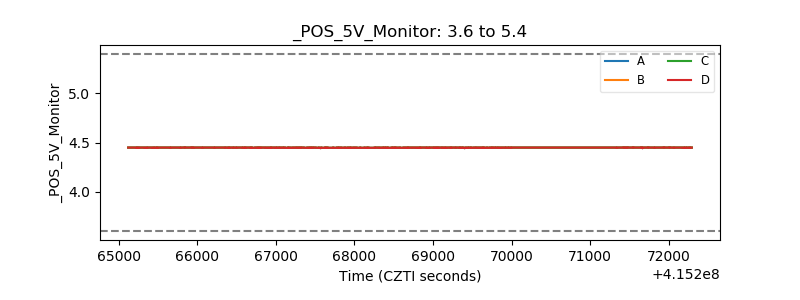 |
| _ROLL_ROT | 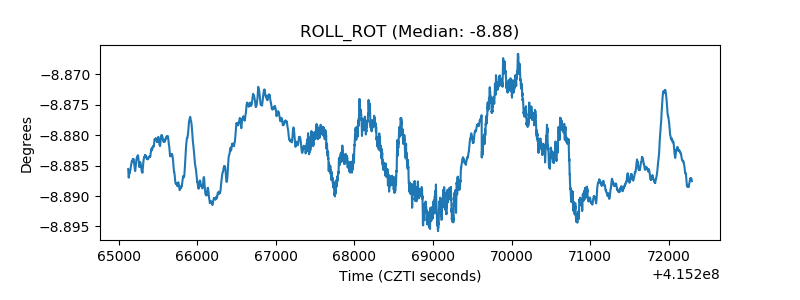 |
| _Roll_DEC | 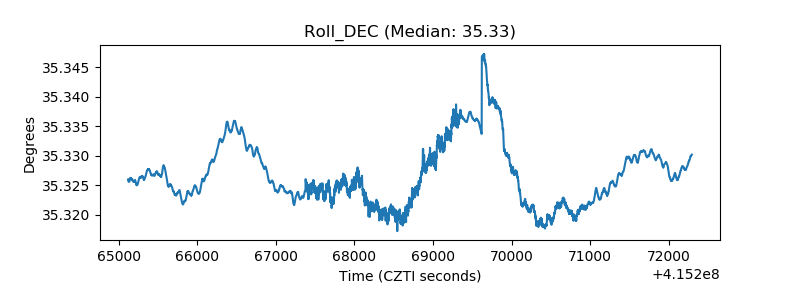 |
| _Roll_RA | 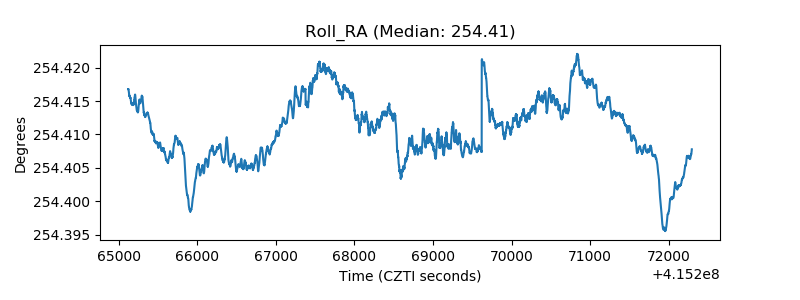 |
| Veto Counter |  |