| Param | Original file | Final file |
|---|---|---|
| Filename | modeM0/AS1A12_004T01_9000005520_40121cztM0_level2.fits | modeM0/AS1A12_004T01_9000005520_40121cztM0_level2_quad_clean.evt |
| Size (bytes) | 924,626,880 | 232,945,920 |
| Size | 881.8 MB | 222.2 MB |
| Events in quadrant A | 7,445,919 | 1,562,615 |
| Events in quadrant B | 6,903,200 | 1,601,918 |
| Events in quadrant C | 10,015,343 | 1,485,008 |
| Events in quadrant D | 8,726,622 | 1,391,728 |
| Mode M0 | |||
|---|---|---|---|
| Quadrant | BADHDUFLAG | Total packets | Discarded packets |
| A | 0 | 30915 | 3 |
| B | 0 | 30714 | 3 |
| C | 0 | 39111 | 3 |
| D | 0 | 36022 | 3 |
| Mode M9 | |||
|---|---|---|---|
| Quadrant | BADHDUFLAG | Total packets | Discarded packets |
| A | 0 | 43 | 0 |
| B | 0 | 42 | 0 |
| C | 0 | 42 | 0 |
| D | 0 | 43 | 0 |
| Mode SS | |||
|---|---|---|---|
| Quadrant | BADHDUFLAG | Total packets | Discarded packets |
| A | 0 | 298 | 0 |
| B | 0 | 298 | 0 |
| C | 0 | 298 | 0 |
| D | 0 | 298 | 0 |
| Quadrant | Total seconds | Saturated seconds | Saturation percentage |
|---|---|---|---|
| A | 14659 | 52 | 0.354731% |
| B | 14659 | 89 | 0.607136% |
| C | 14659 | 623 | 4.249949% |
| D | 14659 | 343 | 2.339859% |
Noise dominated data is calculated using 1-second bins in cleaned event files. If a bin has >2000 counts, and if more than 50% of those come from <1% of pixels, then it is considered to be noise-dominated and hence unusable.
| Quadrant | # 1 sec bins | Bins with >0 counts | Bins with >2000 counts | High rate bins dominated by noise | Noise dominated (total time) | Noise dominated (detector-on time) | Marked lightcurve |
|---|---|---|---|---|---|---|---|
| A | 17346 | 14661 | 38 | 38 | 0.22% | 0.26% | 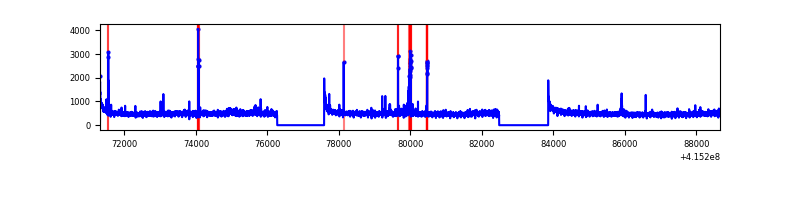 |
| B | 17346 | 14661 | 62 | 62 | 0.36% | 0.42% | 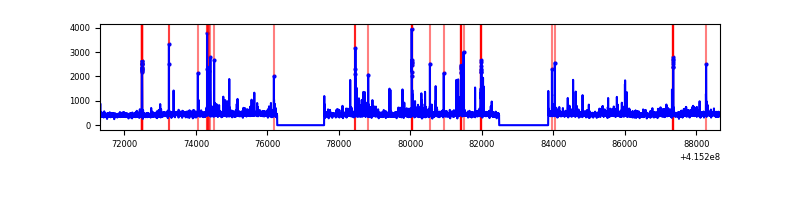 |
| C | 17346 | 14661 | 625 | 625 | 3.60% | 4.26% | 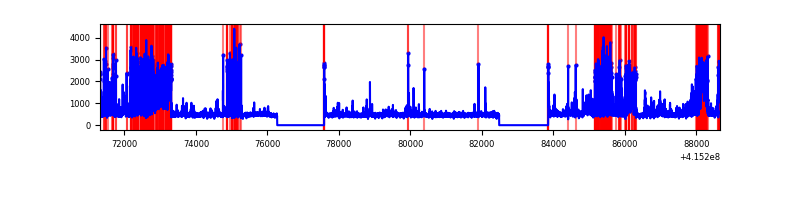 |
| D | 17346 | 14661 | 275 | 275 | 1.59% | 1.88% | 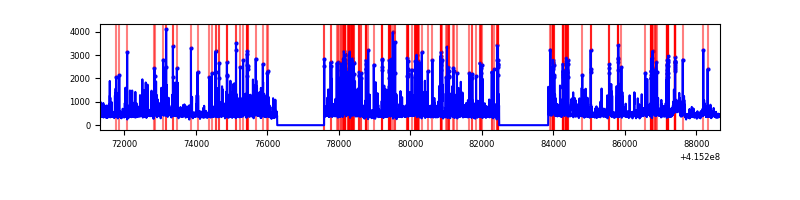 |
Top three noisy pixels from each quadrant. If the there are fewer than three noisy pixels in the level2.evt file, extra rows are filled as -1
| Pixel properties | Quadrant properties | ||||||
|---|---|---|---|---|---|---|---|
| Quadrant | DetID | PixID | Counts | Sigma | Mean | Median | Sigma |
| A | 10 | 83 | 1059799 | 3286.59 | 1583 | 1548 | 322.0 |
| A | 13 | 248 | 70360 | 213.71 | 1583 | 1548 | 322.0 |
| A | 15 | 223 | 69068 | 209.7 | 1583 | 1548 | 322.0 |
| B | 5 | 255 | 350134 | 1139.78 | 1580 | 1535 | 305.8 |
| B | 0 | 190 | 137325 | 443.98 | 1580 | 1535 | 305.8 |
| B | 4 | 171 | 51209 | 162.41 | 1580 | 1535 | 305.8 |
| C | 9 | 187 | 3087099 | 8599.77 | 1534 | 1542 | 358.8 |
| C | 15 | 214 | 587546 | 1633.26 | 1534 | 1542 | 358.8 |
| C | 10 | 20 | 157022 | 433.34 | 1534 | 1542 | 358.8 |
| D | 13 | 249 | 710833 | 1889.95 | 1532 | 1490 | 375.3 |
| D | 2 | 249 | 631392 | 1678.29 | 1532 | 1490 | 375.3 |
| D | 12 | 227 | 532305 | 1414.28 | 1532 | 1490 | 375.3 |
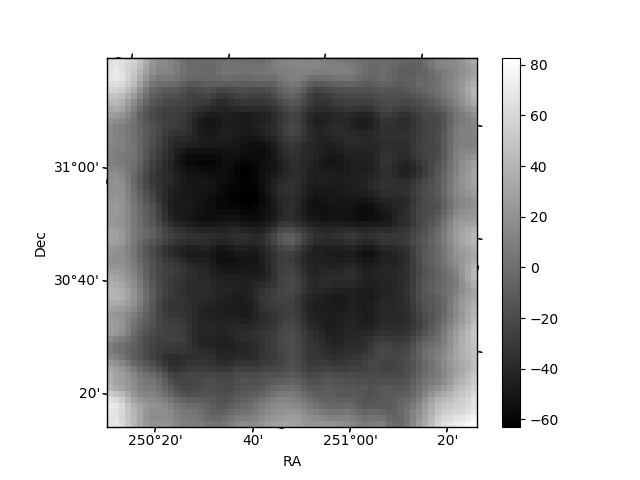
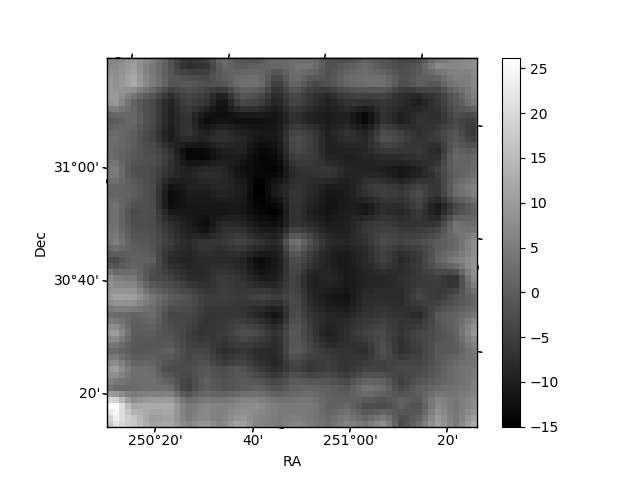
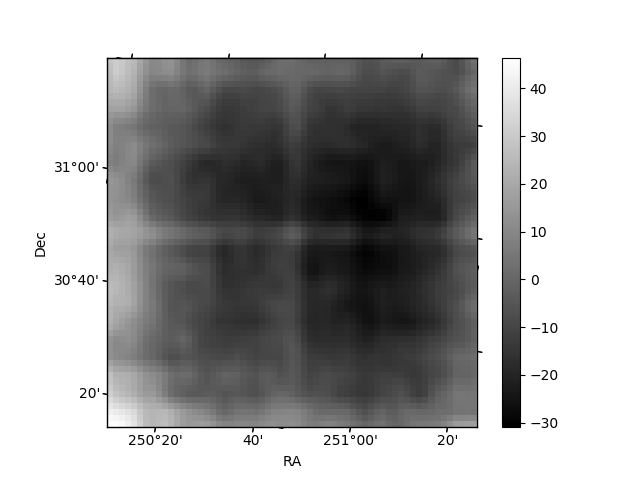
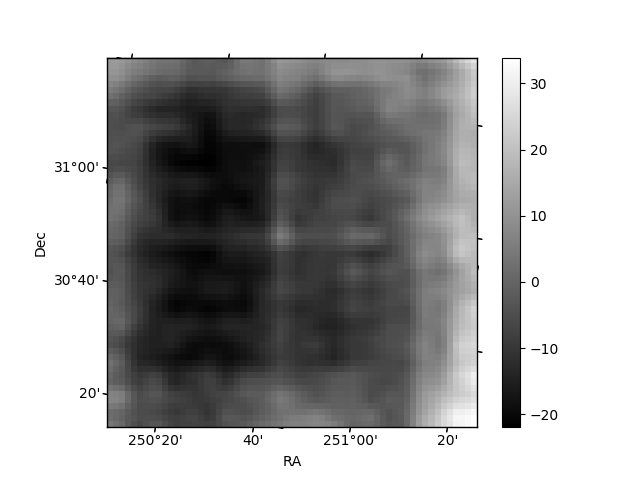
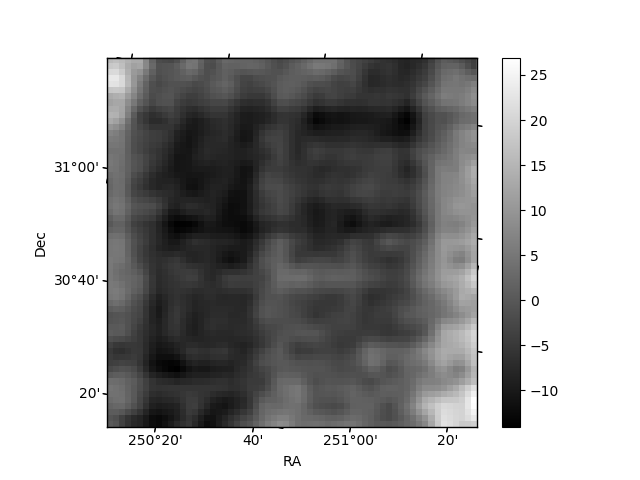
Histogram calculated using DETX and DETY for each event in the final _common_clean file
| Quadrant A | 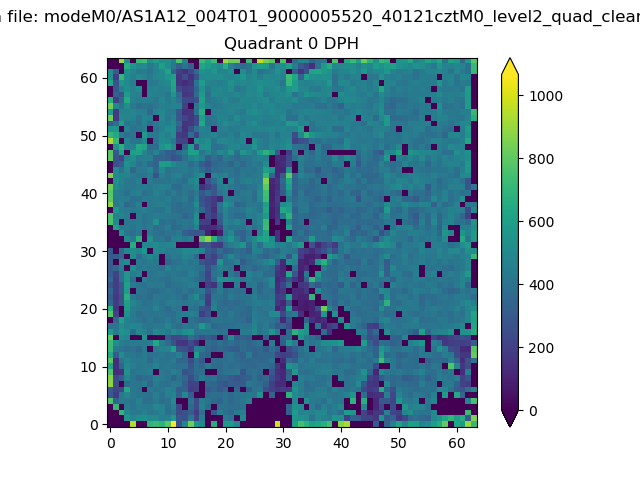 |
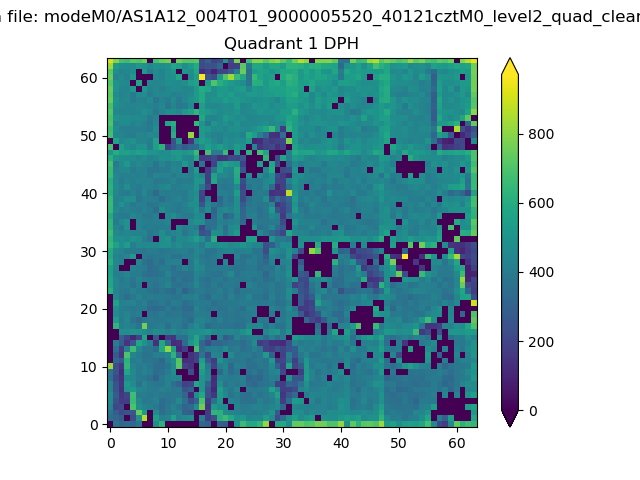 |
Quadrant B |
|---|---|---|---|
| Quadrant D | 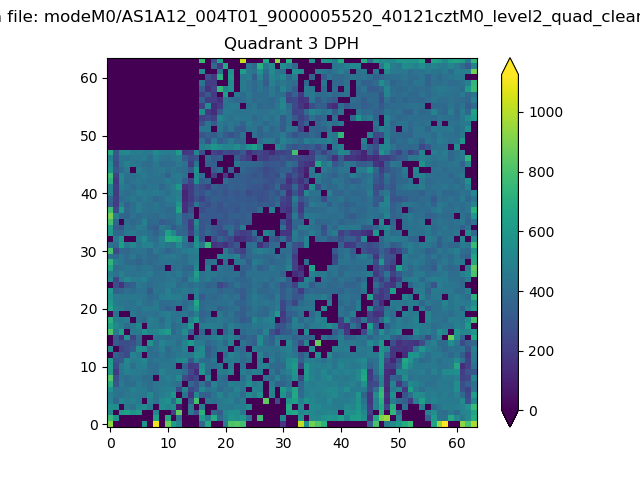 |
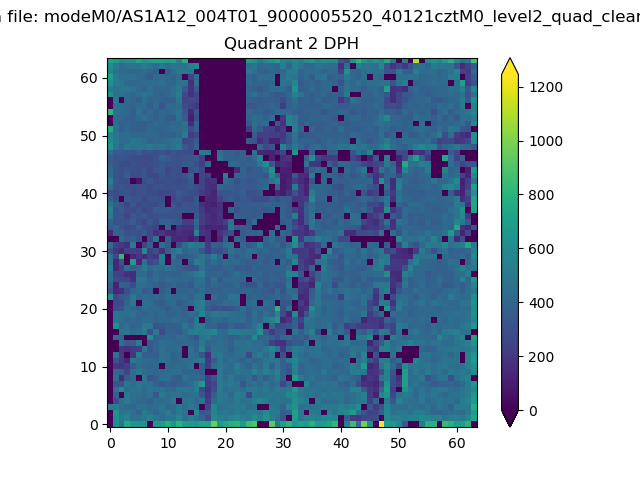 |
Quadrant C |
| Plot type | Count rate plots | Images |
|---|---|---|
| Comparison with Poisson distribution Blue bars denote a histogram of data divided into 1 sec bins. Red curve is a Poisson curve with rate = median count rate of data. |
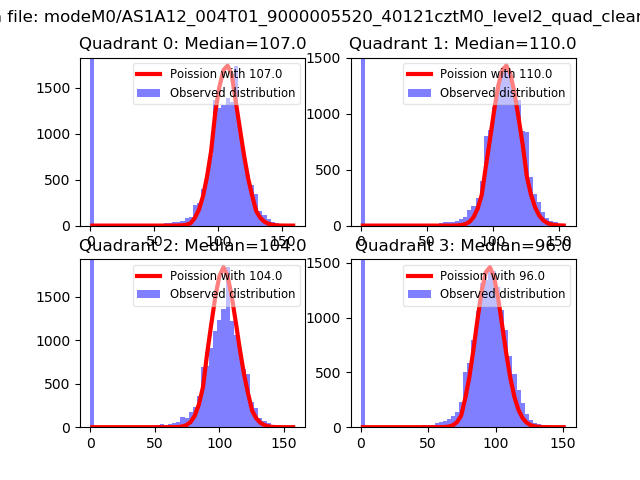 |
 |
| Quadrant-wise count rates Data is divided into 100 sec bins |
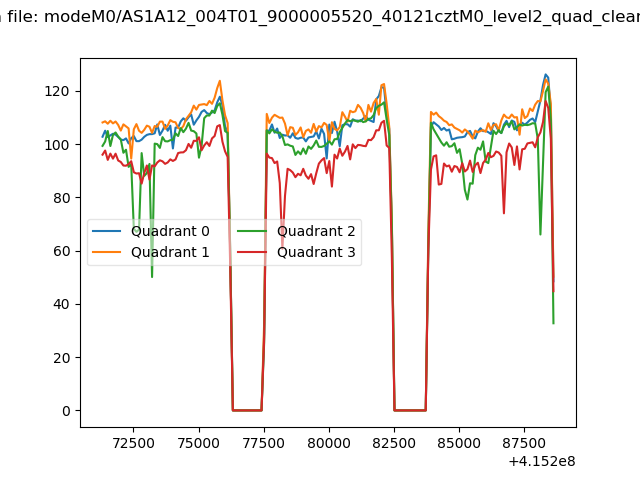 |
|
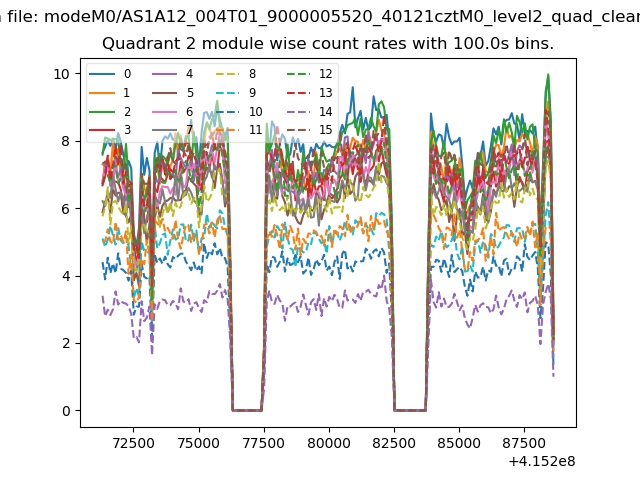
| Module-wise count rates for Quadrant A Data is divided into 100 sec bins |
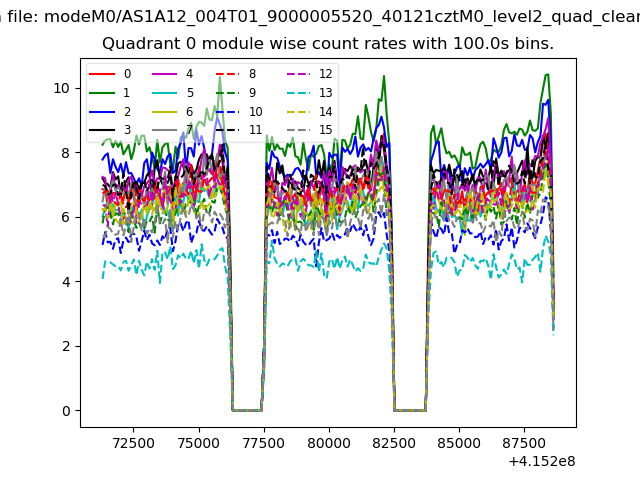 |
 |
| Module-wise count rates for Quadrant B Data is divided into 100 sec bins |
 |
 |
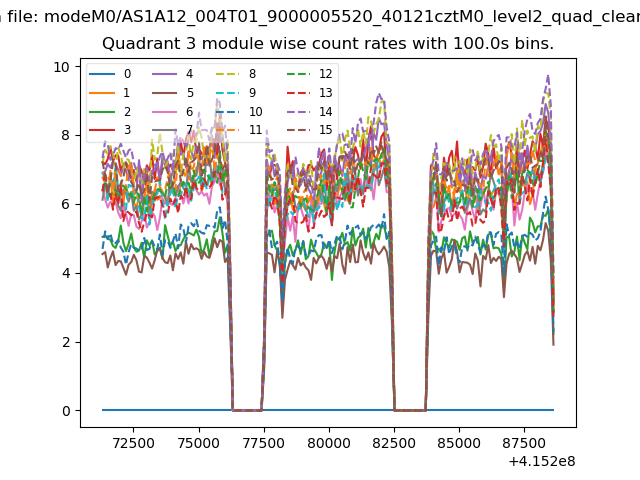
| Module-wise count rates for Quadrant C Data is divided into 100 sec bins |
 |
 |
| Module-wise count rates for Quadrant D Data is divided into 100 sec bins |
 |
 |
| Parameter | Plot |
|---|---|
| CZT HV Monitor | 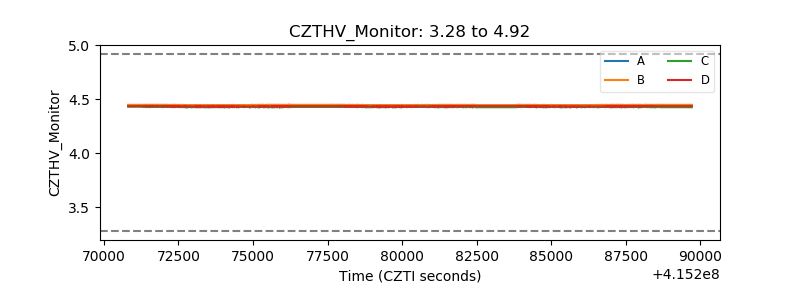 |
| D_VDD | 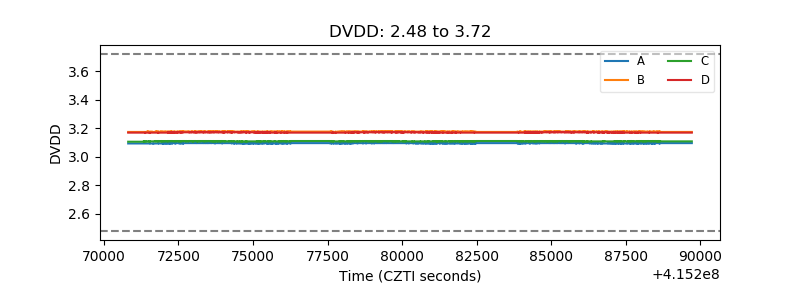 |
| Temperature 1 | 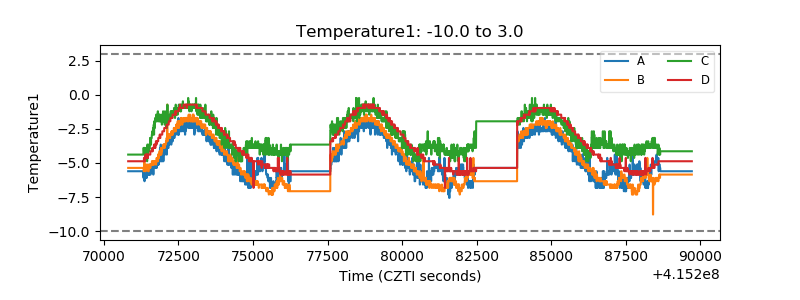 |
| Veto HV Monitor | 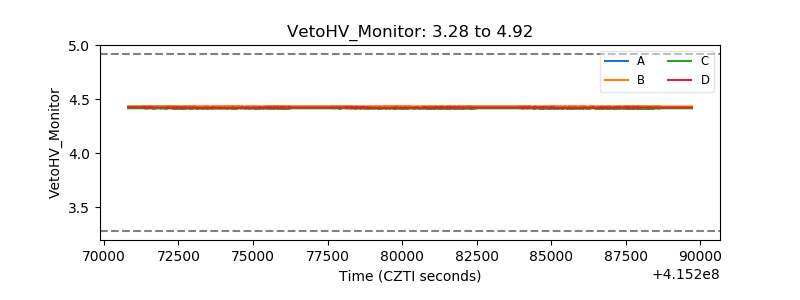 |
| Veto LLD | 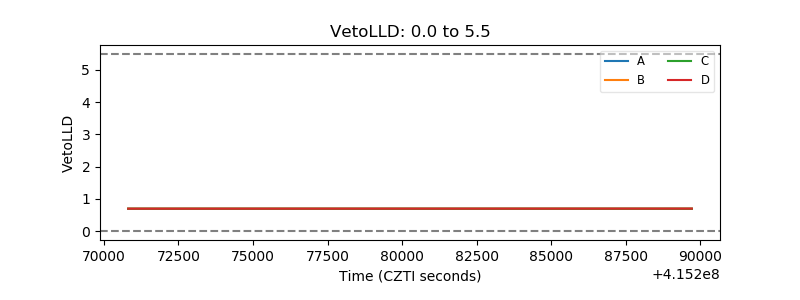 |
| Alpha Counter |  |
| _CPM_Rate | 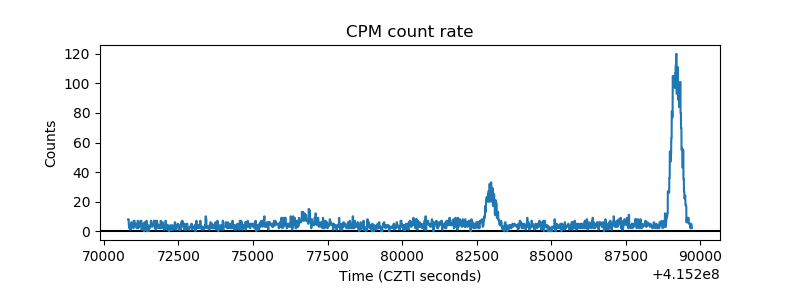 |
| CZT Counter | 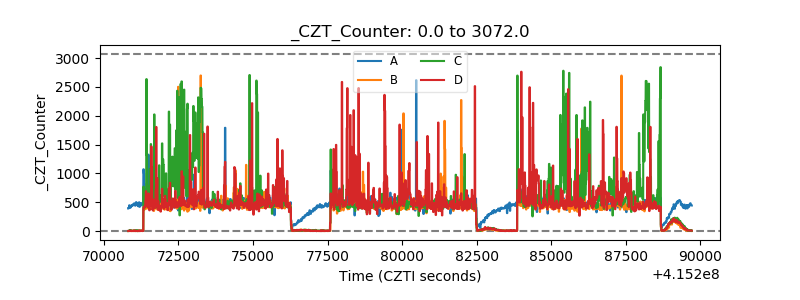 |
| +2.5 Volts monitor | 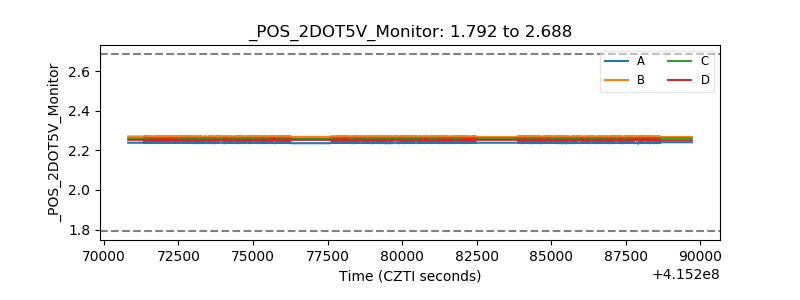 |
| +5 Volts monitor | 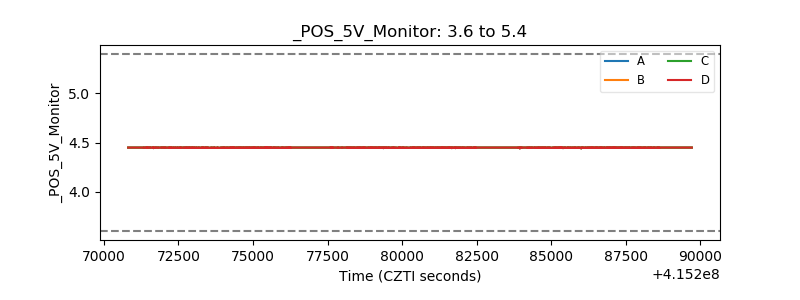 |
| _ROLL_ROT | 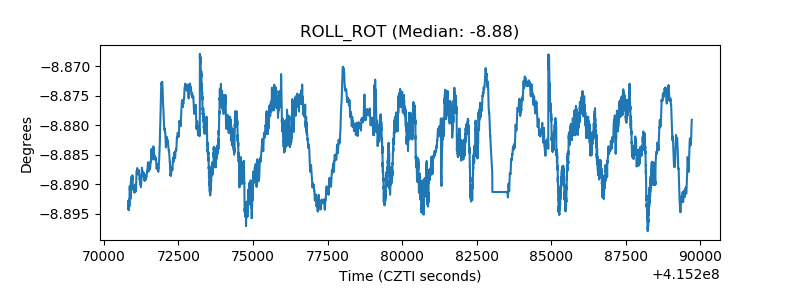 |
| _Roll_DEC | 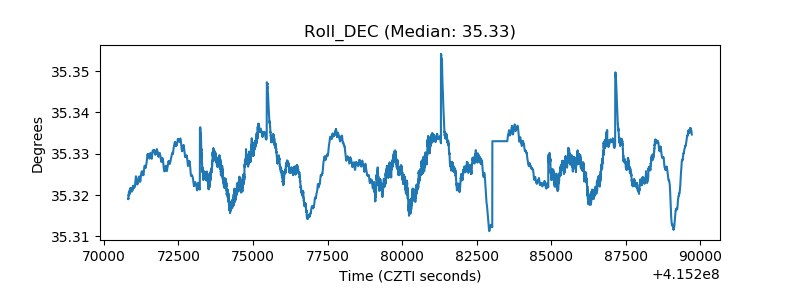 |
| _Roll_RA | 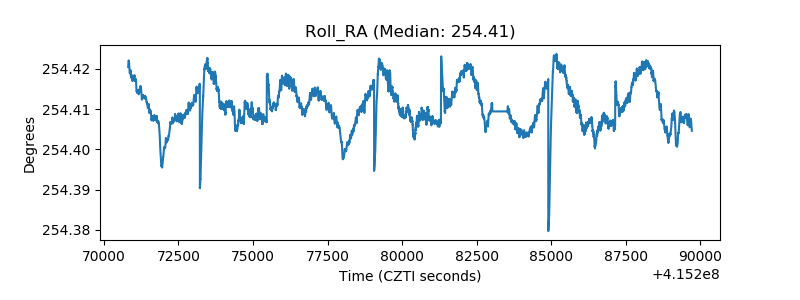 |
| Veto Counter | 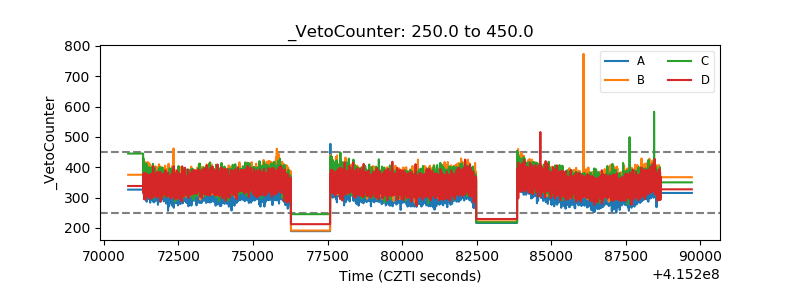 |