| Param | Original file | Final file |
|---|---|---|
| Filename | modeM0/AS1A12_004T01_9000005520_40122cztM0_level2.fits | modeM0/AS1A12_004T01_9000005520_40122cztM0_level2_quad_clean.evt |
| Size (bytes) | 364,363,200 | 91,088,640 |
| Size | 347.5 MB | 86.9 MB |
| Events in quadrant A | 2,924,771 | 621,030 |
| Events in quadrant B | 2,692,943 | 631,862 |
| Events in quadrant C | 4,069,715 | 569,917 |
| Events in quadrant D | 3,358,723 | 539,149 |
| Mode M0 | |||
|---|---|---|---|
| Quadrant | BADHDUFLAG | Total packets | Discarded packets |
| A | 0 | 12285 | 3 |
| B | 0 | 11949 | 2 |
| C | 0 | 15716 | 2 |
| D | 0 | 13974 | 2 |
| Mode M9 | |||
|---|---|---|---|
| Quadrant | BADHDUFLAG | Total packets | Discarded packets |
| A | 0 | 22 | 0 |
| B | 0 | 22 | 0 |
| C | 0 | 22 | 0 |
| D | 0 | 23 | 0 |
| Mode SS | |||
|---|---|---|---|
| Quadrant | BADHDUFLAG | Total packets | Discarded packets |
| A | 0 | 114 | 0 |
| B | 0 | 114 | 0 |
| C | 0 | 114 | 0 |
| D | 0 | 114 | 0 |
| Quadrant | Total seconds | Saturated seconds | Saturation percentage |
|---|---|---|---|
| A | 5665 | 20 | 0.353045% |
| B | 5665 | 38 | 0.670786% |
| C | 5665 | 405 | 7.149162% |
| D | 5665 | 233 | 4.112974% |
Noise dominated data is calculated using 1-second bins in cleaned event files. If a bin has >2000 counts, and if more than 50% of those come from <1% of pixels, then it is considered to be noise-dominated and hence unusable.
| Quadrant | # 1 sec bins | Bins with >0 counts | Bins with >2000 counts | High rate bins dominated by noise | Noise dominated (total time) | Noise dominated (detector-on time) | Marked lightcurve |
|---|---|---|---|---|---|---|---|
| A | 7277 | 5666 | 6 | 6 | 0.08% | 0.11% | 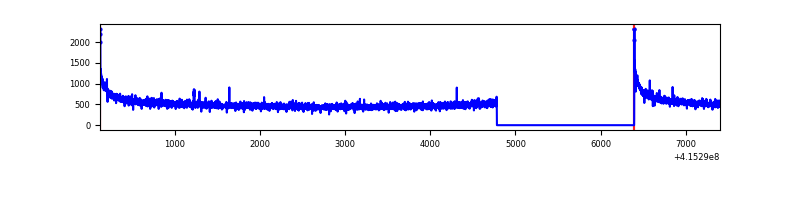 |
| B | 7277 | 5666 | 25 | 25 | 0.34% | 0.44% | 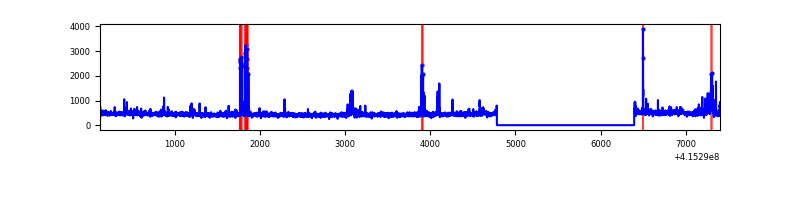 |
| C | 7277 | 5666 | 368 | 368 | 5.06% | 6.49% | 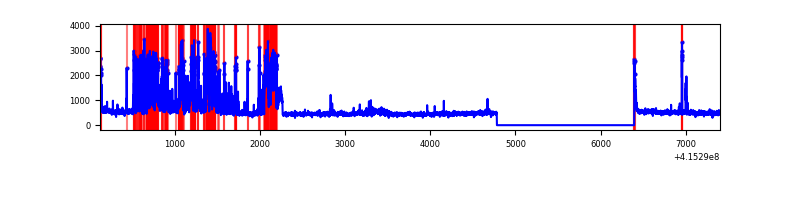 |
| D | 7277 | 5666 | 204 | 204 | 2.80% | 3.60% | 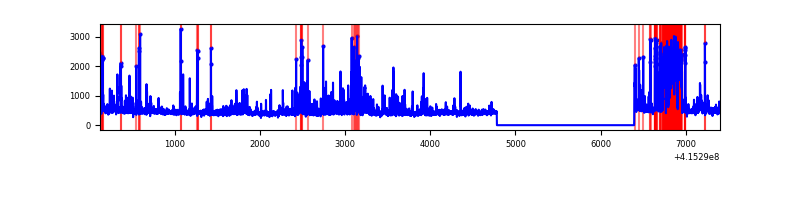 |
Top three noisy pixels from each quadrant. If the there are fewer than three noisy pixels in the level2.evt file, extra rows are filled as -1
| Pixel properties | Quadrant properties | ||||||
|---|---|---|---|---|---|---|---|
| Quadrant | DetID | PixID | Counts | Sigma | Mean | Median | Sigma |
| A | 10 | 83 | 501907 | 3928.93 | 621 | 609 | 127.6 |
| A | 12 | 189 | 10446 | 77.1 | 621 | 609 | 127.6 |
| A | 3 | 137 | 6821 | 48.69 | 621 | 609 | 127.6 |
| B | 5 | 255 | 153052 | 1263.27 | 618 | 600 | 120.7 |
| B | 4 | 171 | 53682 | 439.86 | 618 | 600 | 120.7 |
| B | 0 | 230 | 19054 | 152.92 | 618 | 600 | 120.7 |
| C | 9 | 187 | 1404983 | 10116.59 | 592 | 595 | 138.8 |
| C | 15 | 214 | 228966 | 1645.08 | 592 | 595 | 138.8 |
| C | 0 | 10 | 58997 | 420.7 | 592 | 595 | 138.8 |
| D | 5 | 32 | 354344 | 2392.82 | 598 | 579 | 147.8 |
| D | 13 | 249 | 194154 | 1309.31 | 598 | 579 | 147.8 |
| D | 2 | 250 | 131426 | 885.03 | 598 | 579 | 147.8 |
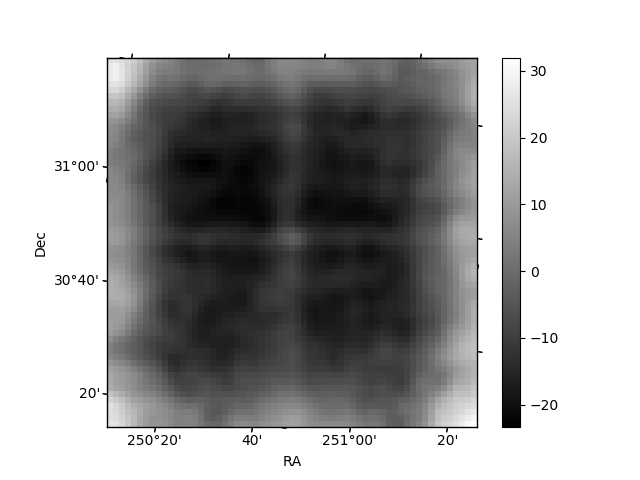
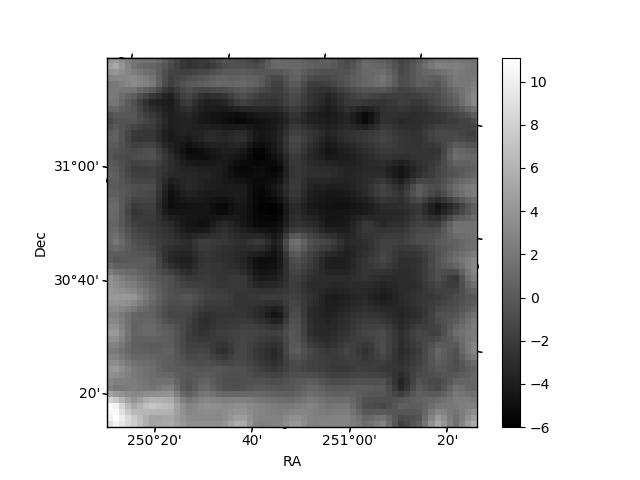
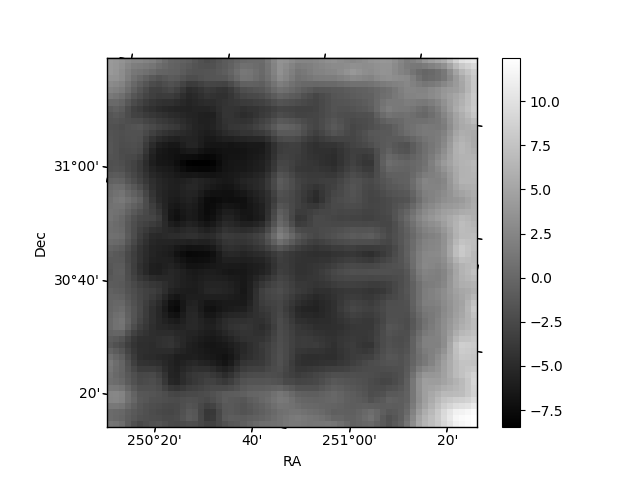
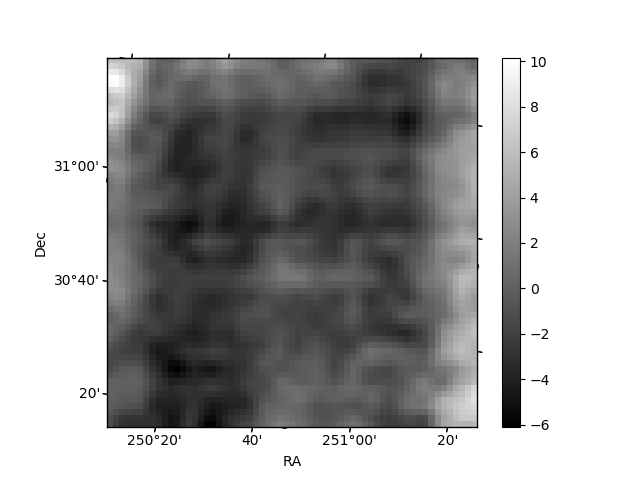
Histogram calculated using DETX and DETY for each event in the final _common_clean file
| Quadrant A | 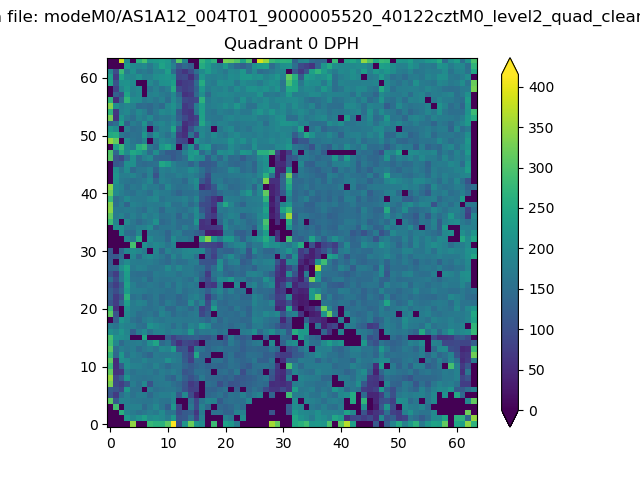 |
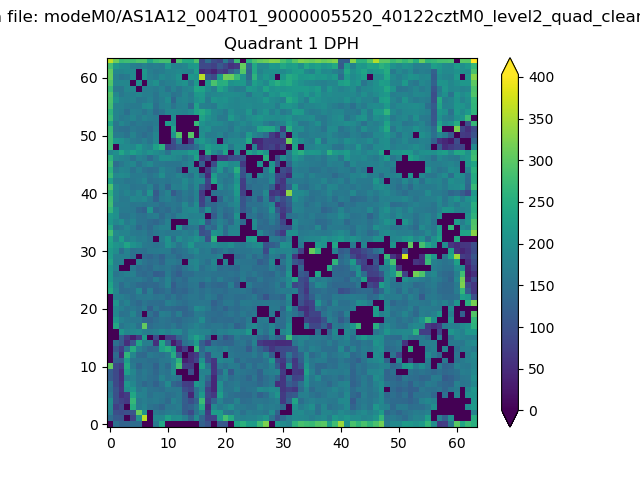 |
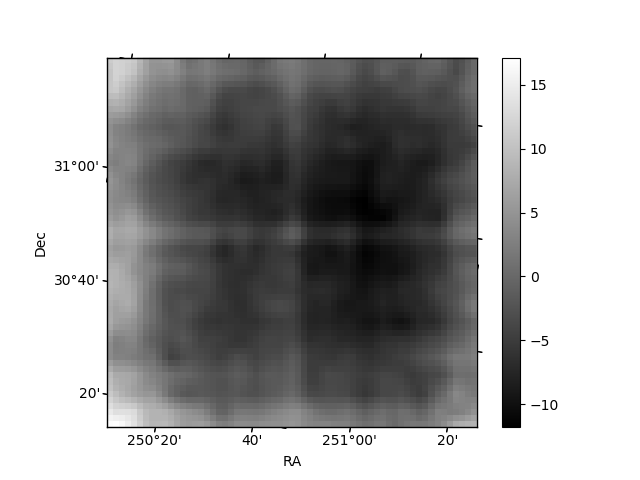
Quadrant B |
|---|---|---|---|
| Quadrant D | 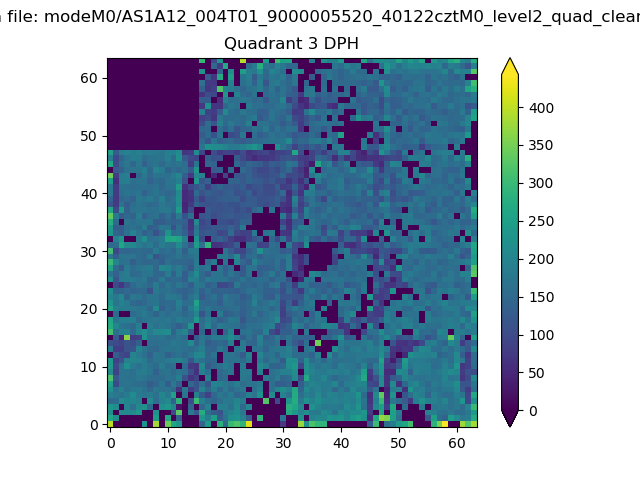 |
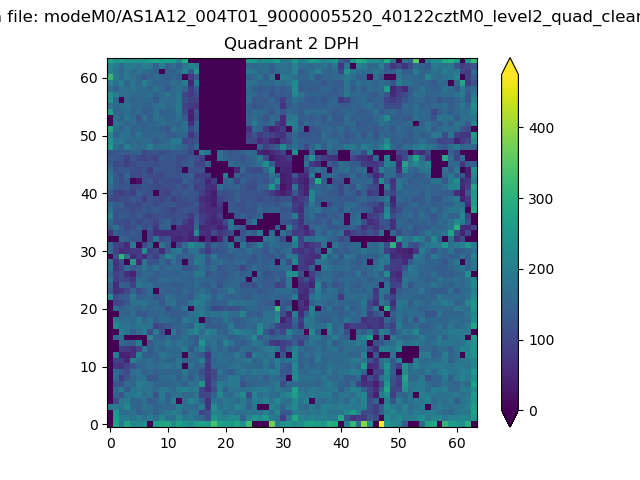 |
Quadrant C |
| Plot type | Count rate plots | Images |
|---|---|---|
| Comparison with Poisson distribution Blue bars denote a histogram of data divided into 1 sec bins. Red curve is a Poisson curve with rate = median count rate of data. |
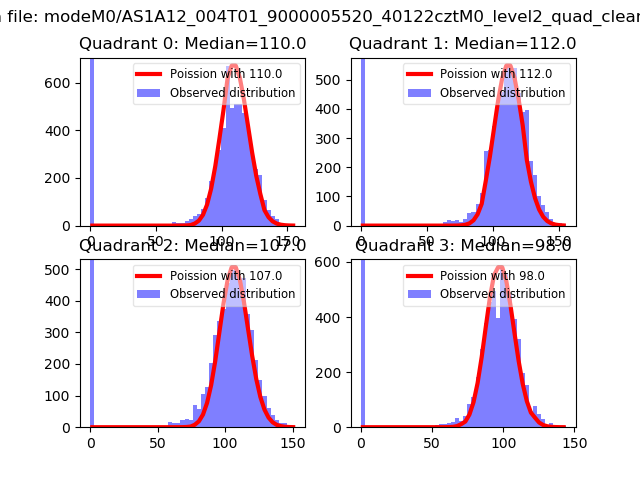 |
 |
| Quadrant-wise count rates Data is divided into 100 sec bins |
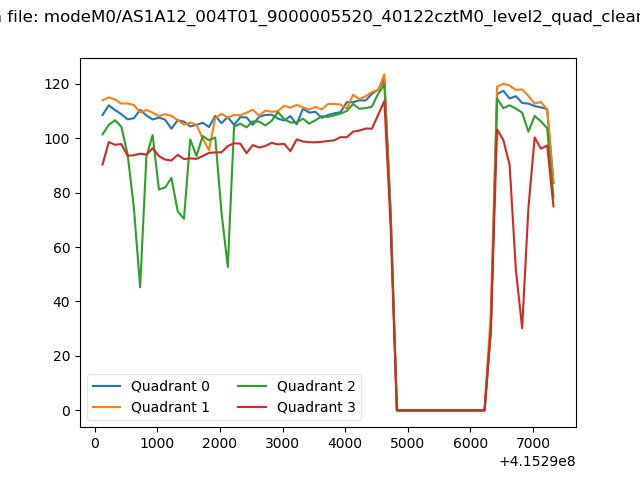 |
|
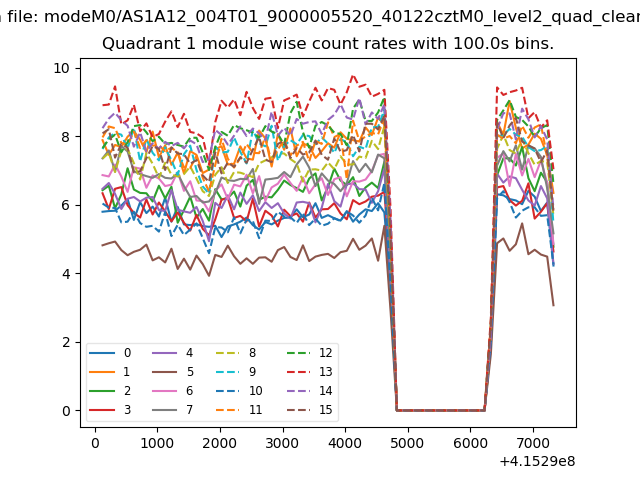
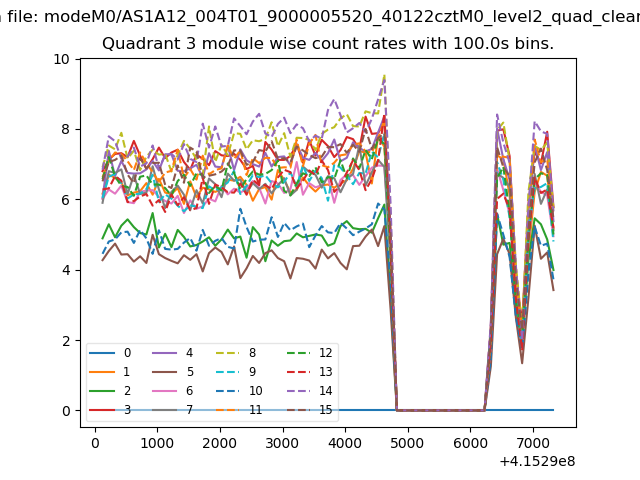
| Module-wise count rates for Quadrant A Data is divided into 100 sec bins |
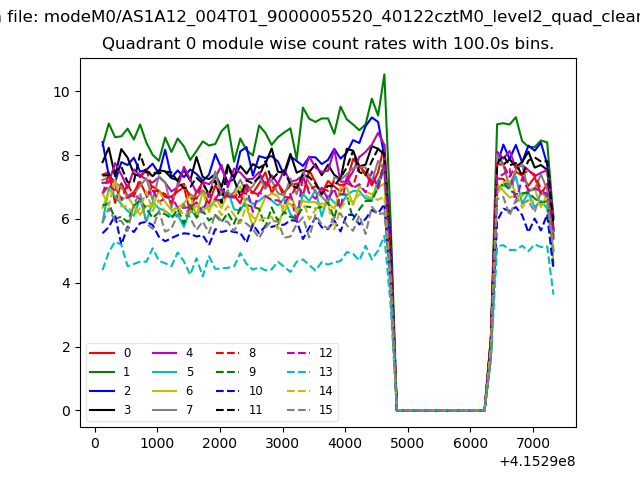 |
 |
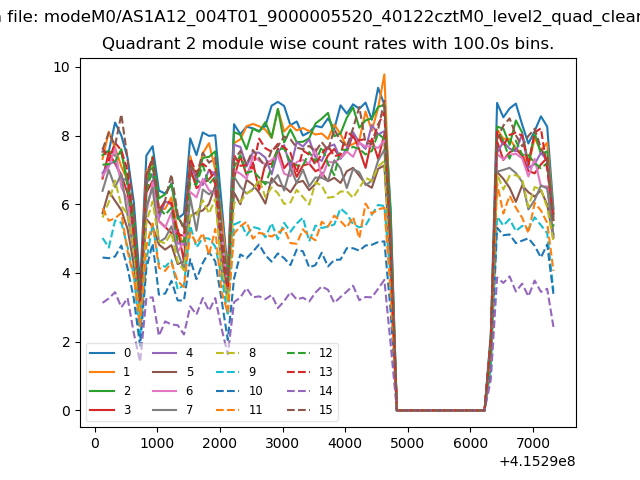
| Module-wise count rates for Quadrant B Data is divided into 100 sec bins |
 |
 |
| Module-wise count rates for Quadrant C Data is divided into 100 sec bins |
 |
 |
| Module-wise count rates for Quadrant D Data is divided into 100 sec bins |
 |
 |
| Parameter | Plot |
|---|---|
| CZT HV Monitor | 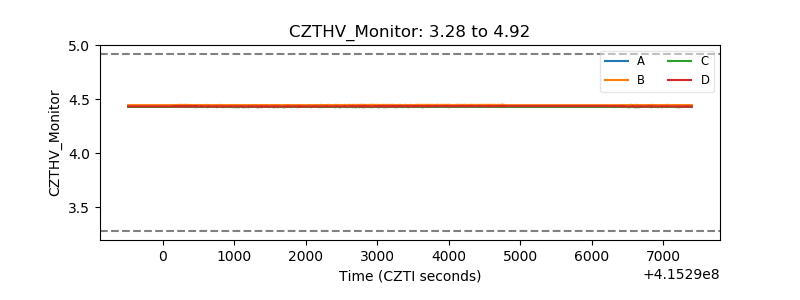 |
| D_VDD | 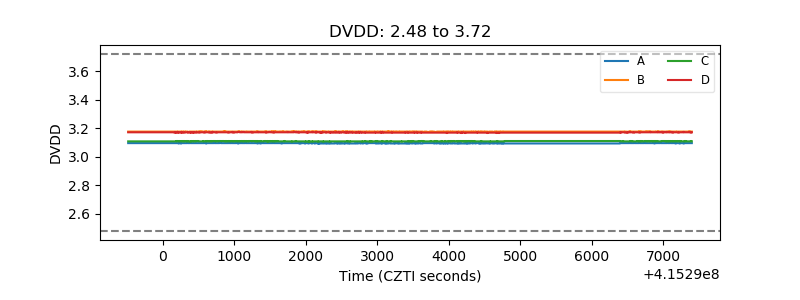 |
| Temperature 1 | 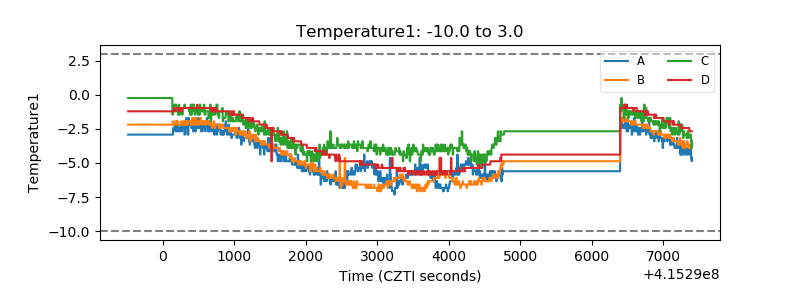 |
| Veto HV Monitor | 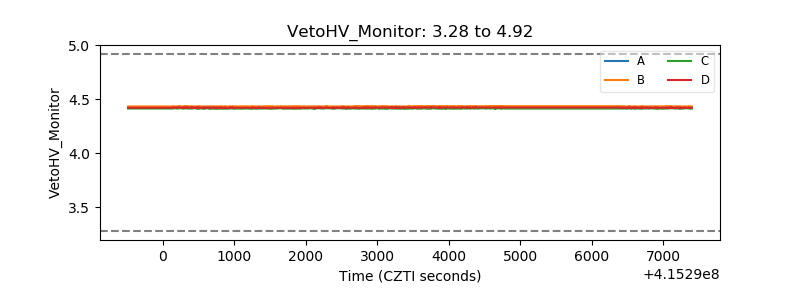 |
| Veto LLD | 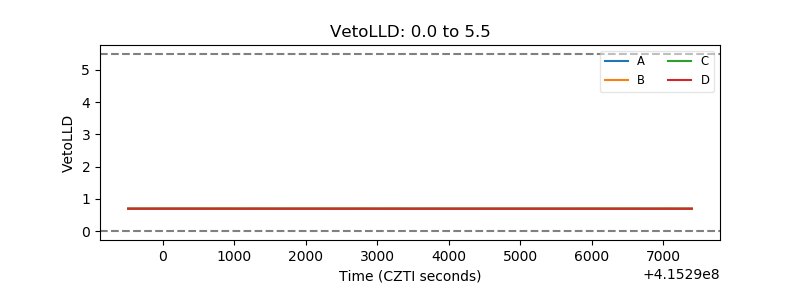 |
| Alpha Counter | 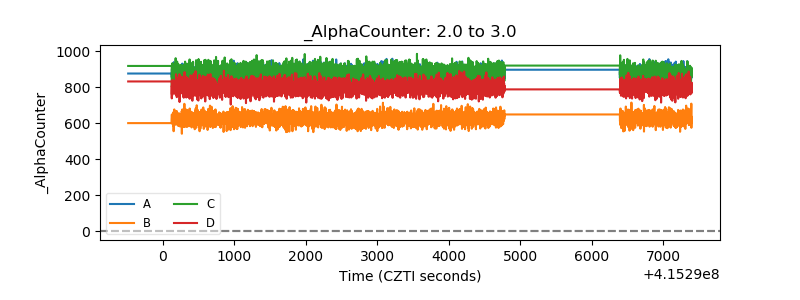 |
| _CPM_Rate | 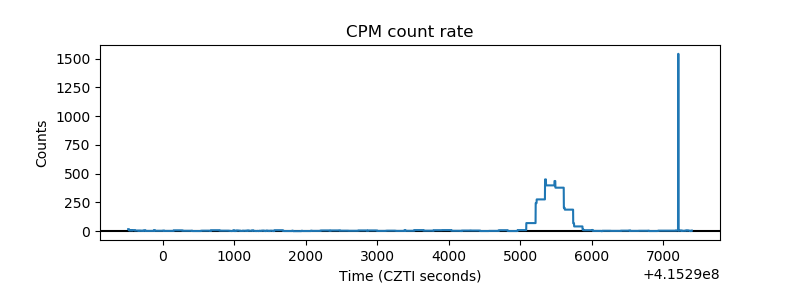 |
| CZT Counter | 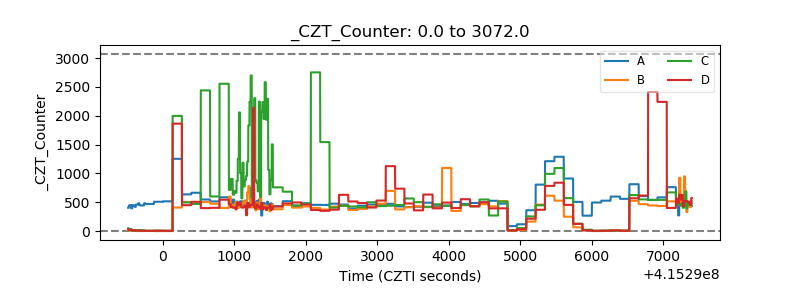 |
| +2.5 Volts monitor | 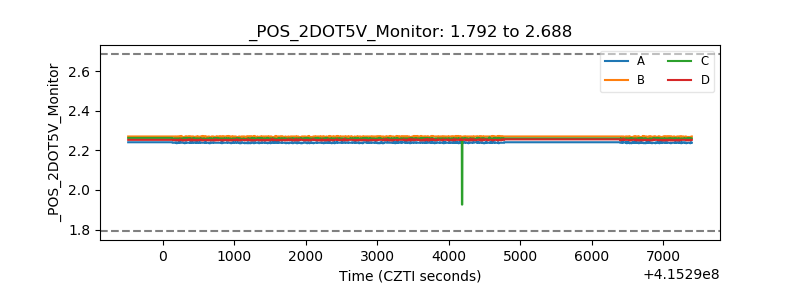 |
| +5 Volts monitor |  |
| _ROLL_ROT | 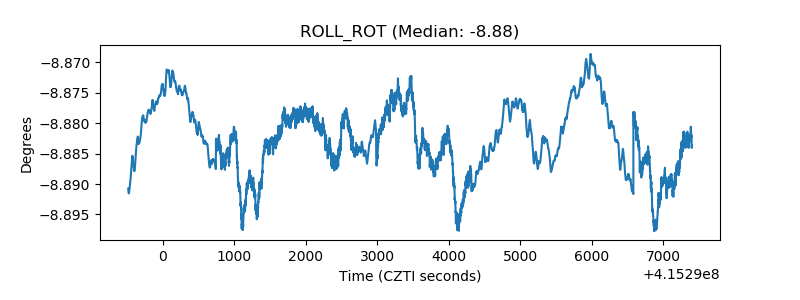 |
| _Roll_DEC | 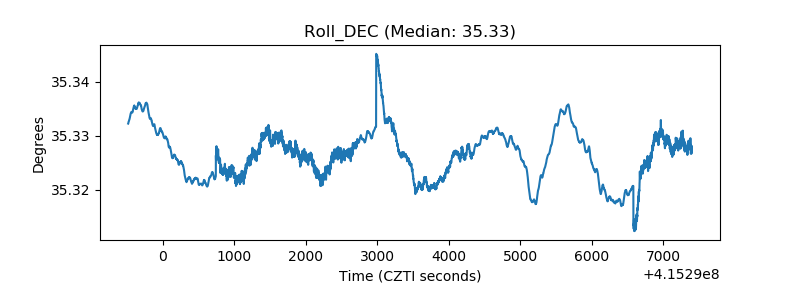 |
| _Roll_RA | 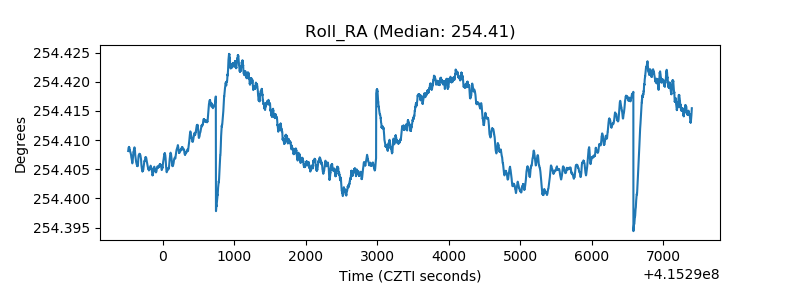 |
| Veto Counter | 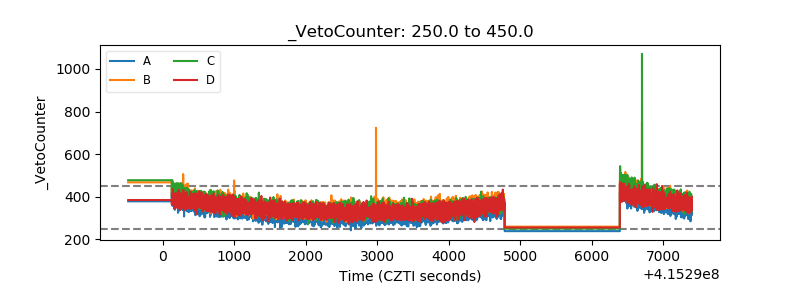 |