| Param | Original file | Final file |
|---|---|---|
| Filename | modeM0/AS1A12_004T01_9000005520_40123cztM0_level2.fits | modeM0/AS1A12_004T01_9000005520_40123cztM0_level2_quad_clean.evt |
| Size (bytes) | 321,917,760 | 88,312,320 |
| Size | 307.0 MB | 84.2 MB |
| Events in quadrant A | 2,748,067 | 593,431 |
| Events in quadrant B | 2,670,553 | 608,226 |
| Events in quadrant C | 2,607,413 | 581,487 |
| Events in quadrant D | 3,474,779 | 517,438 |
| Mode M0 | |||
|---|---|---|---|
| Quadrant | BADHDUFLAG | Total packets | Discarded packets |
| A | 0 | 11652 | 3 |
| B | 0 | 11712 | 2 |
| C | 0 | 11184 | 2 |
| D | 0 | 14127 | 2 |
| Mode M9 | |||
|---|---|---|---|
| Quadrant | BADHDUFLAG | Total packets | Discarded packets |
| A | 0 | 27 | 0 |
| B | 0 | 27 | 0 |
| C | 0 | 27 | 0 |
| D | 0 | 28 | 0 |
| Mode SS | |||
|---|---|---|---|
| Quadrant | BADHDUFLAG | Total packets | Discarded packets |
| A | 0 | 110 | 0 |
| B | 0 | 110 | 0 |
| C | 0 | 110 | 0 |
| D | 0 | 110 | 0 |
| Quadrant | Total seconds | Saturated seconds | Saturation percentage |
|---|---|---|---|
| A | 5329 | 21 | 0.394070% |
| B | 5329 | 59 | 1.107150% |
| C | 5329 | 43 | 0.806906% |
| D | 5329 | 292 | 5.479452% |
Noise dominated data is calculated using 1-second bins in cleaned event files. If a bin has >2000 counts, and if more than 50% of those come from <1% of pixels, then it is considered to be noise-dominated and hence unusable.
| Quadrant | # 1 sec bins | Bins with >0 counts | Bins with >2000 counts | High rate bins dominated by noise | Noise dominated (total time) | Noise dominated (detector-on time) | Marked lightcurve |
|---|---|---|---|---|---|---|---|
| A | 7030 | 5330 | 6 | 6 | 0.09% | 0.11% | 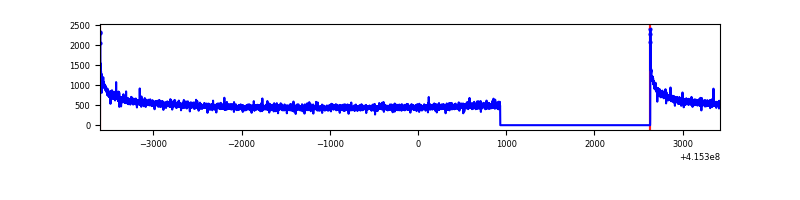 |
| B | 7030 | 5330 | 33 | 33 | 0.47% | 0.62% | 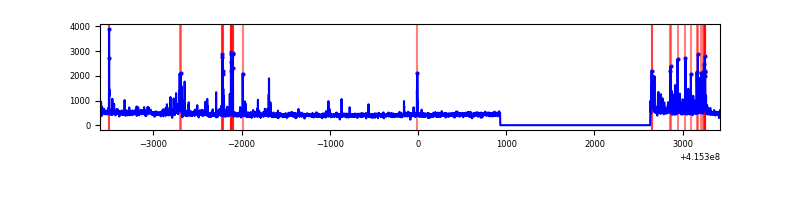 |
| C | 7030 | 5330 | 32 | 32 | 0.46% | 0.60% | 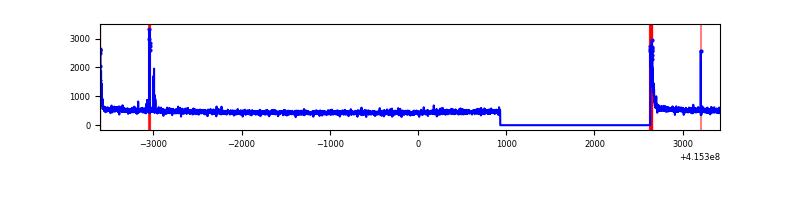 |
| D | 7030 | 5330 | 256 | 256 | 3.64% | 4.80% | 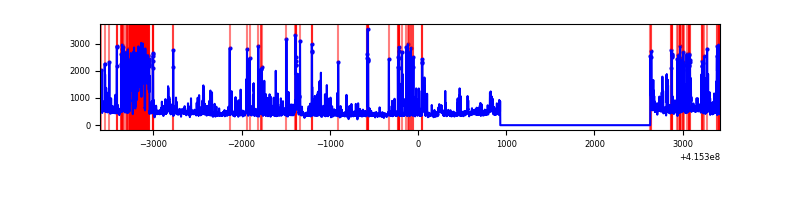 |
Top three noisy pixels from each quadrant. If the there are fewer than three noisy pixels in the level2.evt file, extra rows are filled as -1
| Pixel properties | Quadrant properties | ||||||
|---|---|---|---|---|---|---|---|
| Quadrant | DetID | PixID | Counts | Sigma | Mean | Median | Sigma |
| A | 10 | 83 | 475369 | 3942.63 | 586 | 574 | 120.4 |
| A | 13 | 254 | 6694 | 50.82 | 586 | 574 | 120.4 |
| A | 3 | 137 | 6415 | 48.5 | 586 | 574 | 120.4 |
| B | 4 | 171 | 188108 | 1646.9 | 584 | 567 | 113.9 |
| B | 5 | 255 | 128810 | 1126.17 | 584 | 567 | 113.9 |
| B | 0 | 218 | 17625 | 149.8 | 584 | 567 | 113.9 |
| C | 15 | 214 | 219362 | 1623.48 | 576 | 580 | 134.8 |
| C | 0 | 10 | 100617 | 742.33 | 576 | 580 | 134.8 |
| C | 14 | 254 | 38063 | 278.14 | 576 | 580 | 134.8 |
| D | 5 | 32 | 360603 | 2602.56 | 563 | 548 | 138.3 |
| D | 13 | 249 | 312184 | 2252.58 | 563 | 548 | 138.3 |
| D | 2 | 249 | 163409 | 1177.2 | 563 | 548 | 138.3 |
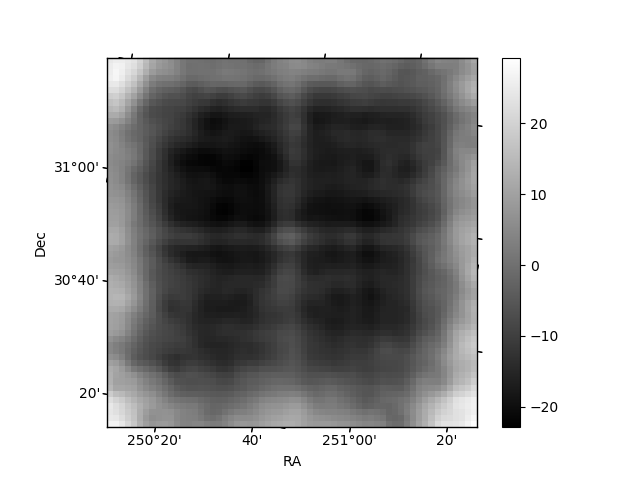
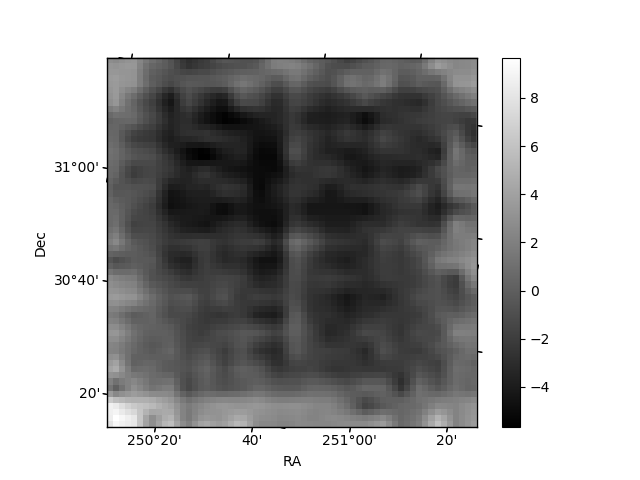
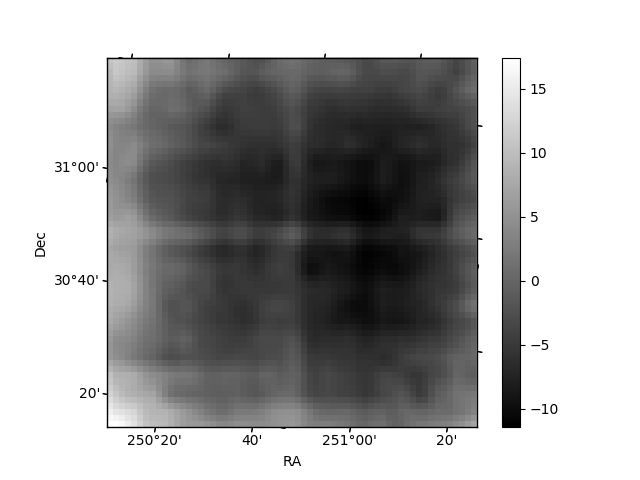
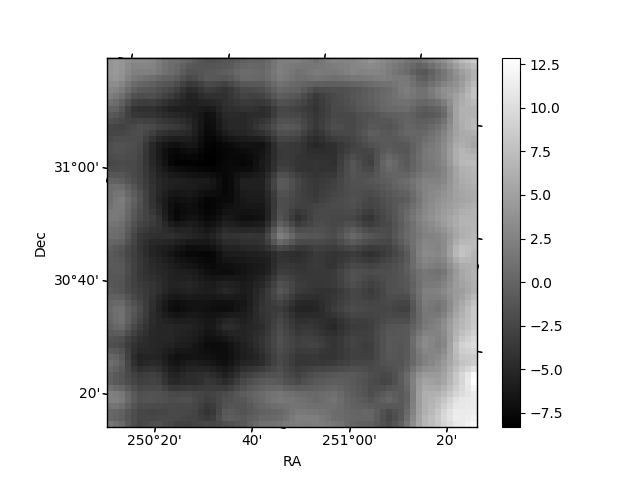
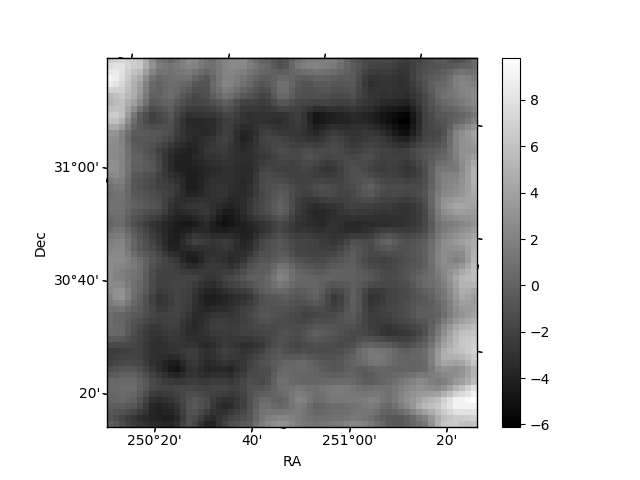
Histogram calculated using DETX and DETY for each event in the final _common_clean file
| Quadrant A | 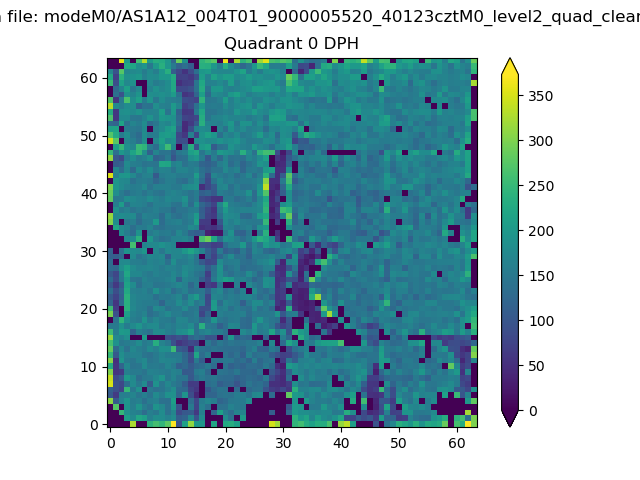 |
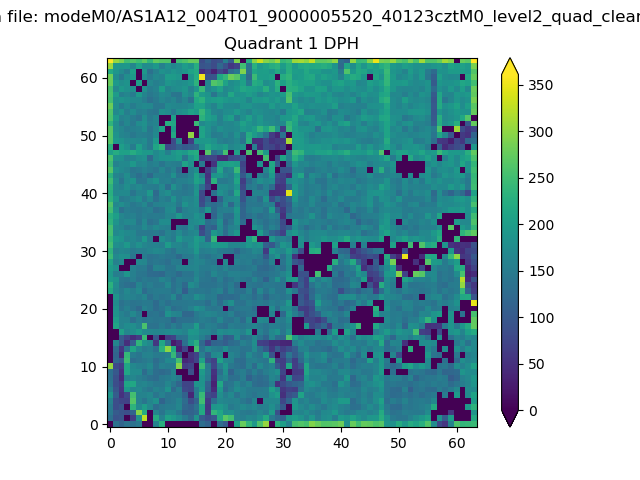 |
Quadrant B |
|---|---|---|---|
| Quadrant D | 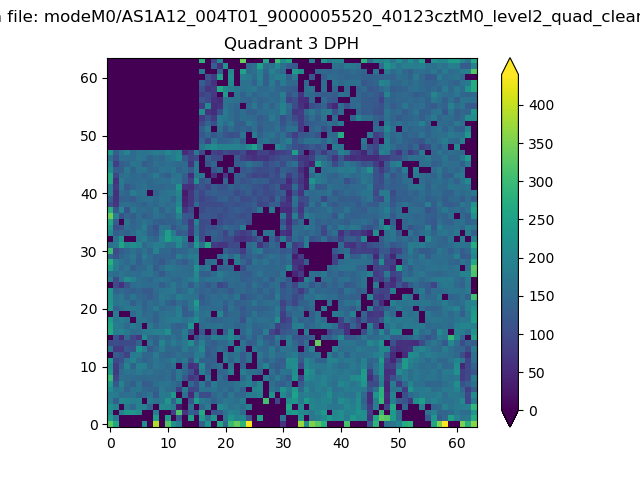 |
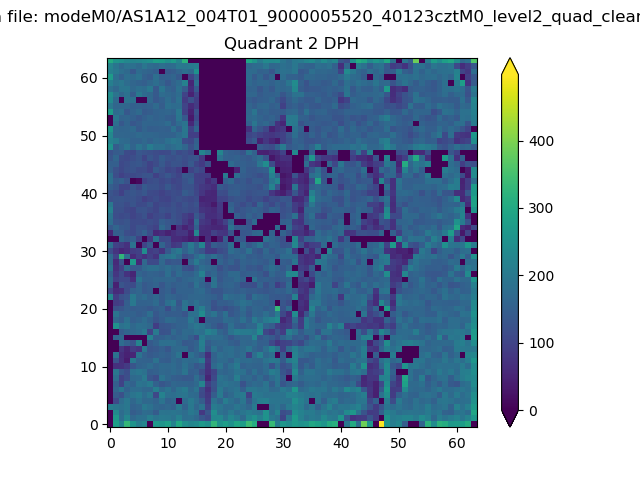 |
Quadrant C |
| Plot type | Count rate plots | Images |
|---|---|---|
| Comparison with Poisson distribution Blue bars denote a histogram of data divided into 1 sec bins. Red curve is a Poisson curve with rate = median count rate of data. |
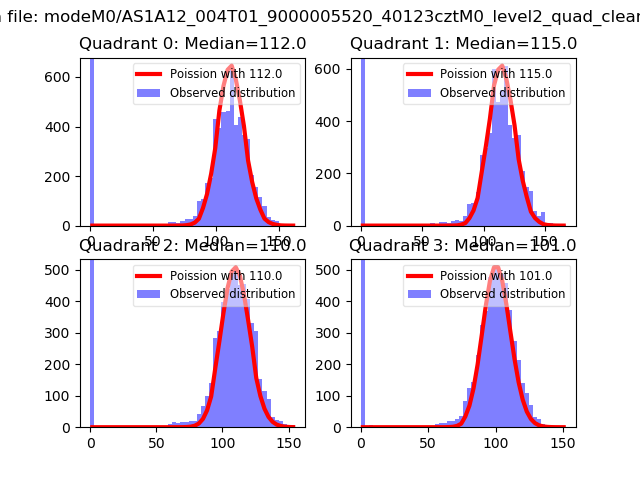 |
 |
| Quadrant-wise count rates Data is divided into 100 sec bins |
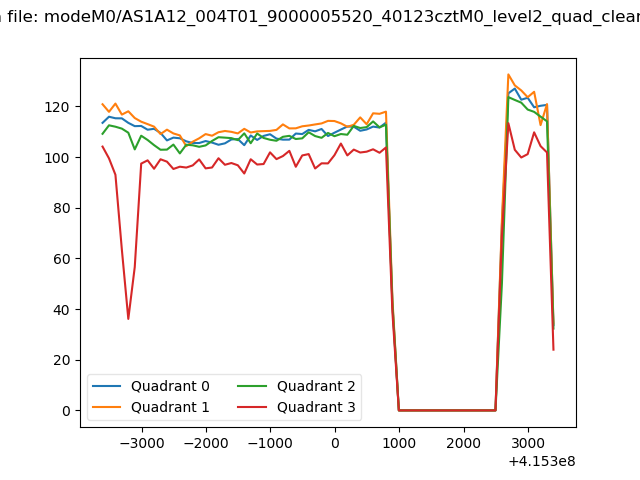 |
|
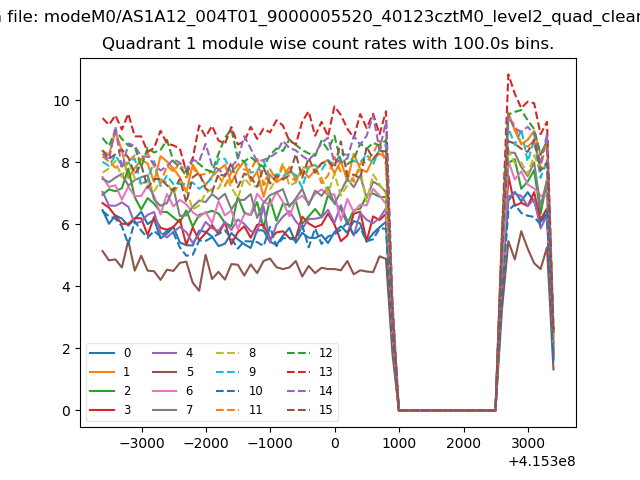
| Module-wise count rates for Quadrant A Data is divided into 100 sec bins |
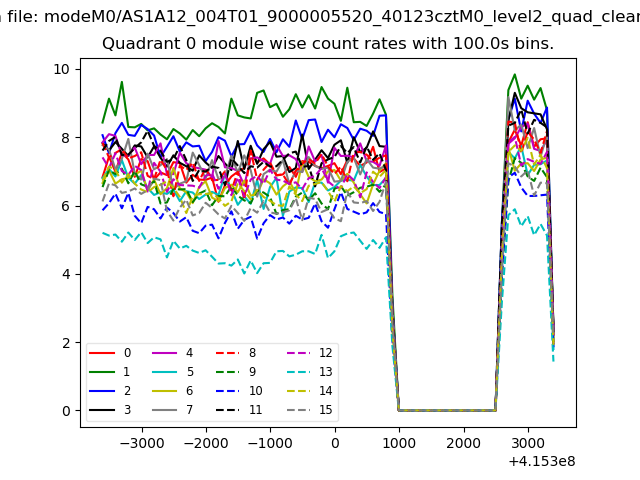 |
 |
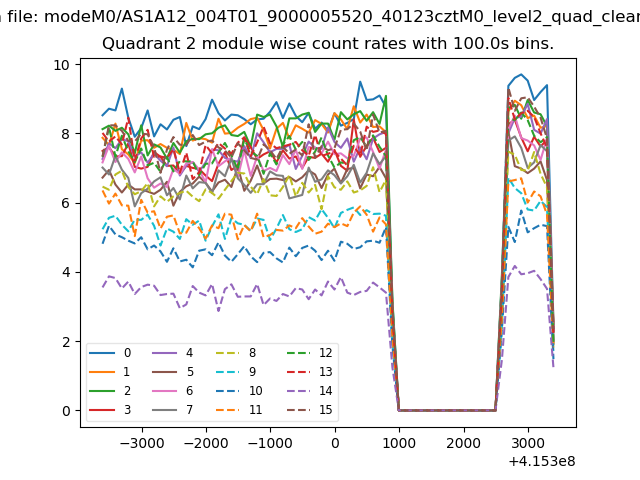
| Module-wise count rates for Quadrant B Data is divided into 100 sec bins |
 |
 |
| Module-wise count rates for Quadrant C Data is divided into 100 sec bins |
 |
 |
| Module-wise count rates for Quadrant D Data is divided into 100 sec bins |
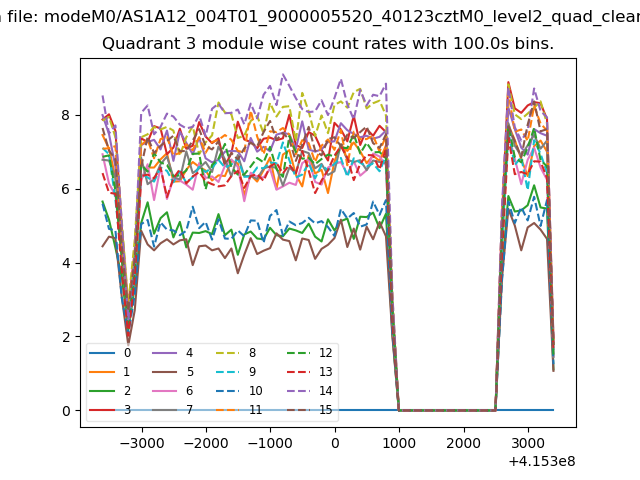 |
 |
| Parameter | Plot |
|---|---|
| CZT HV Monitor | 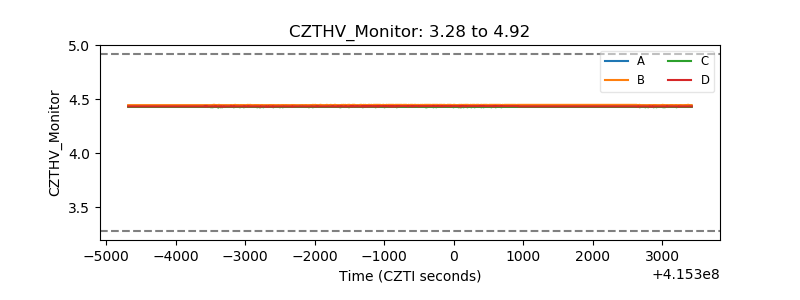 |
| D_VDD | 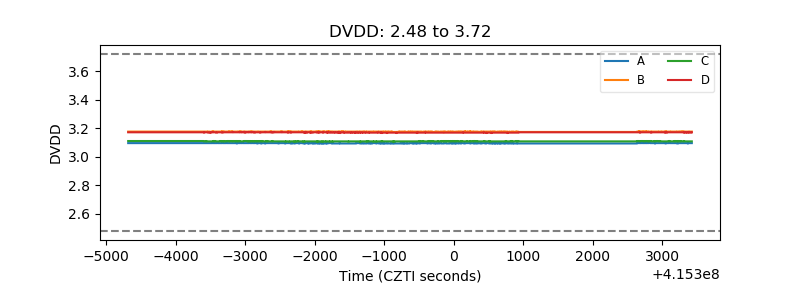 |
| Temperature 1 | 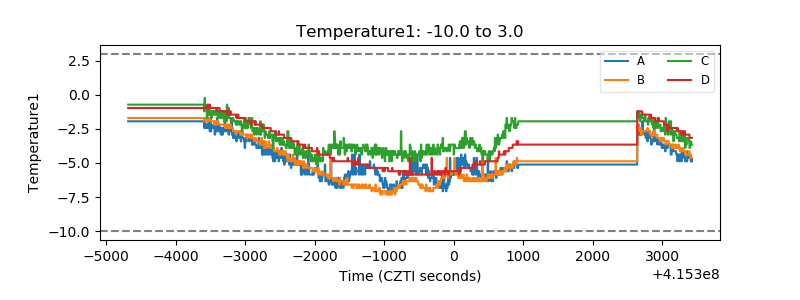 |
| Veto HV Monitor |  |
| Veto LLD | 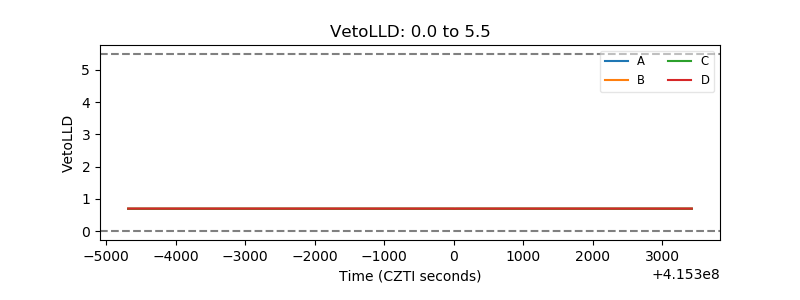 |
| Alpha Counter | 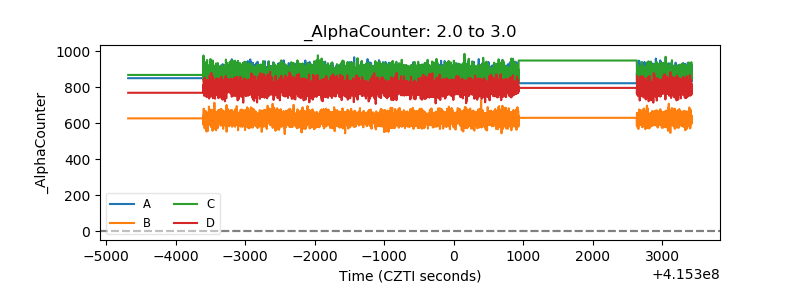 |
| _CPM_Rate | 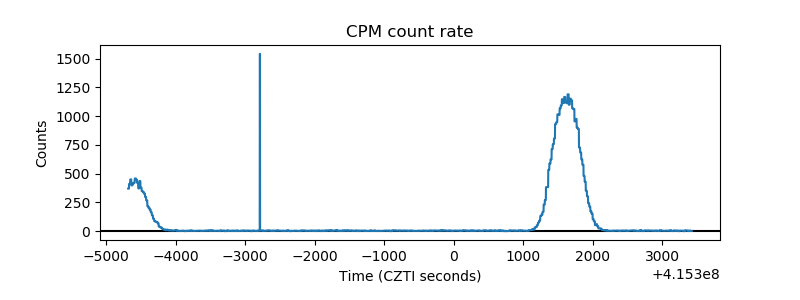 |
| CZT Counter | 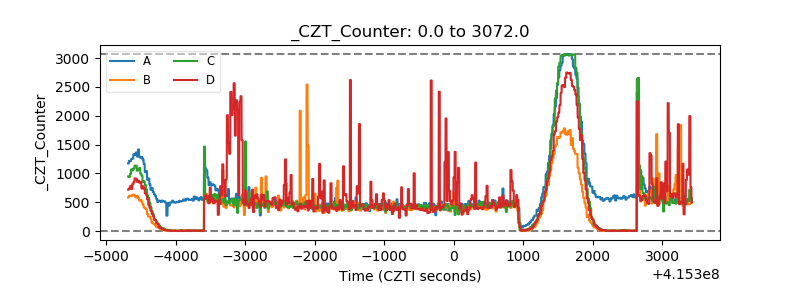 |
| +2.5 Volts monitor | 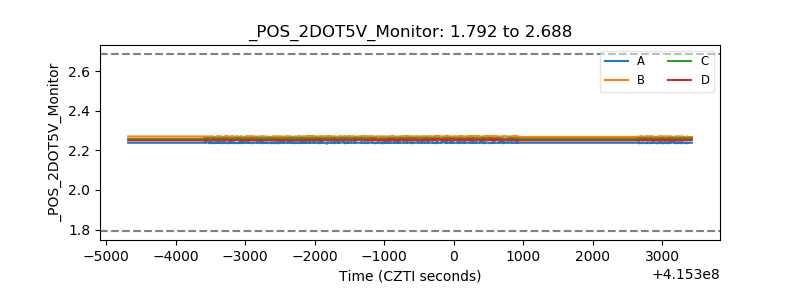 |
| +5 Volts monitor | 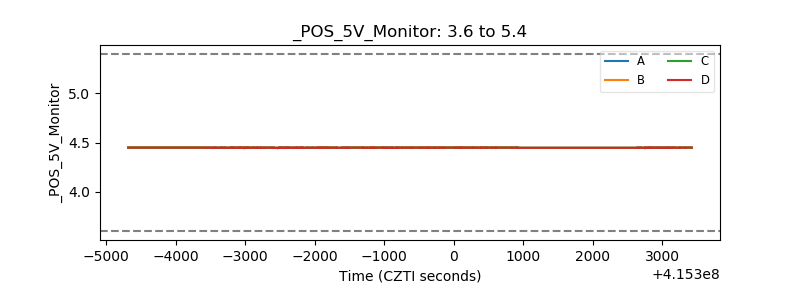 |
| _ROLL_ROT | 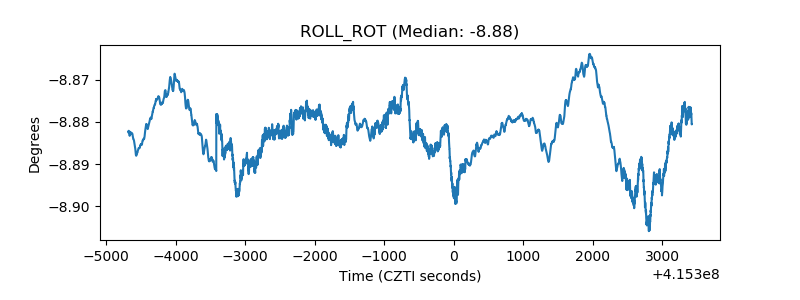 |
| _Roll_DEC | 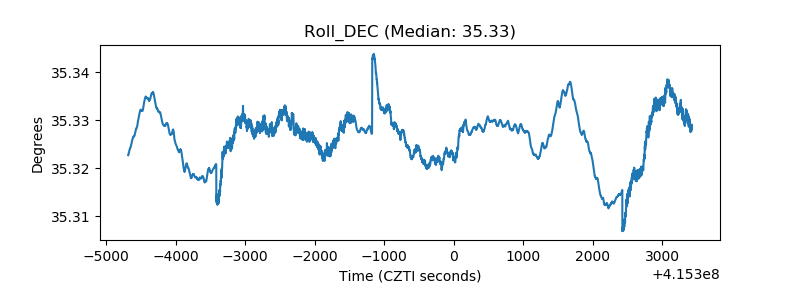 |
| _Roll_RA | 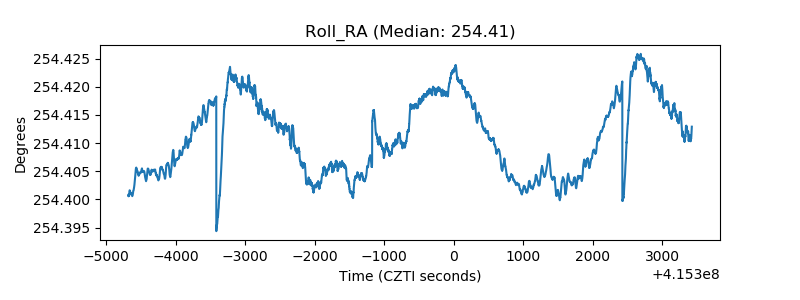 |
| Veto Counter | 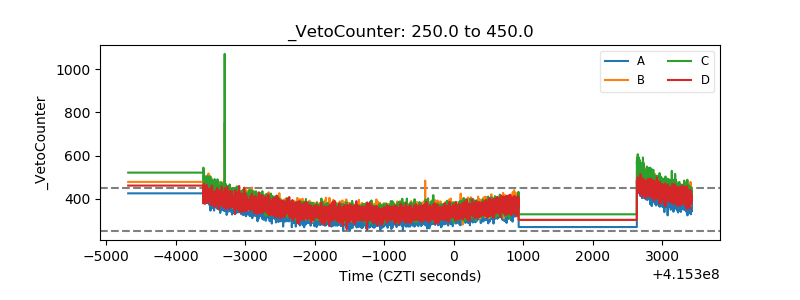 |