| Param | Original file | Final file |
|---|---|---|
| Filename | modeM0/AS1A12_004T01_9000005520_40125cztM0_level2.fits | modeM0/AS1A12_004T01_9000005520_40125cztM0_level2_quad_clean.evt |
| Size (bytes) | 360,241,920 | 89,092,800 |
| Size | 343.6 MB | 85.0 MB |
| Events in quadrant A | 2,716,407 | 603,325 |
| Events in quadrant B | 2,627,211 | 620,815 |
| Events in quadrant C | 4,575,442 | 569,557 |
| Events in quadrant D | 3,013,738 | 541,916 |
| Mode M0 | |||
|---|---|---|---|
| Quadrant | BADHDUFLAG | Total packets | Discarded packets |
| A | 0 | 11421 | 3 |
| B | 0 | 11385 | 2 |
| C | 0 | 16934 | 2 |
| D | 0 | 12696 | 2 |
| Mode M9 | |||
|---|---|---|---|
| Quadrant | BADHDUFLAG | Total packets | Discarded packets |
| A | 0 | 29 | 0 |
| B | 0 | 29 | 0 |
| C | 0 | 29 | 0 |
| D | 0 | 30 | 0 |
| Mode SS | |||
|---|---|---|---|
| Quadrant | BADHDUFLAG | Total packets | Discarded packets |
| A | 0 | 106 | 0 |
| B | 0 | 106 | 0 |
| C | 0 | 106 | 0 |
| D | 0 | 106 | 0 |
| Quadrant | Total seconds | Saturated seconds | Saturation percentage |
|---|---|---|---|
| A | 5166 | 13 | 0.251645% |
| B | 5166 | 59 | 1.142083% |
| C | 5166 | 382 | 7.394503% |
| D | 5166 | 135 | 2.613240% |
Noise dominated data is calculated using 1-second bins in cleaned event files. If a bin has >2000 counts, and if more than 50% of those come from <1% of pixels, then it is considered to be noise-dominated and hence unusable.
| Quadrant | # 1 sec bins | Bins with >0 counts | Bins with >2000 counts | High rate bins dominated by noise | Noise dominated (total time) | Noise dominated (detector-on time) | Marked lightcurve |
|---|---|---|---|---|---|---|---|
| A | 7018 | 5167 | 6 | 6 | 0.09% | 0.12% | 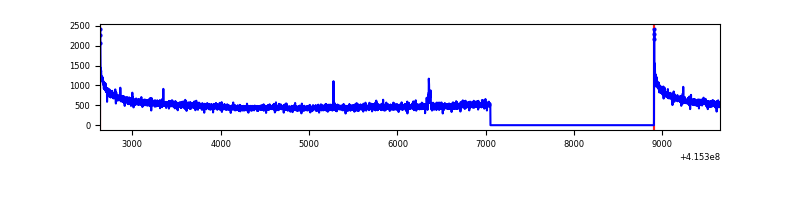 |
| B | 7018 | 5167 | 28 | 28 | 0.40% | 0.54% | 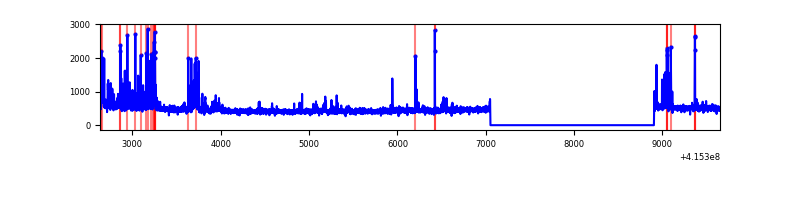 |
| C | 7018 | 5167 | 420 | 420 | 5.98% | 8.13% | 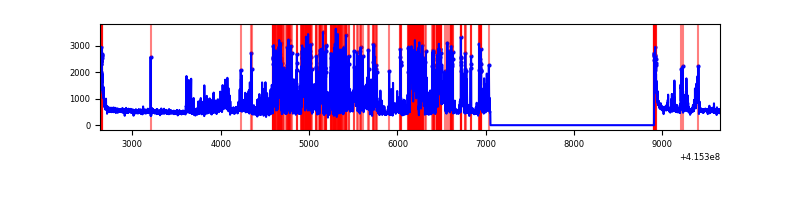 |
| D | 7018 | 5167 | 110 | 110 | 1.57% | 2.13% | 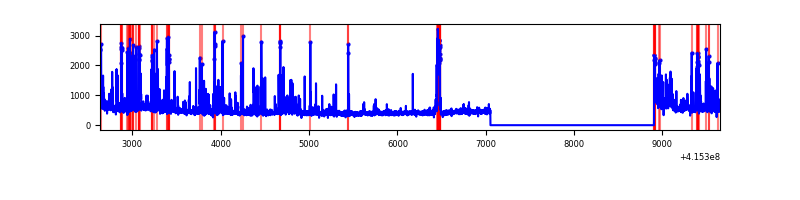 |
Top three noisy pixels from each quadrant. If the there are fewer than three noisy pixels in the level2.evt file, extra rows are filled as -1
| Pixel properties | Quadrant properties | ||||||
|---|---|---|---|---|---|---|---|
| Quadrant | DetID | PixID | Counts | Sigma | Mean | Median | Sigma |
| A | 10 | 83 | 457755 | 3860.57 | 578 | 566 | 118.4 |
| A | 6 | 10 | 14172 | 114.89 | 578 | 566 | 118.4 |
| A | 3 | 137 | 6364 | 48.96 | 578 | 566 | 118.4 |
| B | 4 | 171 | 180899 | 1625.01 | 578 | 563 | 111.0 |
| B | 5 | 255 | 126201 | 1132.13 | 578 | 563 | 111.0 |
| B | 12 | 111 | 13854 | 119.77 | 578 | 563 | 111.0 |
| C | 9 | 187 | 2028345 | 15471.76 | 561 | 564 | 131.1 |
| C | 15 | 214 | 212211 | 1614.85 | 561 | 564 | 131.1 |
| C | 0 | 10 | 120569 | 915.63 | 561 | 564 | 131.1 |
| D | 13 | 249 | 249437 | 1834.18 | 564 | 550 | 135.7 |
| D | 2 | 249 | 147436 | 1082.48 | 564 | 550 | 135.7 |
| D | 9 | 19 | 142525 | 1046.29 | 564 | 550 | 135.7 |
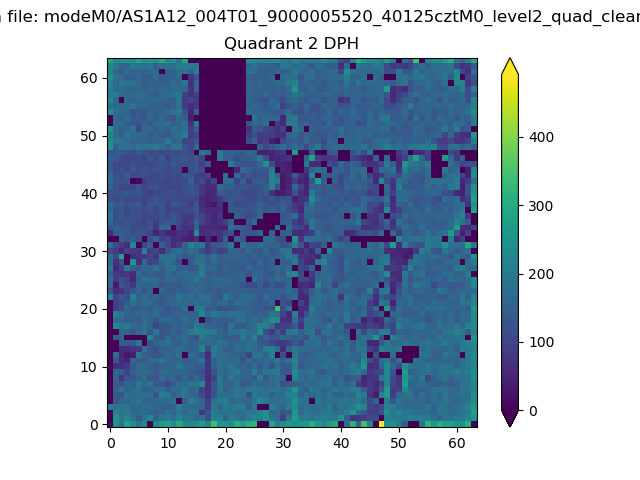
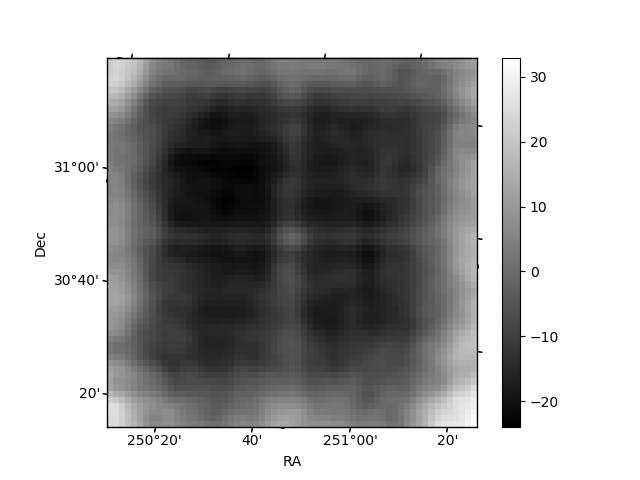
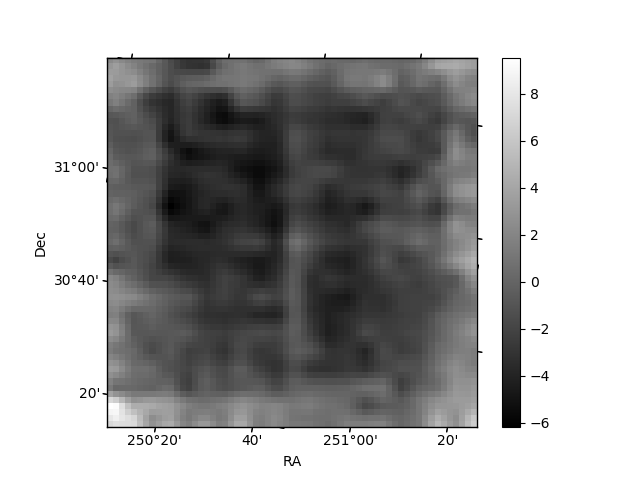
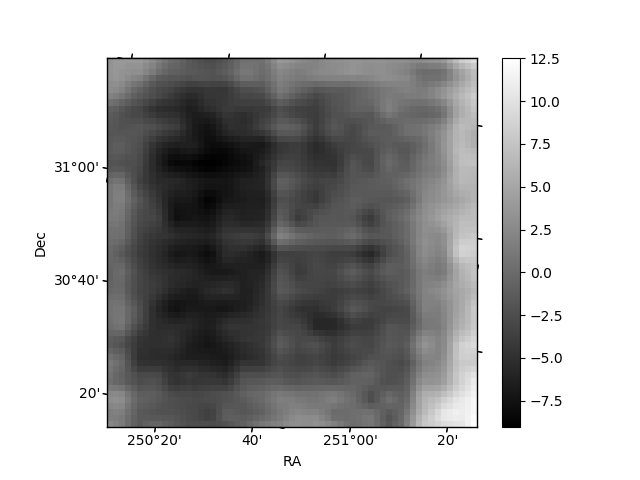
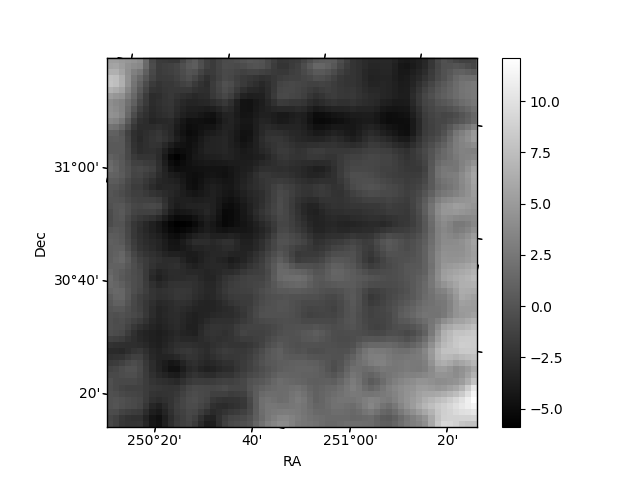
Histogram calculated using DETX and DETY for each event in the final _common_clean file
| Quadrant A | 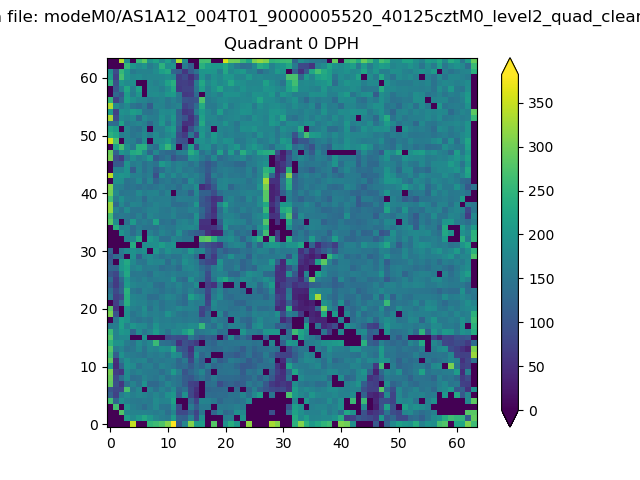 |
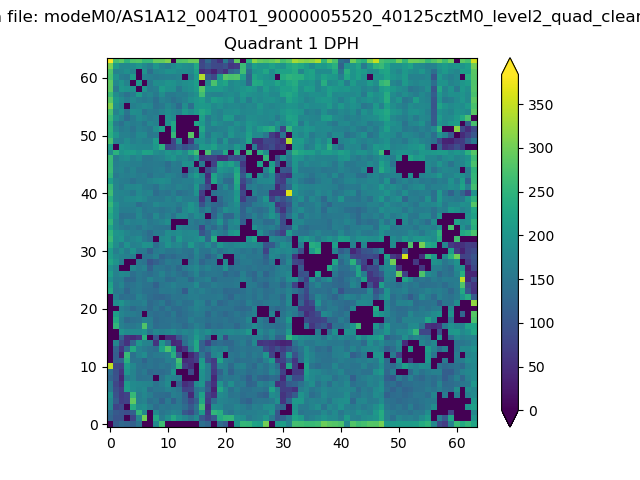 |
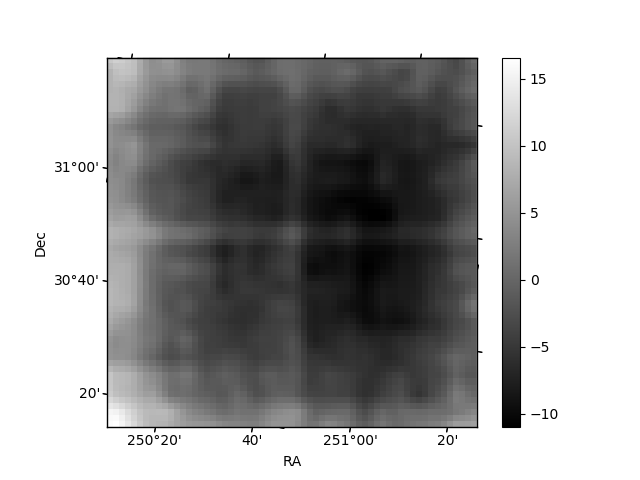
Quadrant B |
|---|---|---|---|
| Quadrant D | 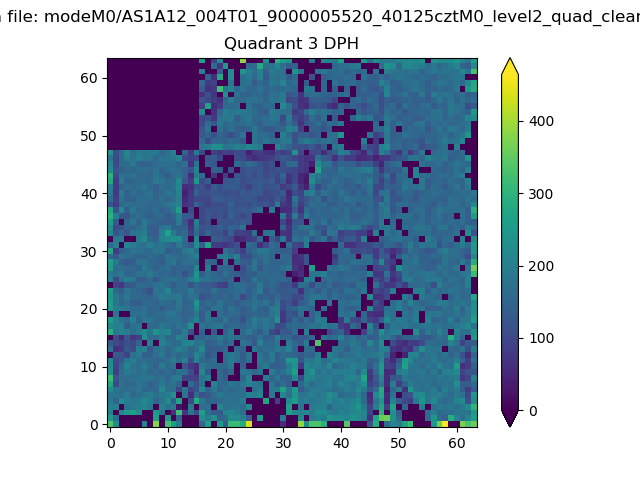 |
 |
Quadrant C |
| Plot type | Count rate plots | Images |
|---|---|---|
| Comparison with Poisson distribution Blue bars denote a histogram of data divided into 1 sec bins. Red curve is a Poisson curve with rate = median count rate of data. |
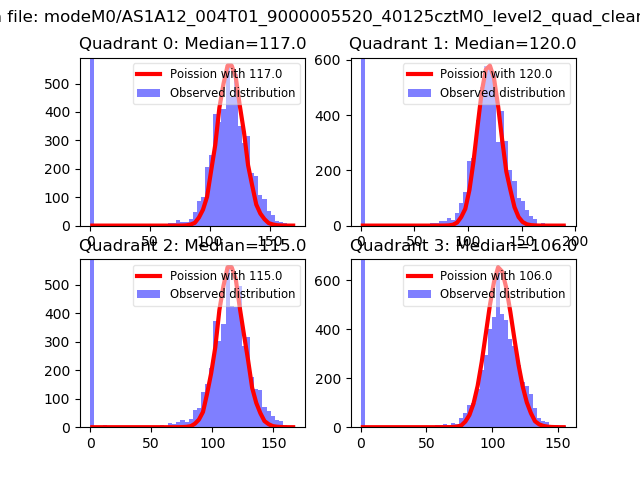 |
 |
| Quadrant-wise count rates Data is divided into 100 sec bins |
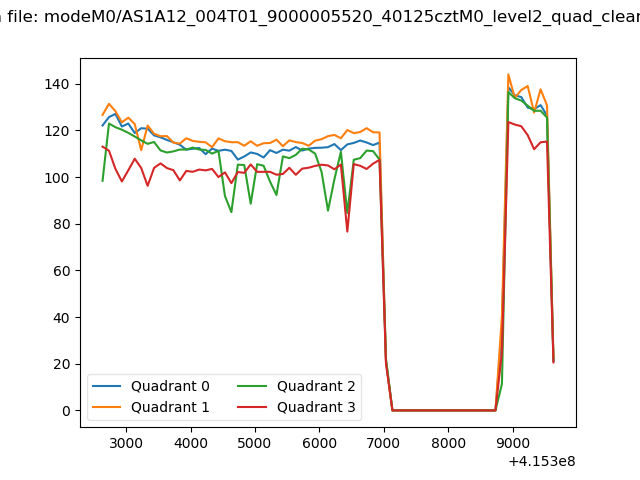 |
|
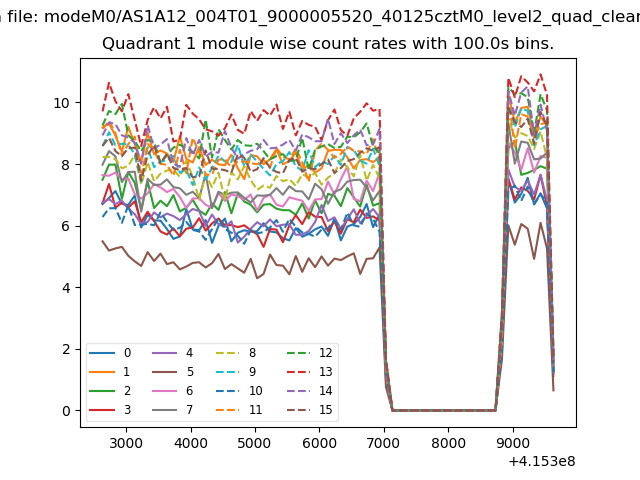
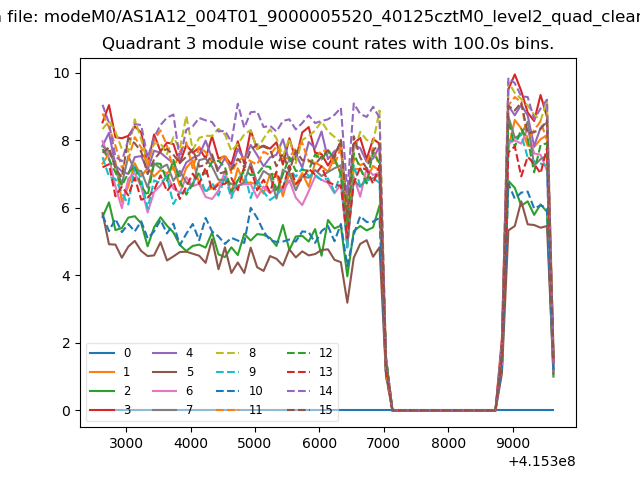
| Module-wise count rates for Quadrant A Data is divided into 100 sec bins |
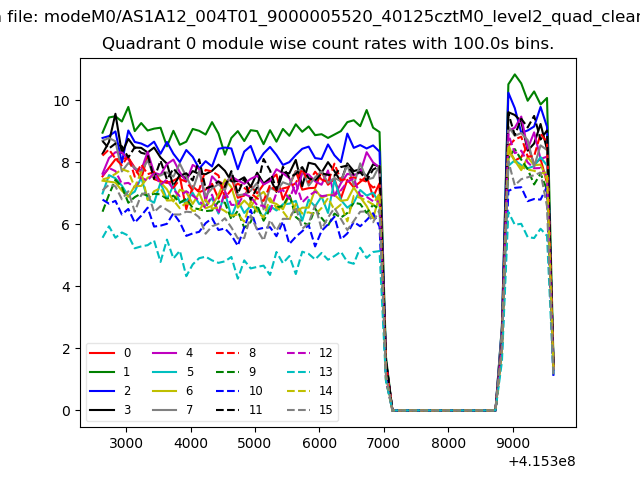 |
 |
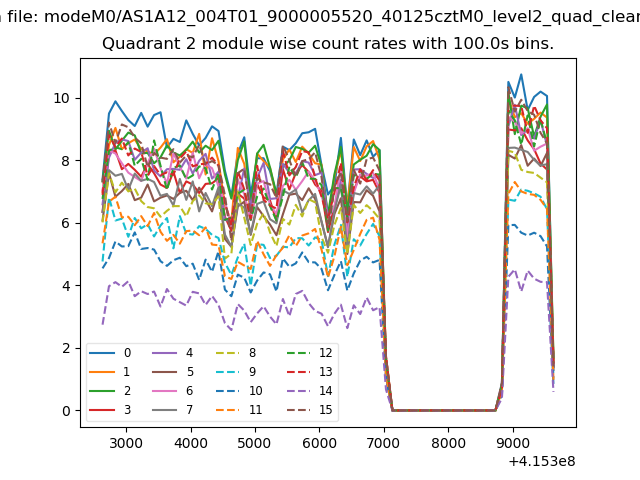
| Module-wise count rates for Quadrant B Data is divided into 100 sec bins |
 |
 |
| Module-wise count rates for Quadrant C Data is divided into 100 sec bins |
 |
 |
| Module-wise count rates for Quadrant D Data is divided into 100 sec bins |
 |
 |
| Parameter | Plot |
|---|---|
| CZT HV Monitor |  |
| D_VDD | 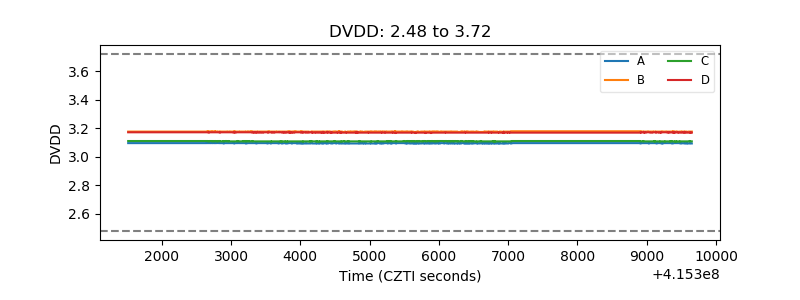 |
| Temperature 1 | 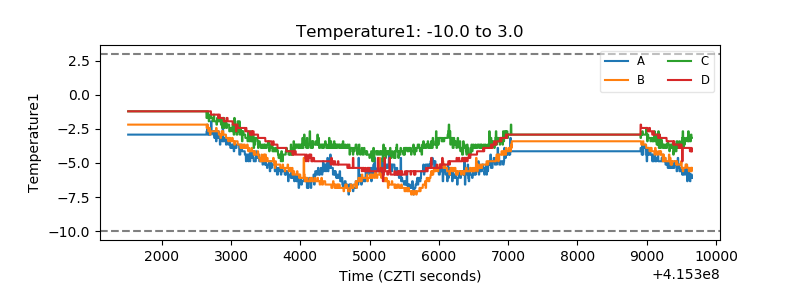 |
| Veto HV Monitor | 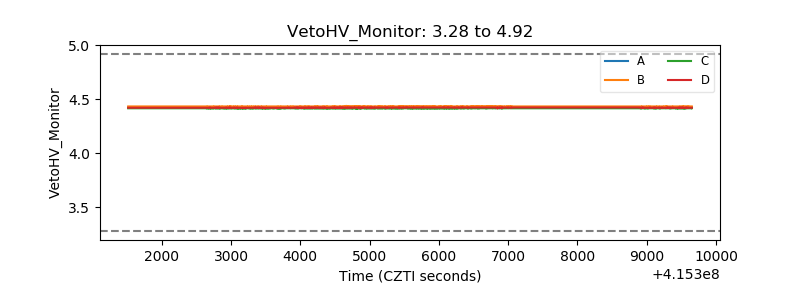 |
| Veto LLD | 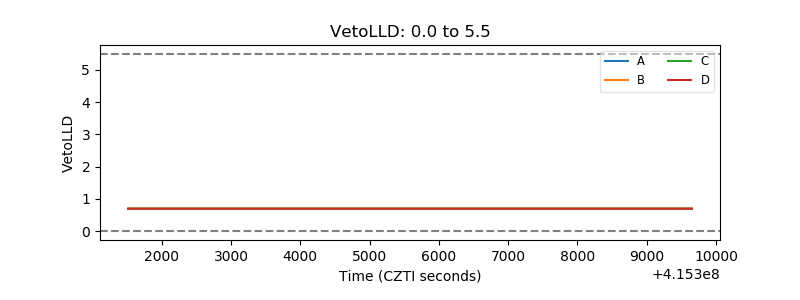 |
| Alpha Counter | 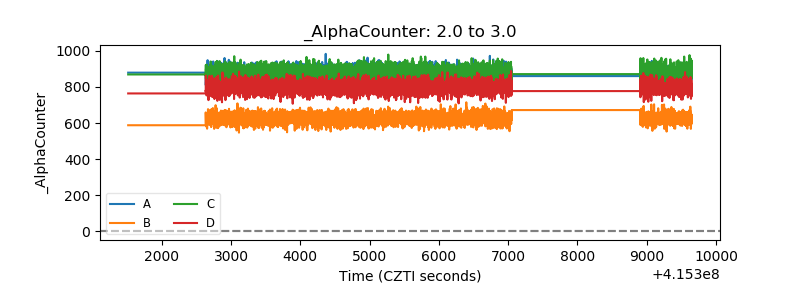 |
| _CPM_Rate | 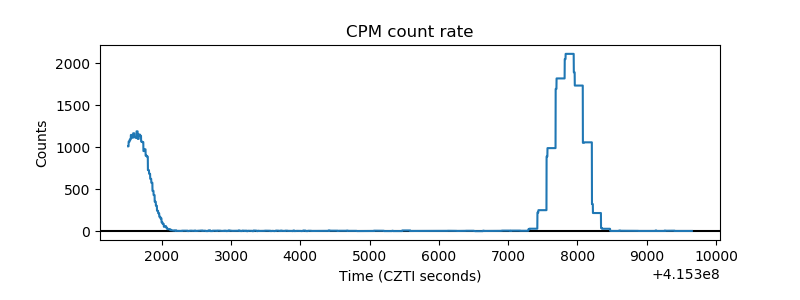 |
| CZT Counter | 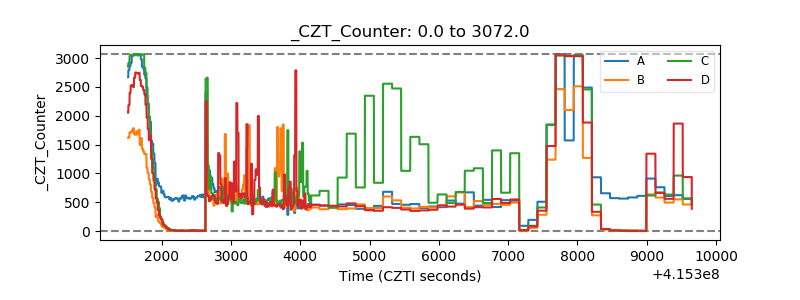 |
| +2.5 Volts monitor | 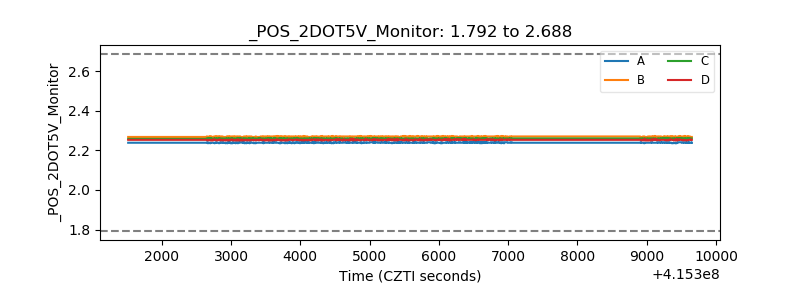 |
| +5 Volts monitor | 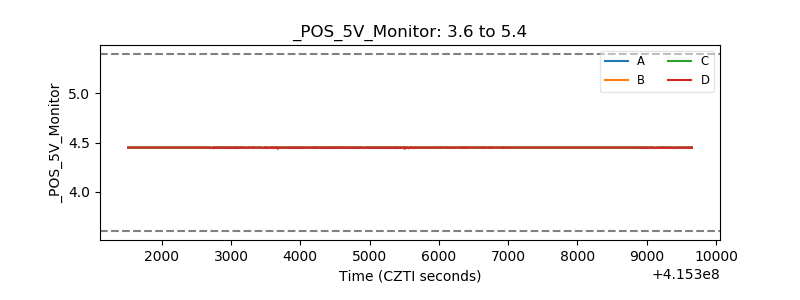 |
| _ROLL_ROT | 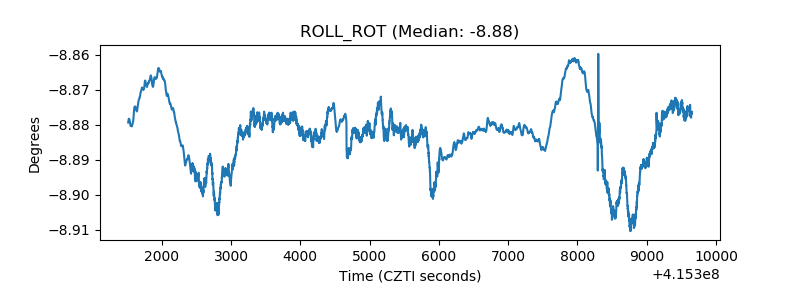 |
| _Roll_DEC | 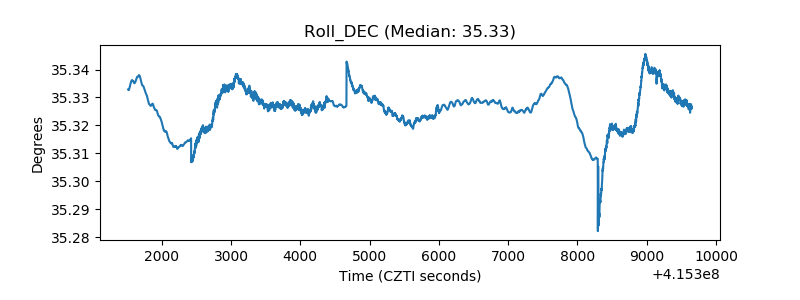 |
| _Roll_RA | 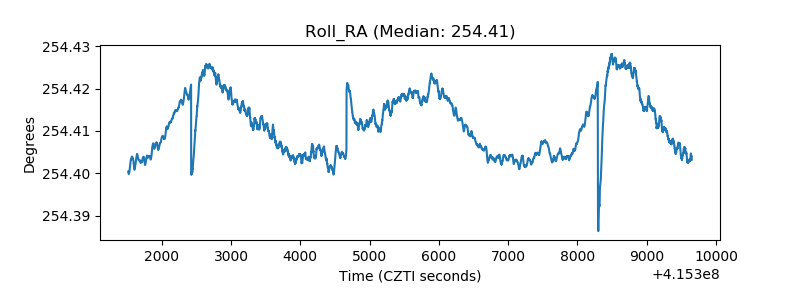 |
| Veto Counter | 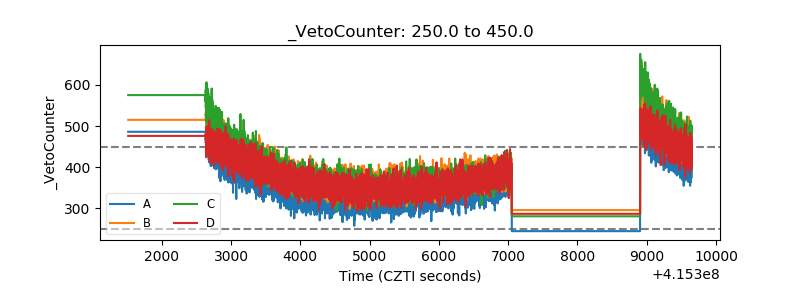 |