| Param | Original file | Final file |
|---|---|---|
| Filename | modeM0/AS1A12_004T01_9000005520_40126cztM0_level2.fits | modeM0/AS1A12_004T01_9000005520_40126cztM0_level2_quad_clean.evt |
| Size (bytes) | 450,944,640 | 87,733,440 |
| Size | 430.1 MB | 83.7 MB |
| Events in quadrant A | 2,791,003 | 621,531 |
| Events in quadrant B | 2,513,663 | 645,317 |
| Events in quadrant C | 6,794,722 | 495,358 |
| Events in quadrant D | 4,196,282 | 536,750 |
| Mode M0 | |||
|---|---|---|---|
| Quadrant | BADHDUFLAG | Total packets | Discarded packets |
| A | 0 | 11434 | 3 |
| B | 0 | 10863 | 2 |
| C | 0 | 23658 | 2 |
| D | 0 | 16001 | 2 |
| Mode M9 | |||
|---|---|---|---|
| Quadrant | BADHDUFLAG | Total packets | Discarded packets |
| A | 0 | 31 | 0 |
| B | 0 | 31 | 0 |
| C | 0 | 31 | 0 |
| D | 0 | 32 | 0 |
| Mode SS | |||
|---|---|---|---|
| Quadrant | BADHDUFLAG | Total packets | Discarded packets |
| A | 0 | 104 | 0 |
| B | 0 | 104 | 0 |
| C | 0 | 104 | 0 |
| D | 0 | 104 | 0 |
| Quadrant | Total seconds | Saturated seconds | Saturation percentage |
|---|---|---|---|
| A | 5104 | 16 | 0.313480% |
| B | 5104 | 33 | 0.646552% |
| C | 5104 | 1298 | 25.431034% |
| D | 5104 | 407 | 7.974138% |
Noise dominated data is calculated using 1-second bins in cleaned event files. If a bin has >2000 counts, and if more than 50% of those come from <1% of pixels, then it is considered to be noise-dominated and hence unusable.
| Quadrant | # 1 sec bins | Bins with >0 counts | Bins with >2000 counts | High rate bins dominated by noise | Noise dominated (total time) | Noise dominated (detector-on time) | Marked lightcurve |
|---|---|---|---|---|---|---|---|
| A | 7077 | 5105 | 7 | 7 | 0.10% | 0.14% | 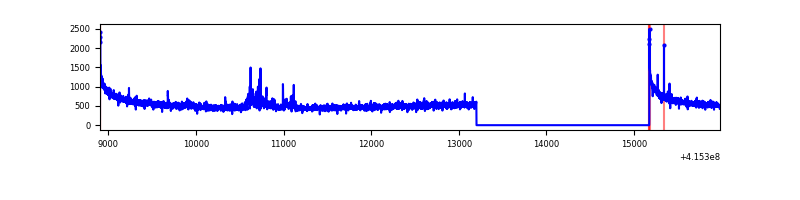 |
| B | 7077 | 5105 | 13 | 13 | 0.18% | 0.25% | 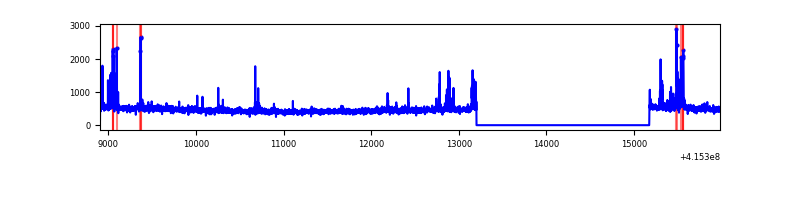 |
| C | 7077 | 5105 | 1293 | 1293 | 18.27% | 25.33% | 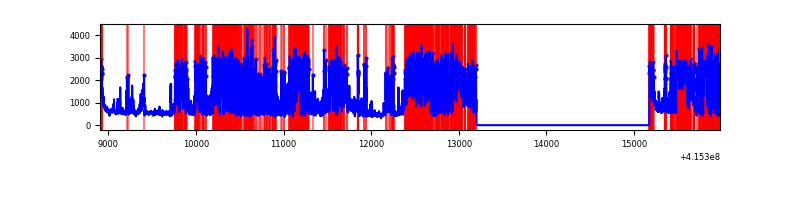 |
| D | 7077 | 5105 | 431 | 431 | 6.09% | 8.44% | 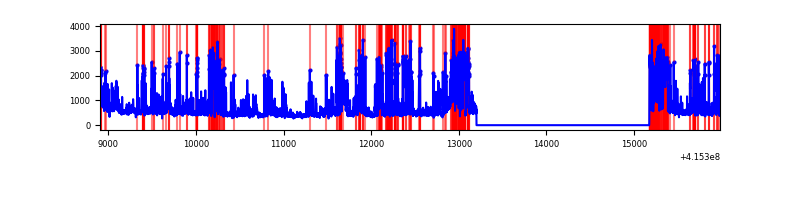 |
Top three noisy pixels from each quadrant. If the there are fewer than three noisy pixels in the level2.evt file, extra rows are filled as -1
| Pixel properties | Quadrant properties | ||||||
|---|---|---|---|---|---|---|---|
| Quadrant | DetID | PixID | Counts | Sigma | Mean | Median | Sigma |
| A | 10 | 83 | 445283 | 3721.23 | 582 | 573 | 119.5 |
| A | 6 | 10 | 78233 | 649.84 | 582 | 573 | 119.5 |
| A | 12 | 189 | 12014 | 95.74 | 582 | 573 | 119.5 |
| B | 4 | 171 | 140684 | 1245.52 | 585 | 572 | 112.5 |
| B | 5 | 255 | 54284 | 477.47 | 585 | 572 | 112.5 |
| B | 12 | 111 | 13888 | 118.37 | 585 | 572 | 112.5 |
| C | 9 | 187 | 4397955 | 35876.91 | 522 | 527 | 122.6 |
| C | 15 | 214 | 193062 | 1570.82 | 522 | 527 | 122.6 |
| C | 0 | 10 | 90969 | 737.88 | 522 | 527 | 122.6 |
| D | 12 | 227 | 1473799 | 10695.18 | 558 | 545 | 137.7 |
| D | 2 | 249 | 175479 | 1269.94 | 558 | 545 | 137.7 |
| D | 13 | 249 | 100428 | 725.11 | 558 | 545 | 137.7 |
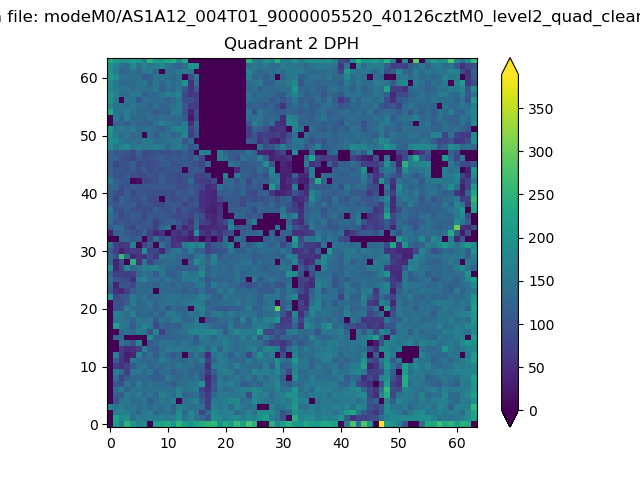
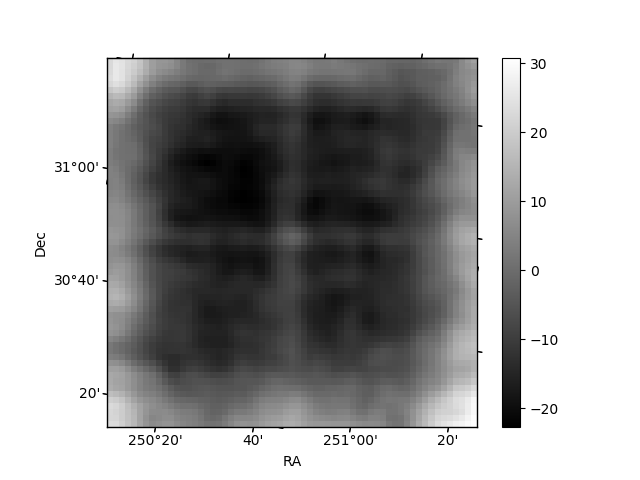
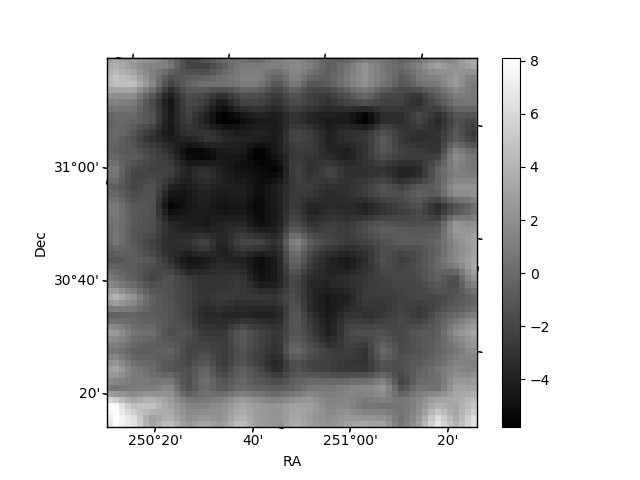
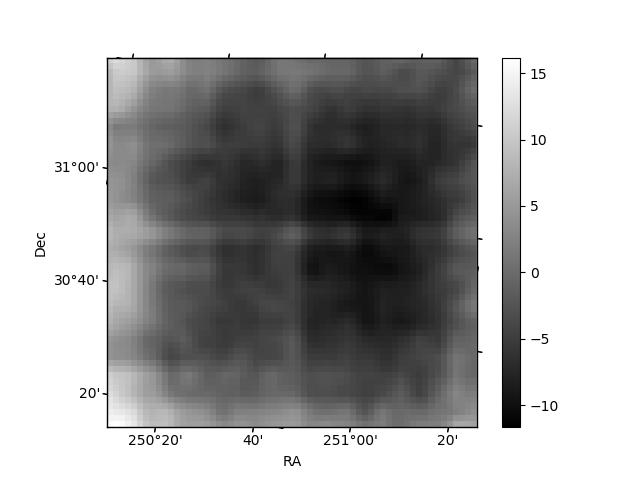
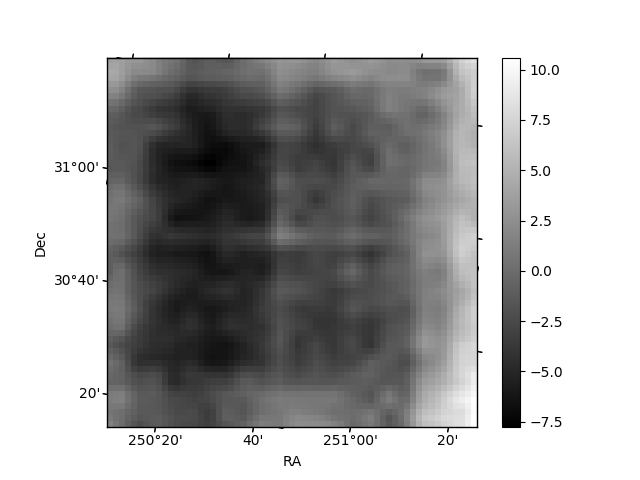
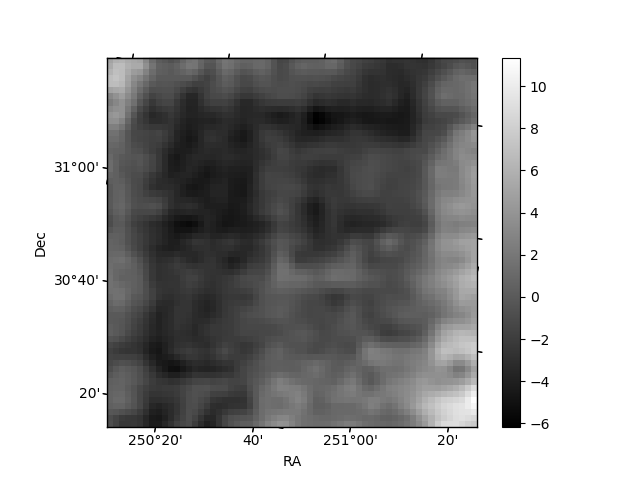
Histogram calculated using DETX and DETY for each event in the final _common_clean file
| Quadrant A | 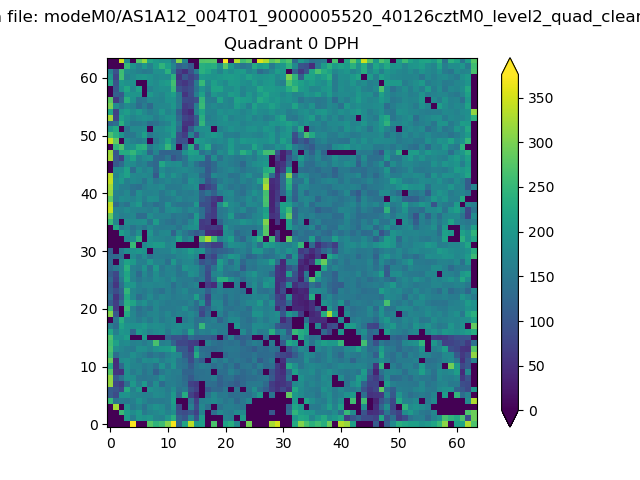 |
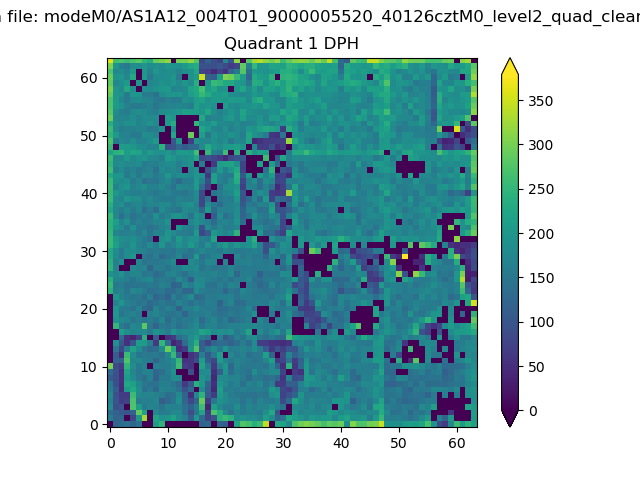 |
Quadrant B |
|---|---|---|---|
| Quadrant D | 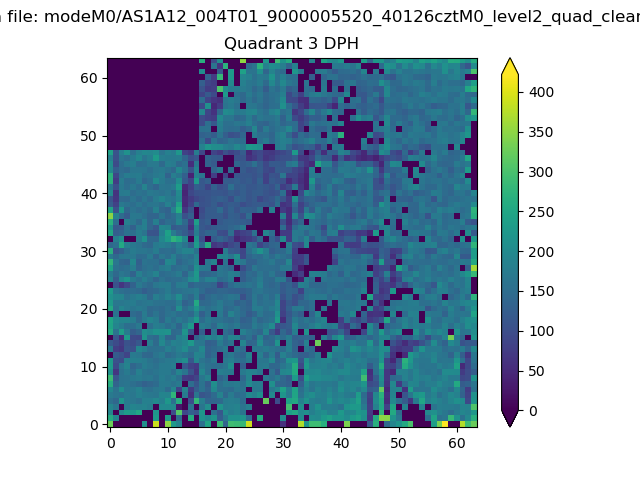 |
 |
Quadrant C |
| Plot type | Count rate plots | Images |
|---|---|---|
| Comparison with Poisson distribution Blue bars denote a histogram of data divided into 1 sec bins. Red curve is a Poisson curve with rate = median count rate of data. |
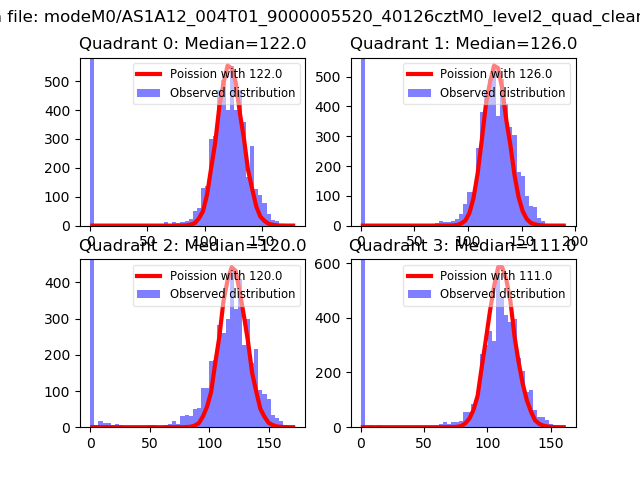 |
 |
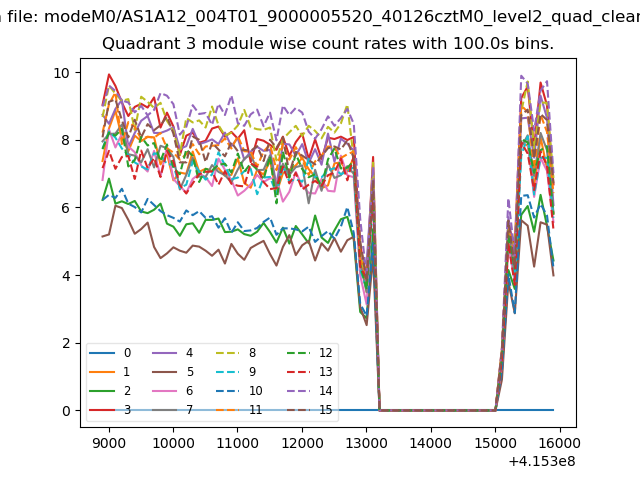
| Quadrant-wise count rates Data is divided into 100 sec bins |
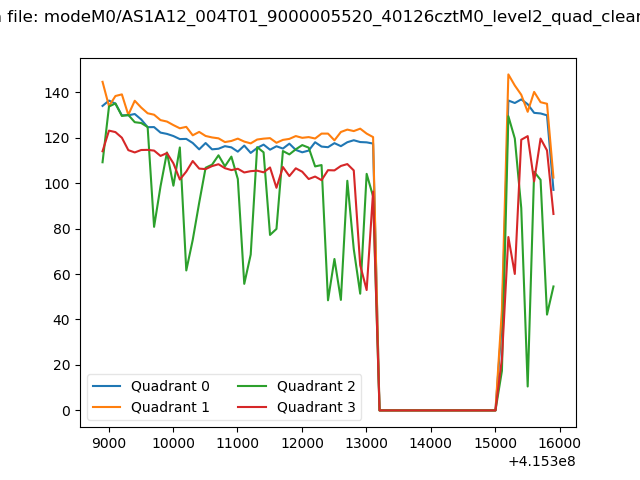 |
|
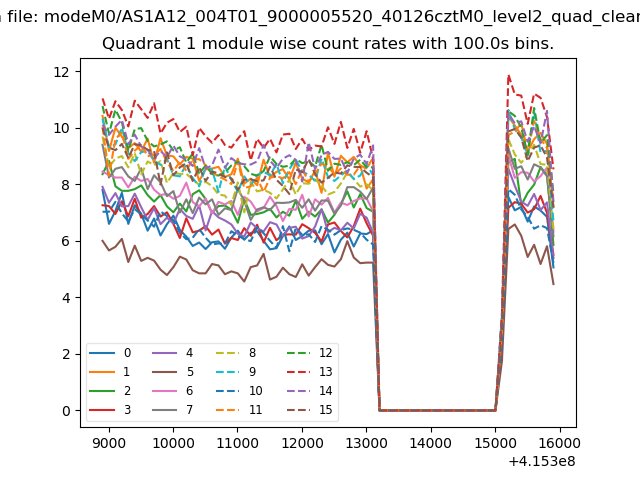
| Module-wise count rates for Quadrant A Data is divided into 100 sec bins |
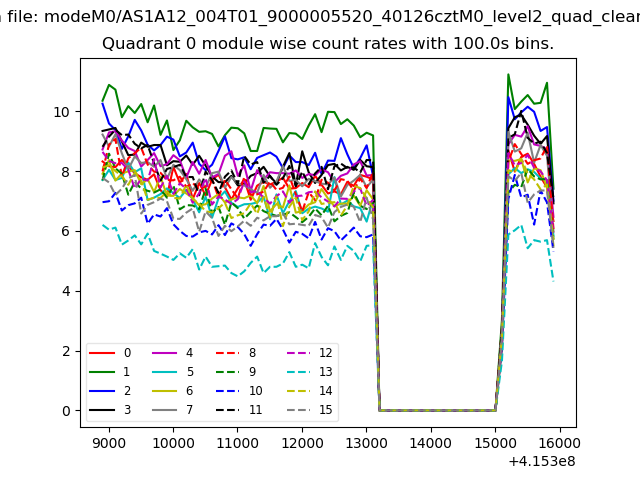 |
 |
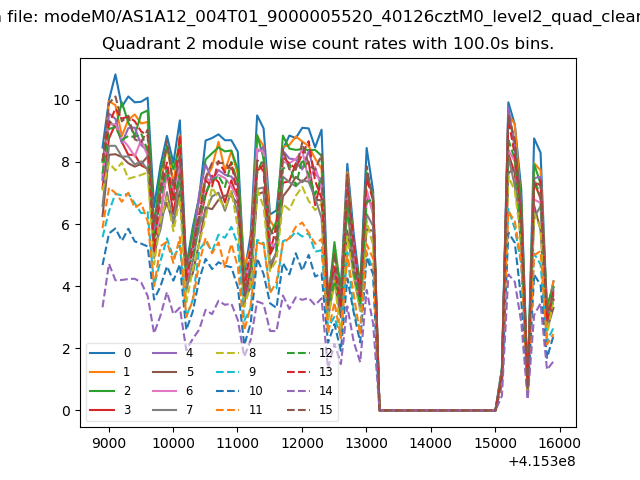
| Module-wise count rates for Quadrant B Data is divided into 100 sec bins |
 |
 |
| Module-wise count rates for Quadrant C Data is divided into 100 sec bins |
 |
 |
| Module-wise count rates for Quadrant D Data is divided into 100 sec bins |
 |
 |
| Parameter | Plot |
|---|---|
| CZT HV Monitor | 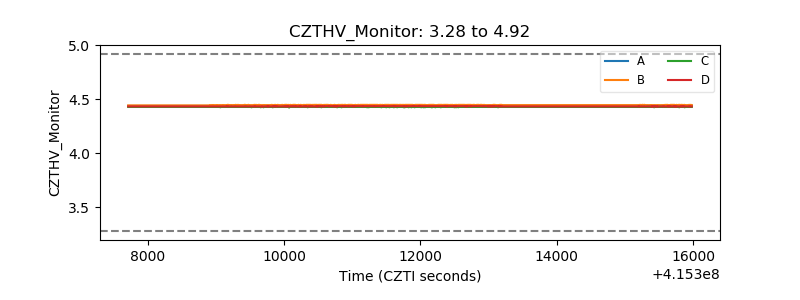 |
| D_VDD | 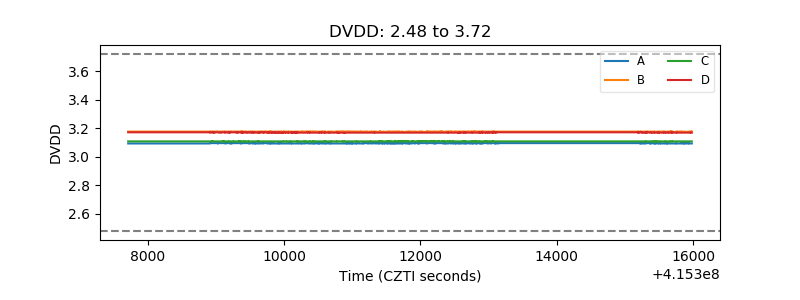 |
| Temperature 1 | 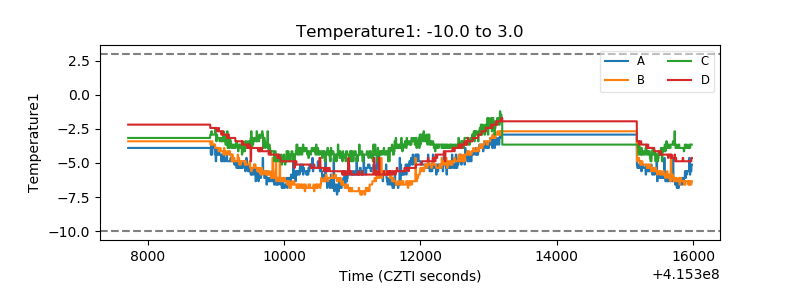 |
| Veto HV Monitor |  |
| Veto LLD | 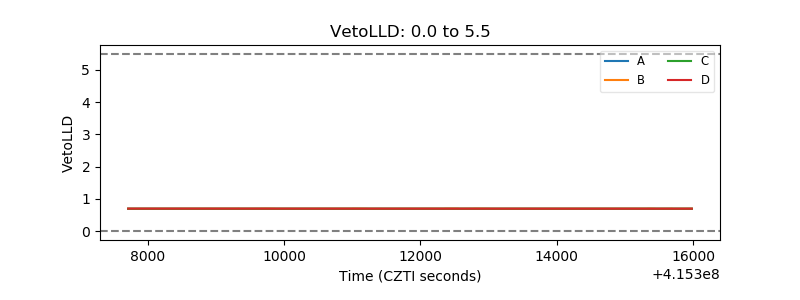 |
| Alpha Counter |  |
| _CPM_Rate | 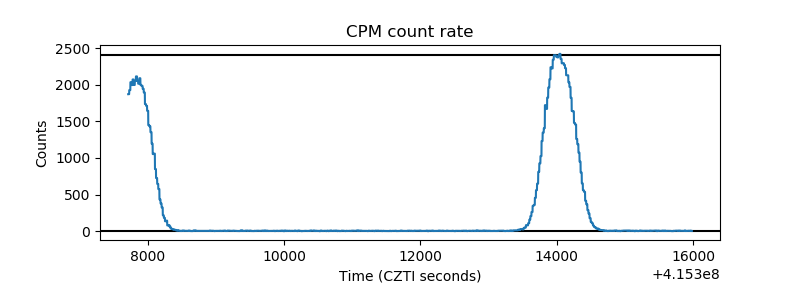 |
| CZT Counter | 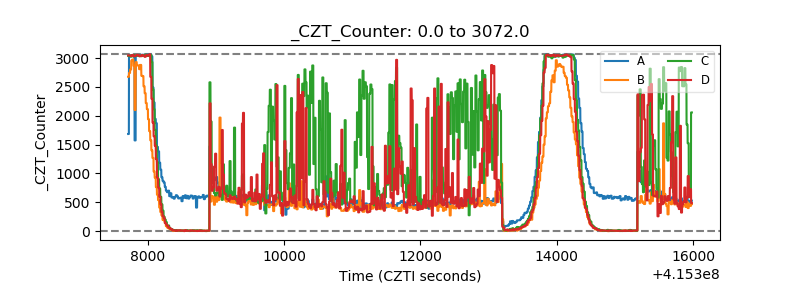 |
| +2.5 Volts monitor | 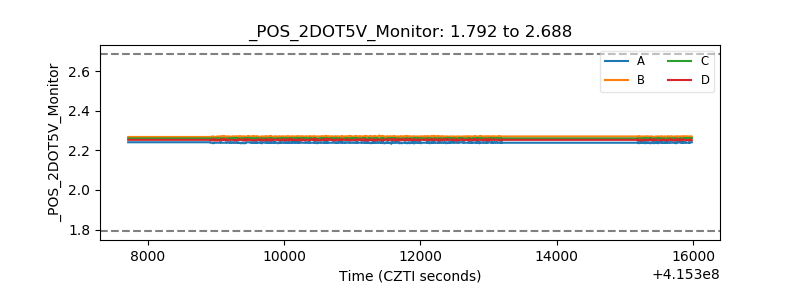 |
| +5 Volts monitor |  |
| _ROLL_ROT | 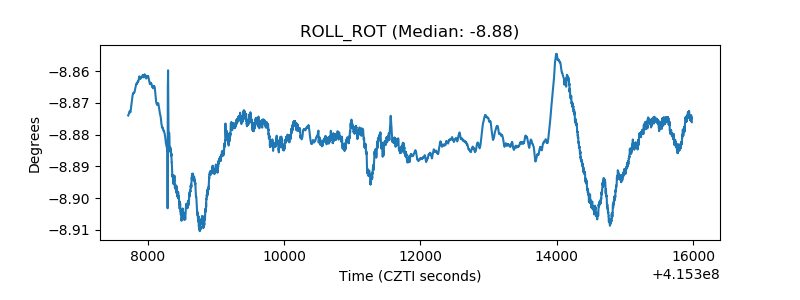 |
| _Roll_DEC | 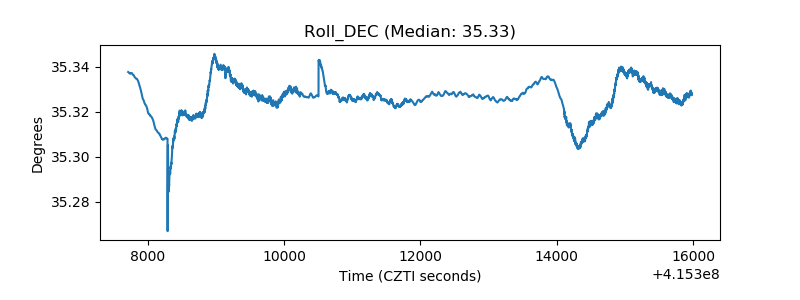 |
| _Roll_RA | 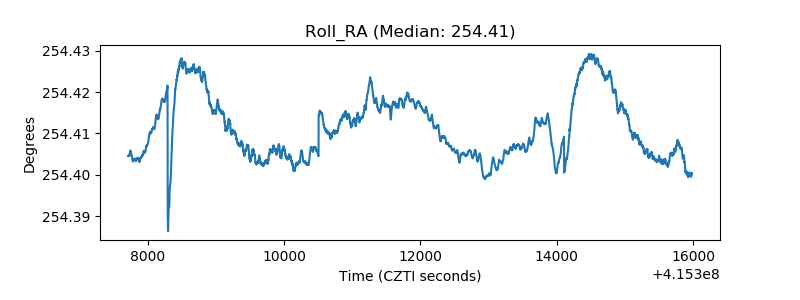 |
| Veto Counter | 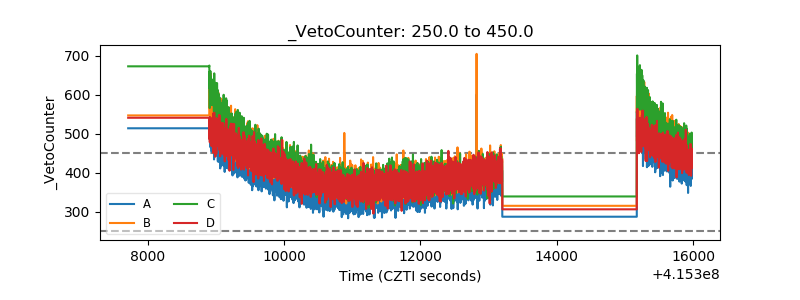 |