| Param | Original file | Final file |
|---|---|---|
| Filename | modeM0/AS1A12_004T01_9000005520_40127cztM0_level2.fits | modeM0/AS1A12_004T01_9000005520_40127cztM0_level2_quad_clean.evt |
| Size (bytes) | 486,653,760 | 84,792,960 |
| Size | 464.1 MB | 80.9 MB |
| Events in quadrant A | 2,637,614 | 612,041 |
| Events in quadrant B | 2,560,717 | 635,779 |
| Events in quadrant C | 6,429,024 | 488,470 |
| Events in quadrant D | 5,999,697 | 481,431 |
| Mode M0 | |||
|---|---|---|---|
| Quadrant | BADHDUFLAG | Total packets | Discarded packets |
| A | 0 | 10902 | 3 |
| B | 0 | 10909 | 2 |
| C | 0 | 22532 | 2 |
| D | 0 | 21183 | 2 |
| Mode M9 | |||
|---|---|---|---|
| Quadrant | BADHDUFLAG | Total packets | Discarded packets |
| A | 0 | 41 | 0 |
| B | 0 | 41 | 0 |
| C | 0 | 41 | 0 |
| D | 0 | 41 | 0 |
| Mode SS | |||
|---|---|---|---|
| Quadrant | BADHDUFLAG | Total packets | Discarded packets |
| A | 0 | 104 | 0 |
| B | 0 | 104 | 0 |
| C | 0 | 104 | 0 |
| D | 0 | 104 | 0 |
| Quadrant | Total seconds | Saturated seconds | Saturation percentage |
|---|---|---|---|
| A | 4989 | 11 | 0.220485% |
| B | 4989 | 75 | 1.503307% |
| C | 4989 | 1196 | 23.972740% |
| D | 4989 | 836 | 16.756865% |
Noise dominated data is calculated using 1-second bins in cleaned event files. If a bin has >2000 counts, and if more than 50% of those come from <1% of pixels, then it is considered to be noise-dominated and hence unusable.
| Quadrant | # 1 sec bins | Bins with >0 counts | Bins with >2000 counts | High rate bins dominated by noise | Noise dominated (total time) | Noise dominated (detector-on time) | Marked lightcurve |
|---|---|---|---|---|---|---|---|
| A | 9025 | 4991 | 5 | 5 | 0.06% | 0.10% | 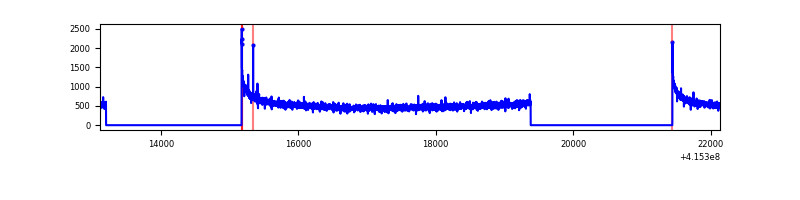 |
| B | 9025 | 4991 | 35 | 35 | 0.39% | 0.70% | 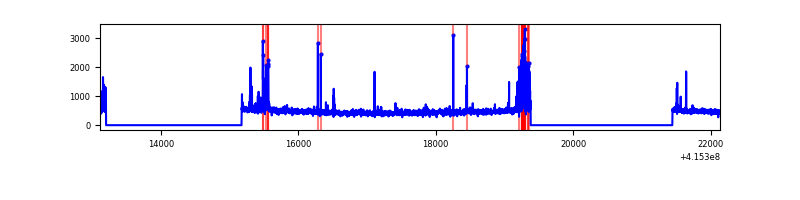 |
| C | 9025 | 4991 | 1192 | 1192 | 13.21% | 23.88% | 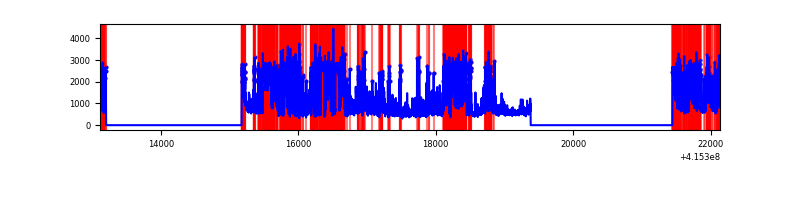 |
| D | 9025 | 4990 | 1092 | 1092 | 12.10% | 21.88% | 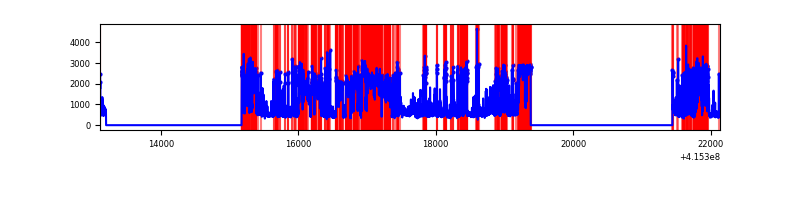 |
Top three noisy pixels from each quadrant. If the there are fewer than three noisy pixels in the level2.evt file, extra rows are filled as -1
| Pixel properties | Quadrant properties | ||||||
|---|---|---|---|---|---|---|---|
| Quadrant | DetID | PixID | Counts | Sigma | Mean | Median | Sigma |
| A | 10 | 83 | 431220 | 3701.21 | 568 | 558 | 116.4 |
| A | 3 | 137 | 5979 | 46.59 | 568 | 558 | 116.4 |
| A | 13 | 254 | 5104 | 39.07 | 568 | 558 | 116.4 |
| B | 4 | 171 | 251158 | 2279.84 | 572 | 558 | 109.9 |
| B | 5 | 255 | 46440 | 417.41 | 572 | 558 | 109.9 |
| B | 12 | 111 | 13487 | 117.62 | 572 | 558 | 109.9 |
| C | 9 | 187 | 4168474 | 35546.43 | 505 | 509 | 117.3 |
| C | 15 | 214 | 187774 | 1597.09 | 505 | 509 | 117.3 |
| C | 0 | 10 | 75433 | 638.99 | 505 | 509 | 117.3 |
| D | 12 | 227 | 3585131 | 28356.67 | 517 | 504 | 126.4 |
| D | 2 | 249 | 125009 | 984.91 | 517 | 504 | 126.4 |
| D | 13 | 249 | 85383 | 671.45 | 517 | 504 | 126.4 |
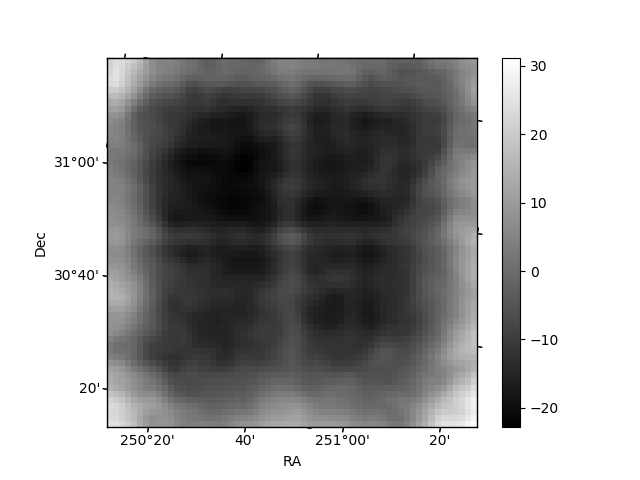
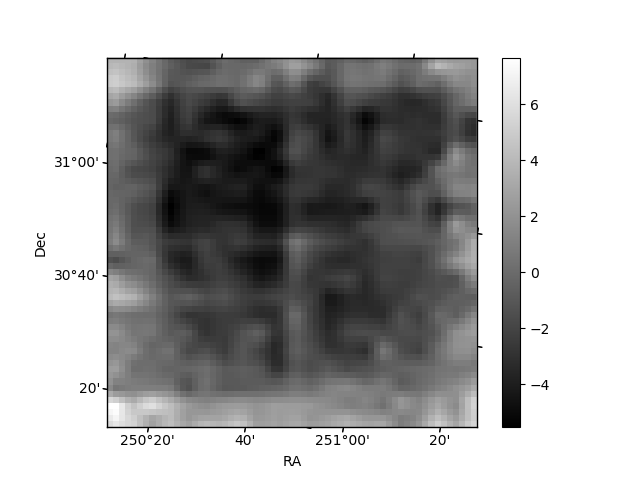
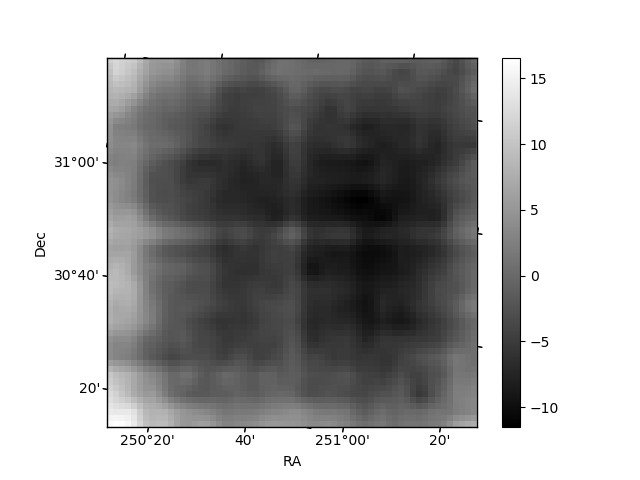
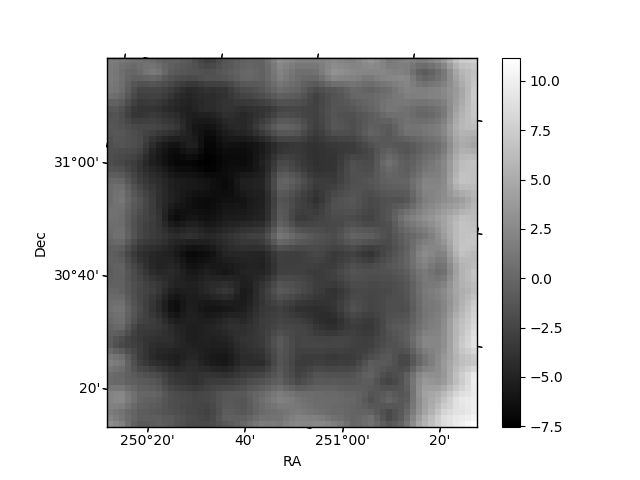
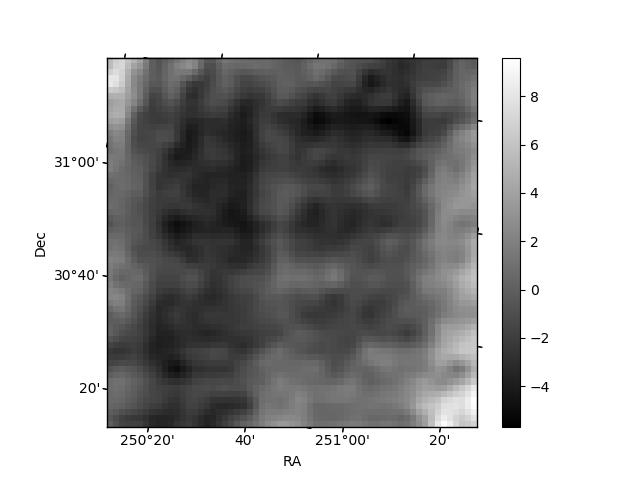
Histogram calculated using DETX and DETY for each event in the final _common_clean file
| Quadrant A | 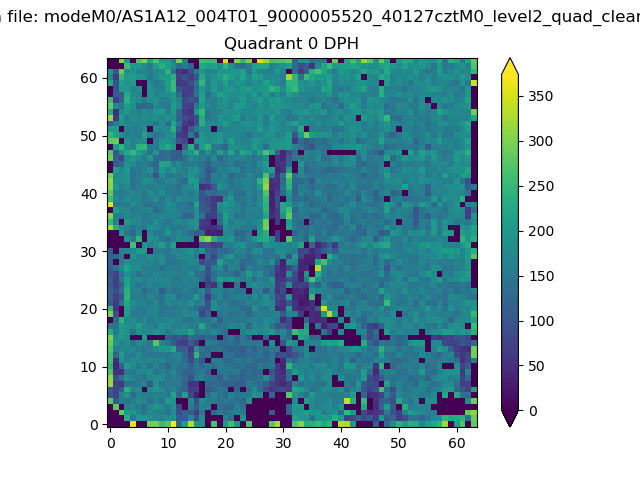 |
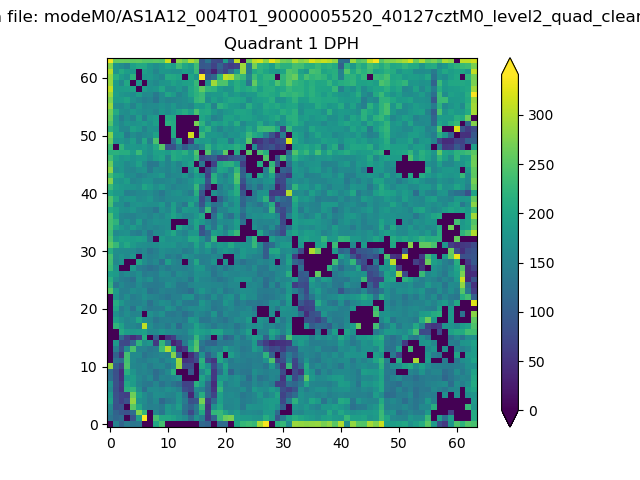 |
Quadrant B |
|---|---|---|---|
| Quadrant D | 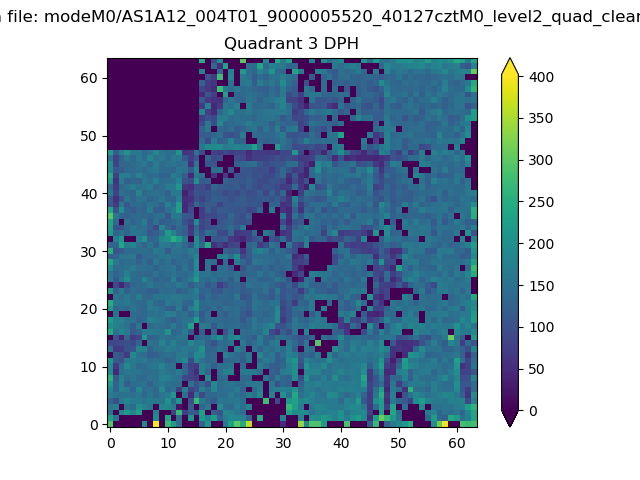 |
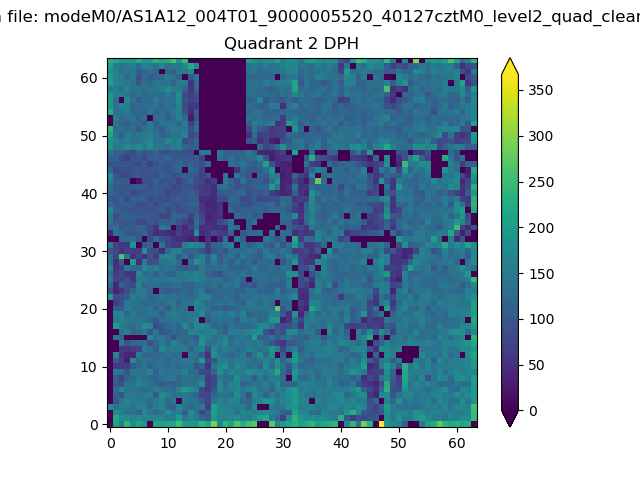 |
Quadrant C |
| Plot type | Count rate plots | Images |
|---|---|---|
| Comparison with Poisson distribution Blue bars denote a histogram of data divided into 1 sec bins. Red curve is a Poisson curve with rate = median count rate of data. |
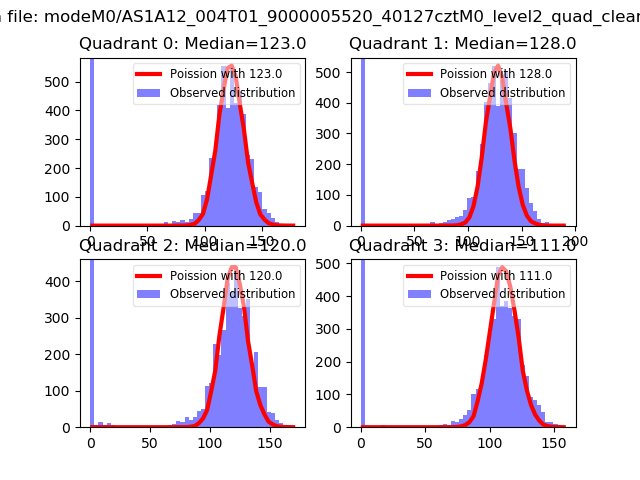 |
 |
| Quadrant-wise count rates Data is divided into 100 sec bins |
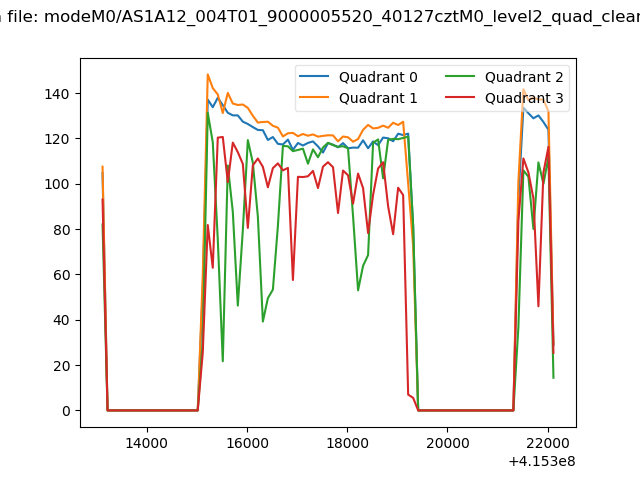 |
|
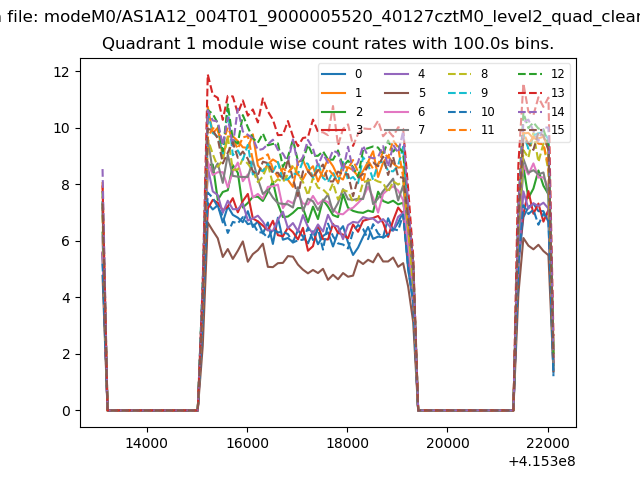
| Module-wise count rates for Quadrant A Data is divided into 100 sec bins |
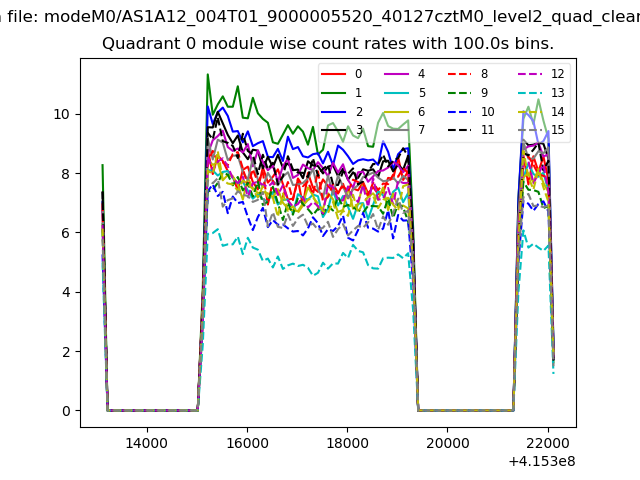 |
 |
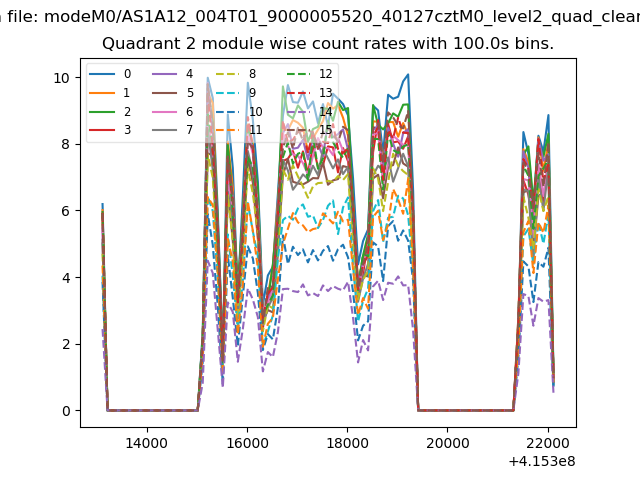
| Module-wise count rates for Quadrant B Data is divided into 100 sec bins |
 |
 |
| Module-wise count rates for Quadrant C Data is divided into 100 sec bins |
 |
 |
| Module-wise count rates for Quadrant D Data is divided into 100 sec bins |
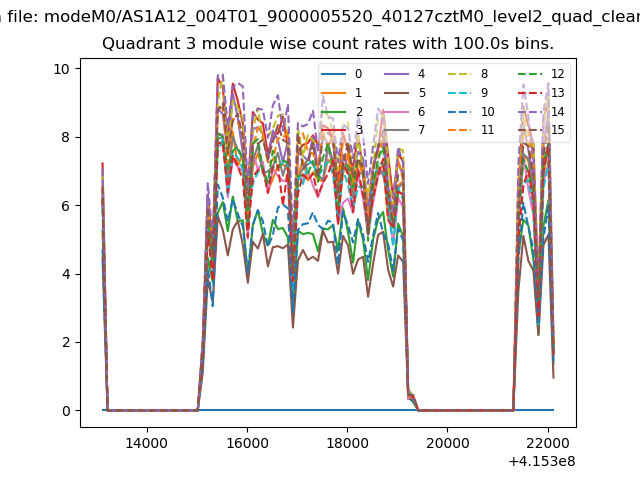 |
 |
| Parameter | Plot |
|---|---|
| CZT HV Monitor | 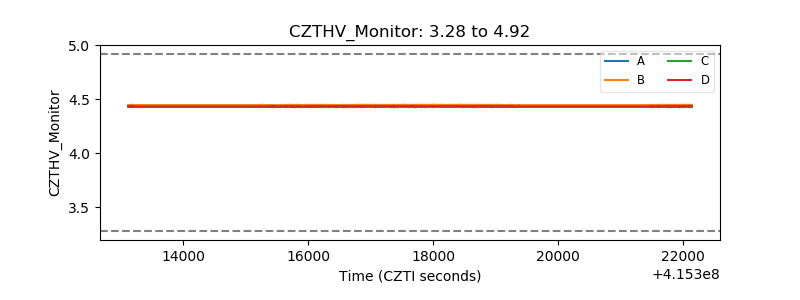 |
| D_VDD | 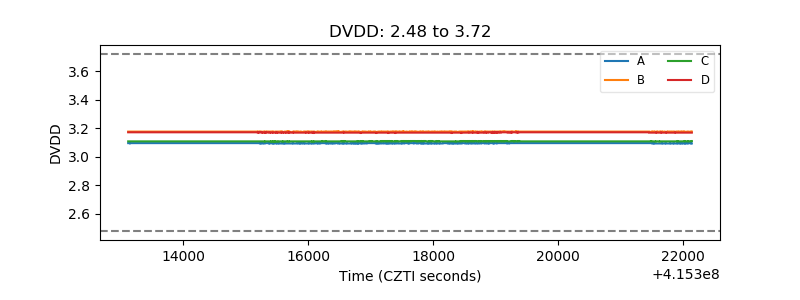 |
| Temperature 1 | 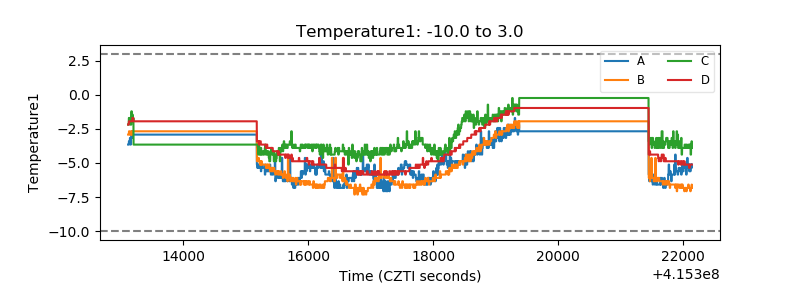 |
| Veto HV Monitor | 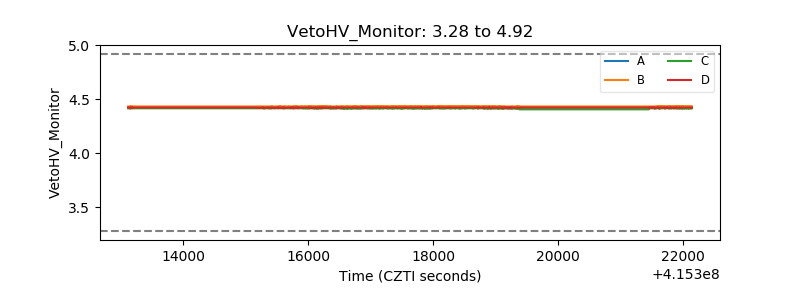 |
| Veto LLD | 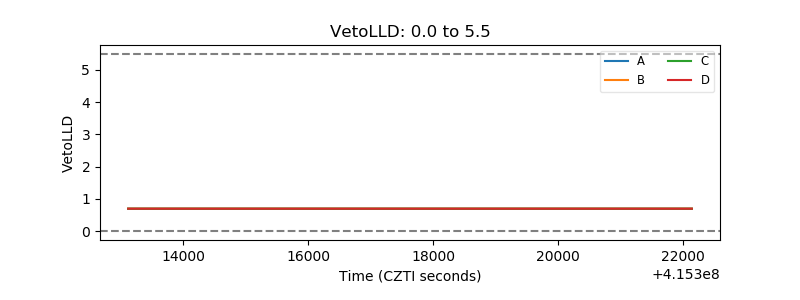 |
| Alpha Counter |  |
| _CPM_Rate | 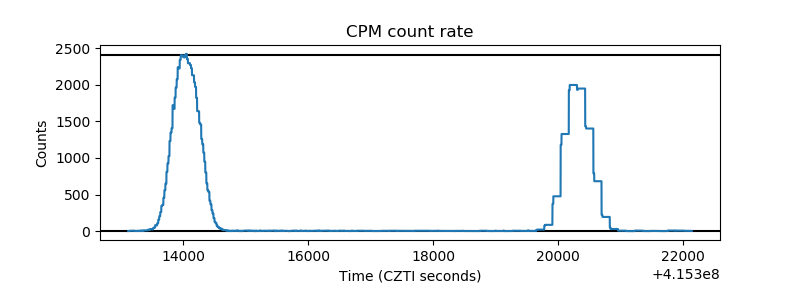 |
| CZT Counter | 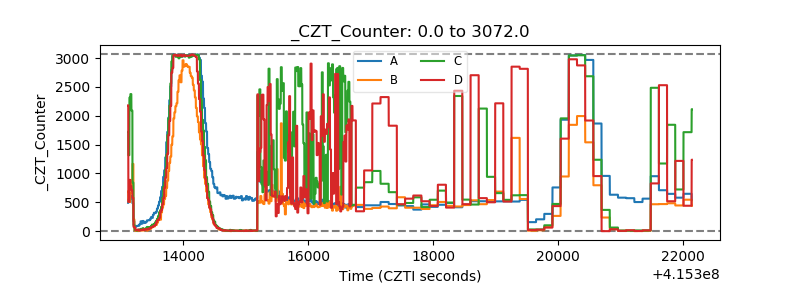 |
| +2.5 Volts monitor | 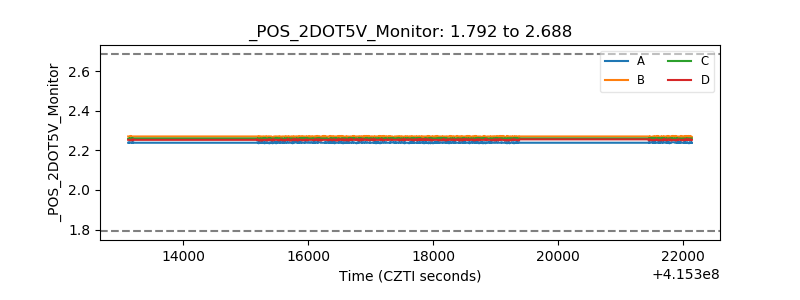 |
| +5 Volts monitor |  |
| _ROLL_ROT | 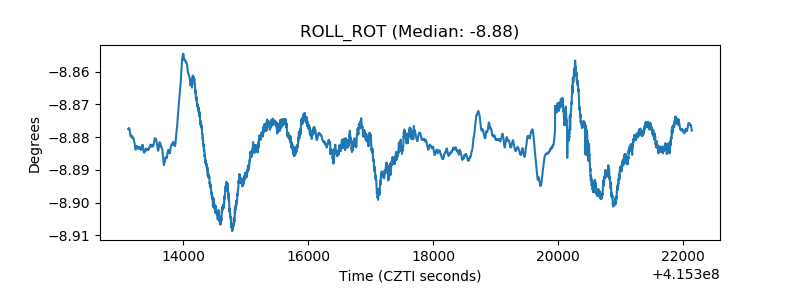 |
| _Roll_DEC | 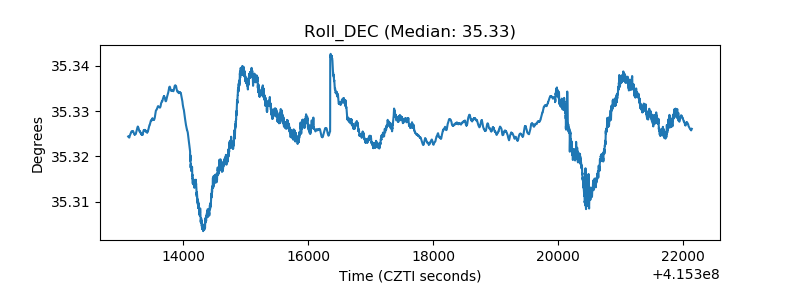 |
| _Roll_RA | 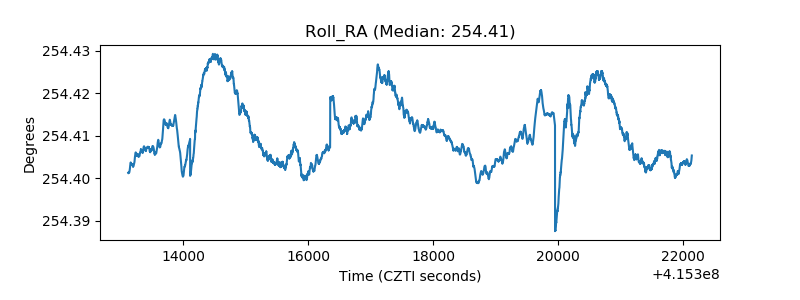 |
| Veto Counter | 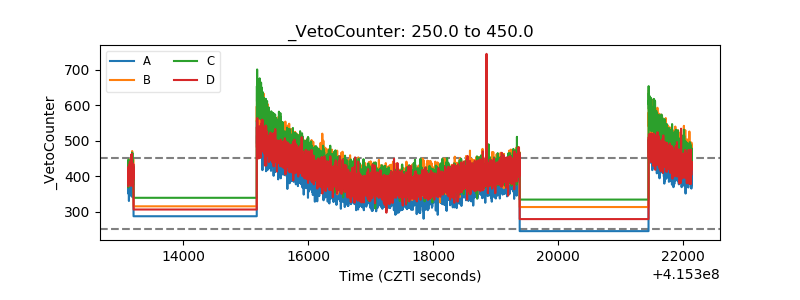 |