| Param | Original file | Final file |
|---|---|---|
| Filename | modeM0/AS1A12_004T01_9000005520_40128cztM0_level2.fits | modeM0/AS1A12_004T01_9000005520_40128cztM0_level2_quad_clean.evt |
| Size (bytes) | 527,780,160 | 79,225,920 |
| Size | 503.3 MB | 75.6 MB |
| Events in quadrant A | 2,574,768 | 586,919 |
| Events in quadrant B | 2,325,793 | 614,622 |
| Events in quadrant C | 6,994,602 | 458,854 |
| Events in quadrant D | 7,260,717 | 394,918 |
| Mode M0 | |||
|---|---|---|---|
| Quadrant | BADHDUFLAG | Total packets | Discarded packets |
| A | 0 | 10717 | 3 |
| B | 0 | 10233 | 2 |
| C | 0 | 24163 | 2 |
| D | 0 | 24944 | 2 |
| Mode M9 | |||
|---|---|---|---|
| Quadrant | BADHDUFLAG | Total packets | Discarded packets |
| A | 0 | 31 | 0 |
| B | 0 | 31 | 0 |
| C | 0 | 31 | 0 |
| D | 0 | 32 | 0 |
| Mode SS | |||
|---|---|---|---|
| Quadrant | BADHDUFLAG | Total packets | Discarded packets |
| A | 0 | 98 | 0 |
| B | 0 | 98 | 0 |
| C | 0 | 98 | 0 |
| D | 0 | 98 | 0 |
| Quadrant | Total seconds | Saturated seconds | Saturation percentage |
|---|---|---|---|
| A | 4904 | 9 | 0.183524% |
| B | 4904 | 25 | 0.509788% |
| C | 4904 | 1339 | 27.304241% |
| D | 4904 | 1523 | 31.056281% |
Noise dominated data is calculated using 1-second bins in cleaned event files. If a bin has >2000 counts, and if more than 50% of those come from <1% of pixels, then it is considered to be noise-dominated and hence unusable.
| Quadrant | # 1 sec bins | Bins with >0 counts | Bins with >2000 counts | High rate bins dominated by noise | Noise dominated (total time) | Noise dominated (detector-on time) | Marked lightcurve |
|---|---|---|---|---|---|---|---|
| A | 7027 | 4905 | 2 | 2 | 0.03% | 0.04% | 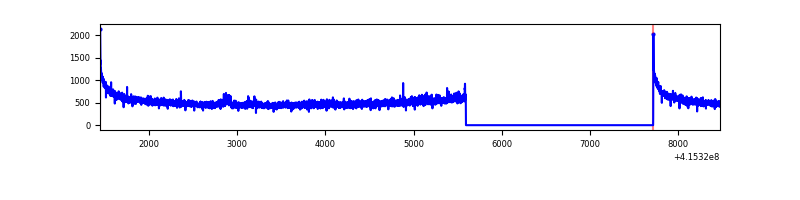 |
| B | 7027 | 4905 | 16 | 16 | 0.23% | 0.33% | 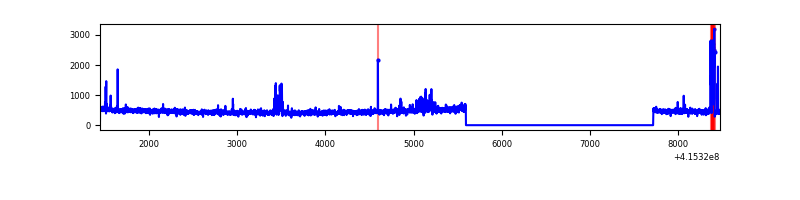 |
| C | 7027 | 4905 | 1333 | 1333 | 18.97% | 27.18% | 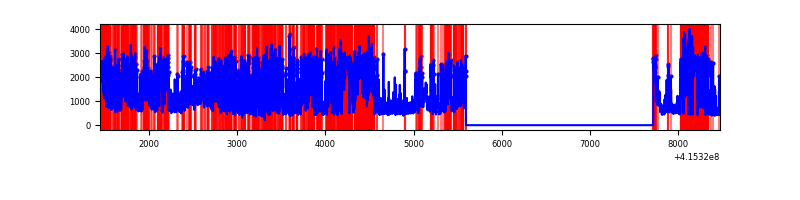 |
| D | 7026 | 4904 | 1640 | 1640 | 23.34% | 33.44% | 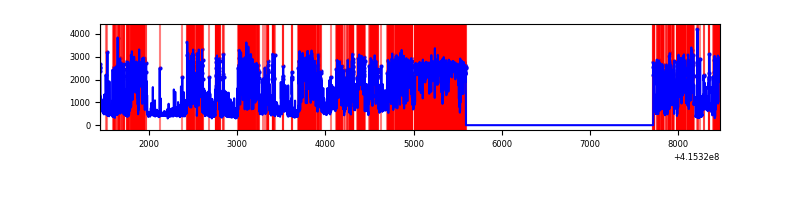 |
Top three noisy pixels from each quadrant. If the there are fewer than three noisy pixels in the level2.evt file, extra rows are filled as -1
| Pixel properties | Quadrant properties | ||||||
|---|---|---|---|---|---|---|---|
| Quadrant | DetID | PixID | Counts | Sigma | Mean | Median | Sigma |
| A | 10 | 83 | 427995 | 3852.5 | 545 | 534 | 111.0 |
| A | 12 | 189 | 37362 | 331.91 | 545 | 534 | 111.0 |
| A | 3 | 137 | 5855 | 47.95 | 545 | 534 | 111.0 |
| B | 5 | 255 | 117008 | 1107.95 | 552 | 537 | 105.1 |
| B | 4 | 171 | 23046 | 214.12 | 552 | 537 | 105.1 |
| B | 0 | 230 | 20176 | 186.82 | 552 | 537 | 105.1 |
| C | 9 | 187 | 4795790 | 42356.28 | 485 | 488 | 113.2 |
| C | 15 | 214 | 186017 | 1638.75 | 485 | 488 | 113.2 |
| C | 0 | 10 | 86026 | 755.55 | 485 | 488 | 113.2 |
| D | 12 | 227 | 5092827 | 44216.95 | 466 | 454 | 115.2 |
| D | 2 | 249 | 128829 | 1114.68 | 466 | 454 | 115.2 |
| D | 13 | 249 | 94826 | 819.43 | 466 | 454 | 115.2 |
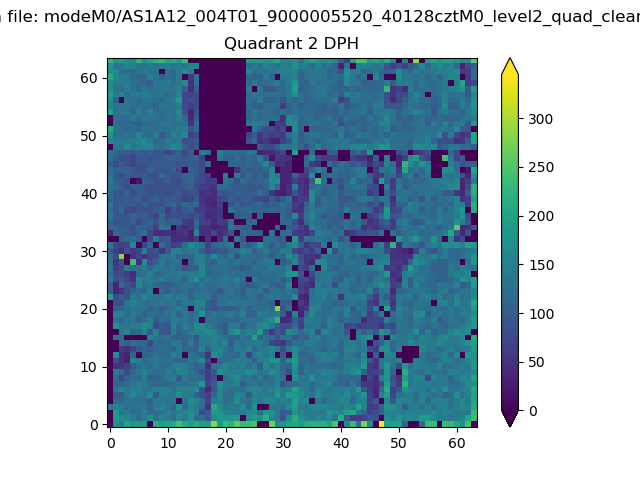
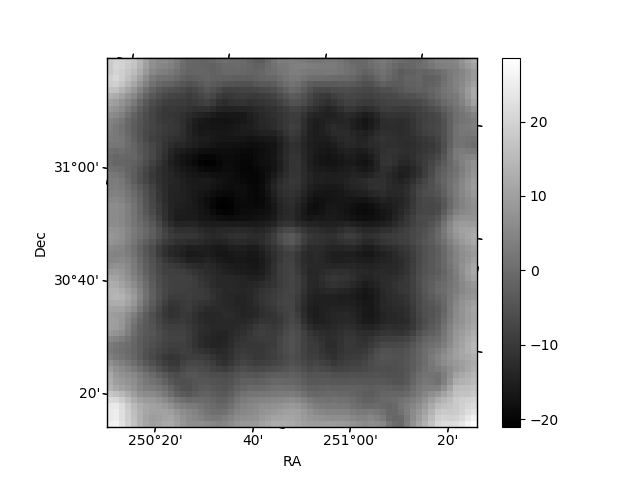
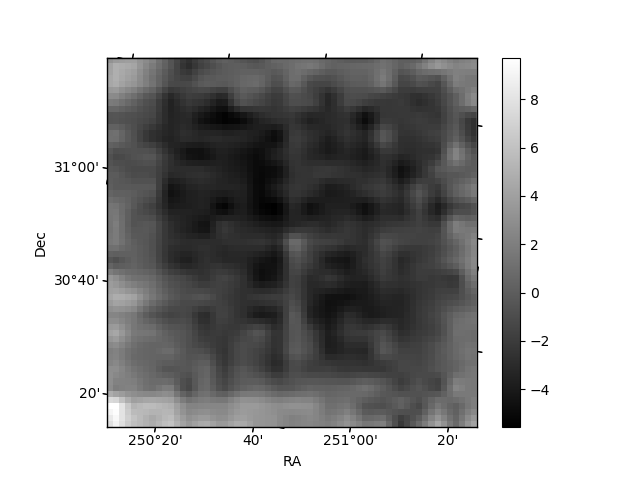
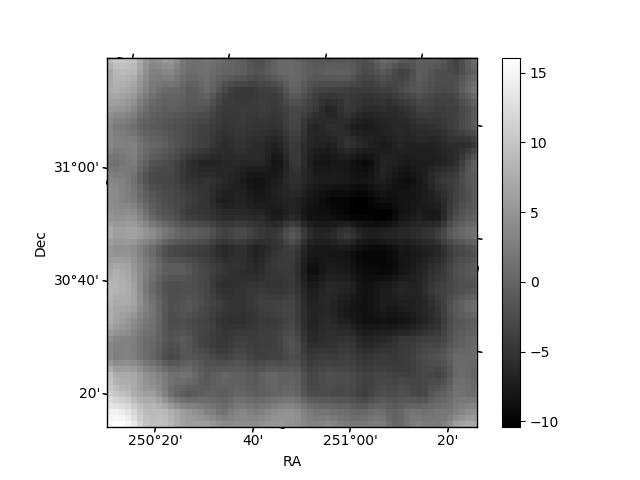
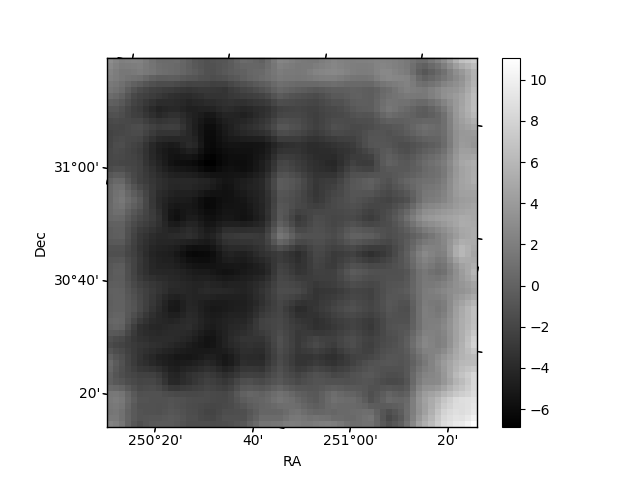
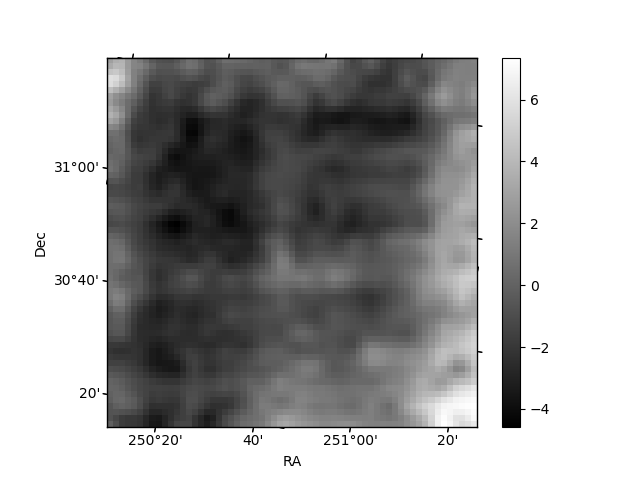
Histogram calculated using DETX and DETY for each event in the final _common_clean file
| Quadrant A | 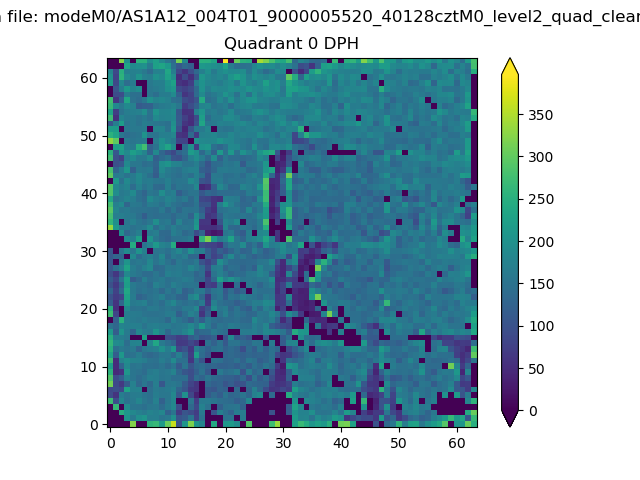 |
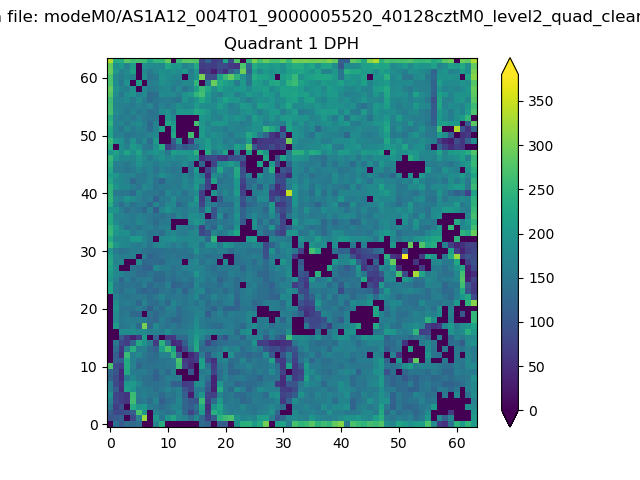 |
Quadrant B |
|---|---|---|---|
| Quadrant D | 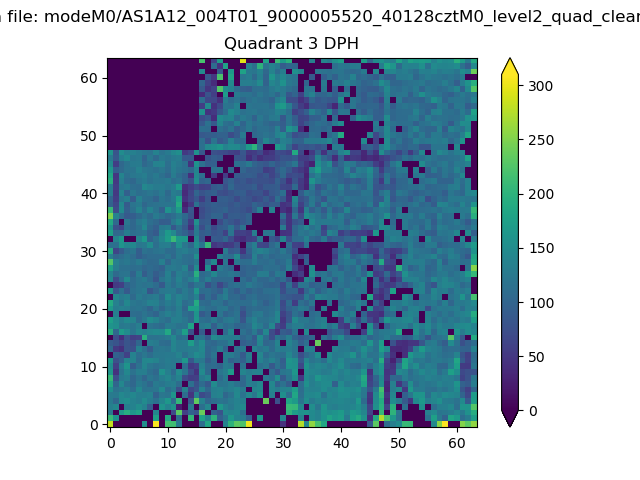 |
 |
Quadrant C |
| Plot type | Count rate plots | Images |
|---|---|---|
| Comparison with Poisson distribution Blue bars denote a histogram of data divided into 1 sec bins. Red curve is a Poisson curve with rate = median count rate of data. |
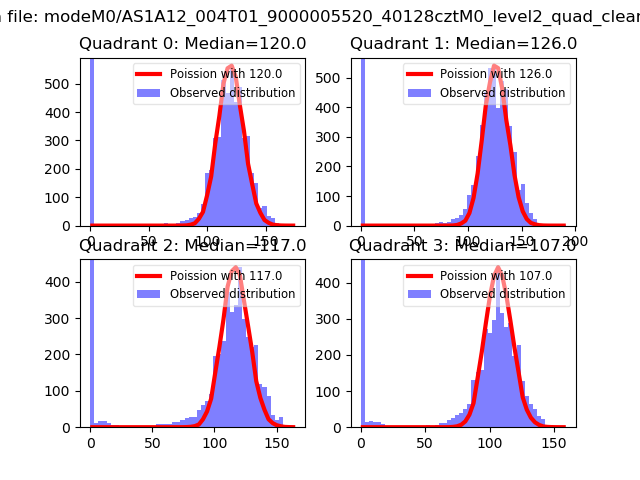 |
 |
| Quadrant-wise count rates Data is divided into 100 sec bins |
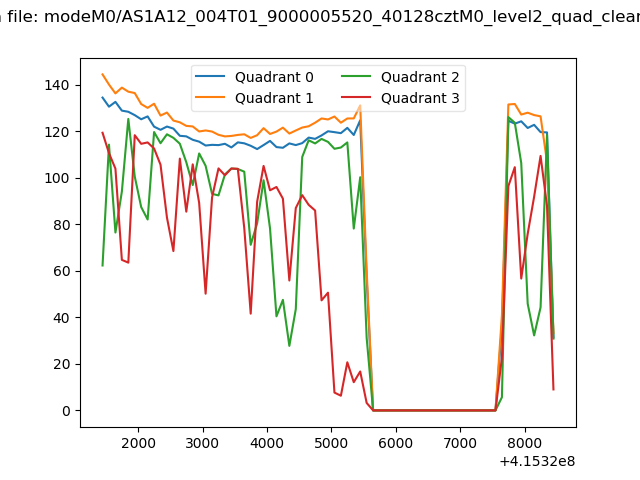 |
|
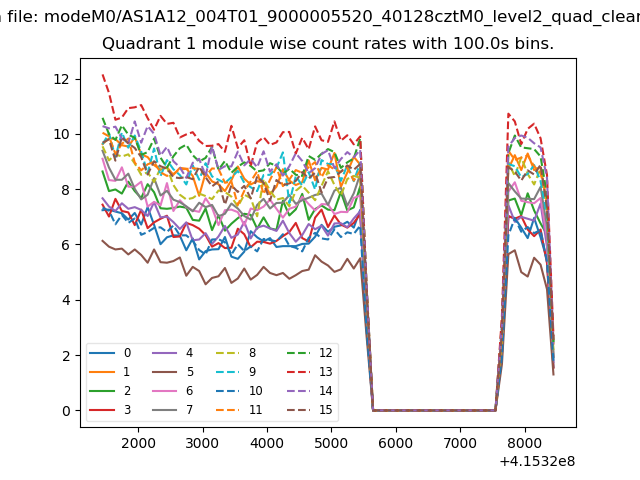
| Module-wise count rates for Quadrant A Data is divided into 100 sec bins |
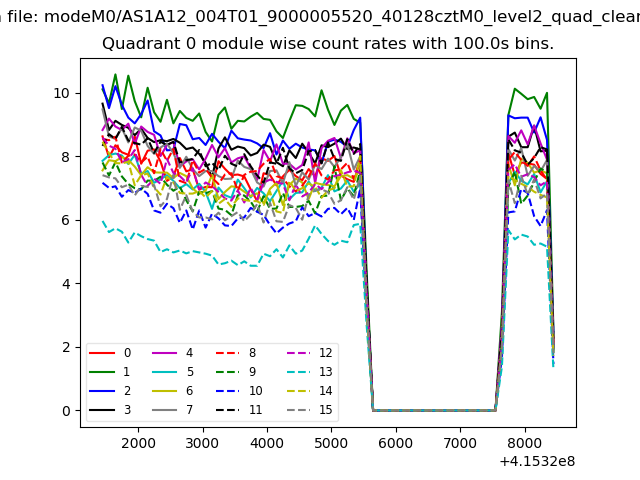 |
 |
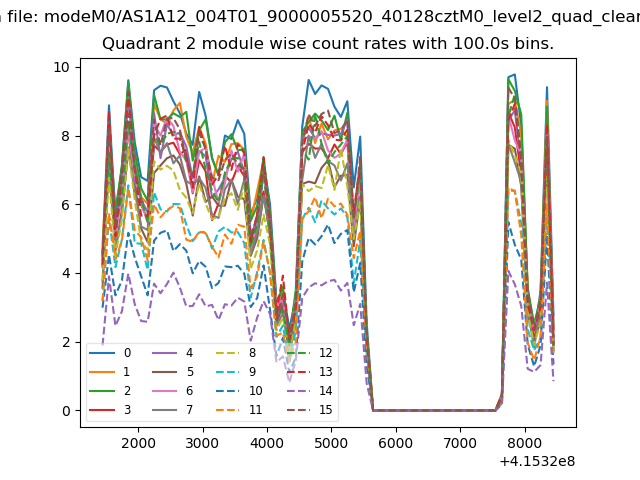
| Module-wise count rates for Quadrant B Data is divided into 100 sec bins |
 |
 |
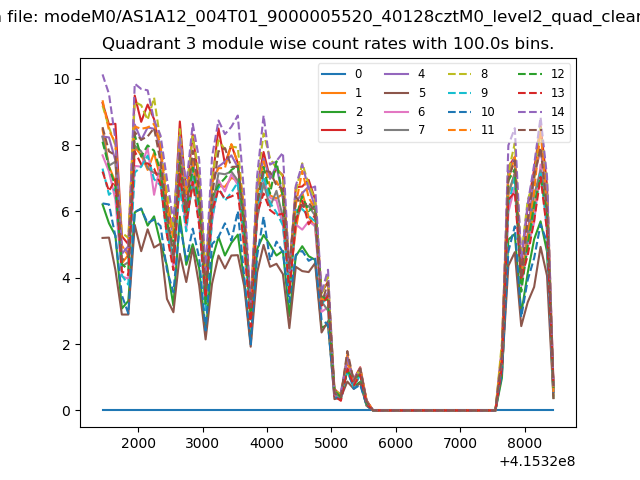
| Module-wise count rates for Quadrant C Data is divided into 100 sec bins |
 |
 |
| Module-wise count rates for Quadrant D Data is divided into 100 sec bins |
 |
 |
| Parameter | Plot |
|---|---|
| CZT HV Monitor | 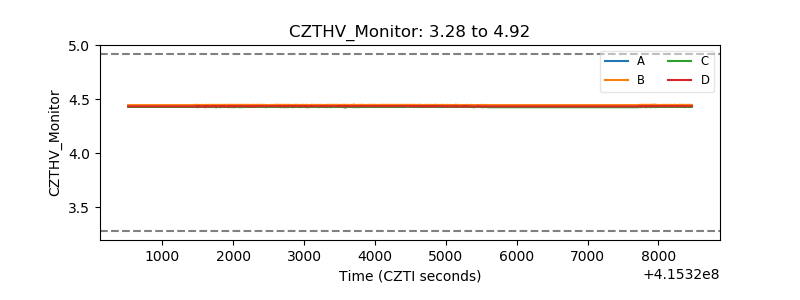 |
| D_VDD | 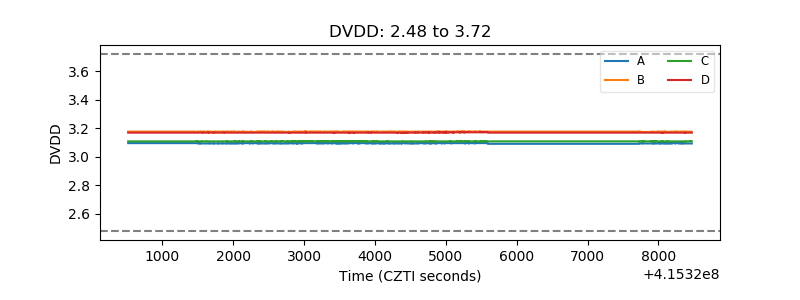 |
| Temperature 1 | 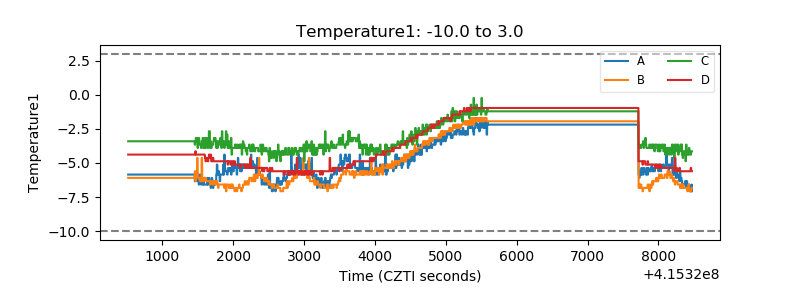 |
| Veto HV Monitor | 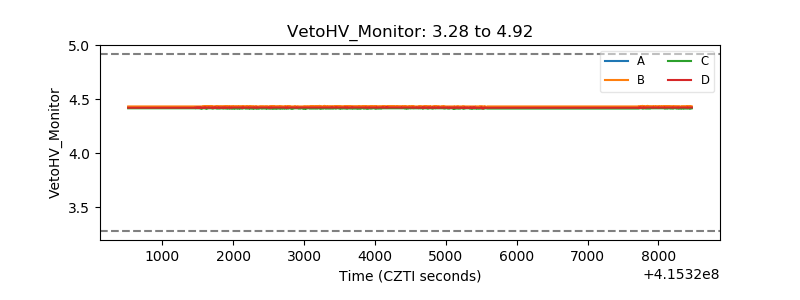 |
| Veto LLD | 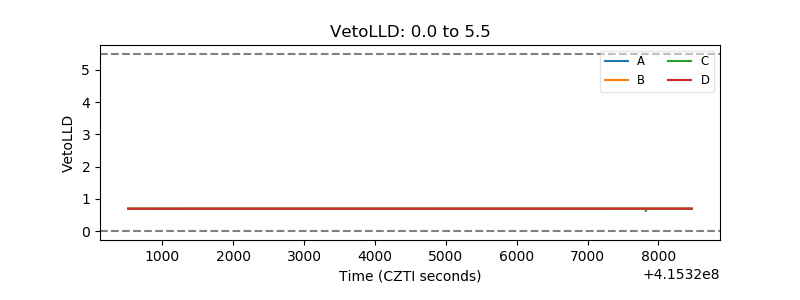 |
| Alpha Counter | 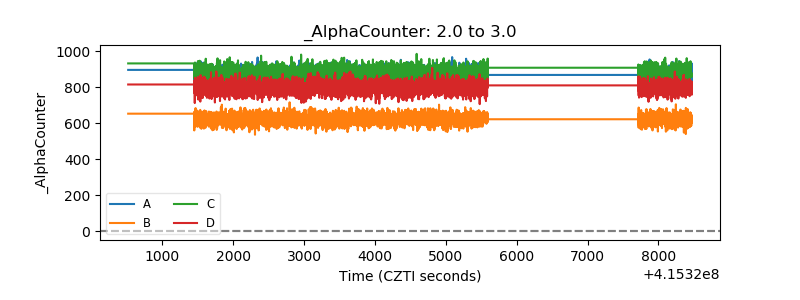 |
| _CPM_Rate | 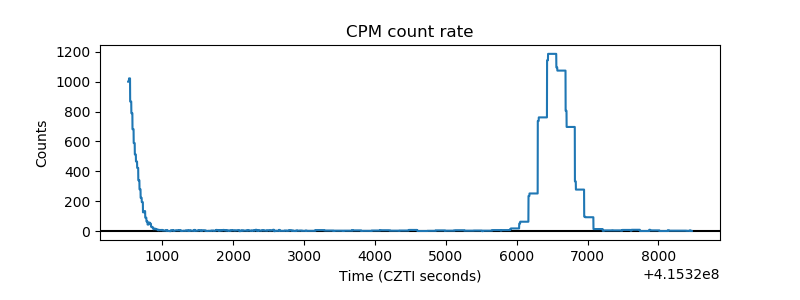 |
| CZT Counter | 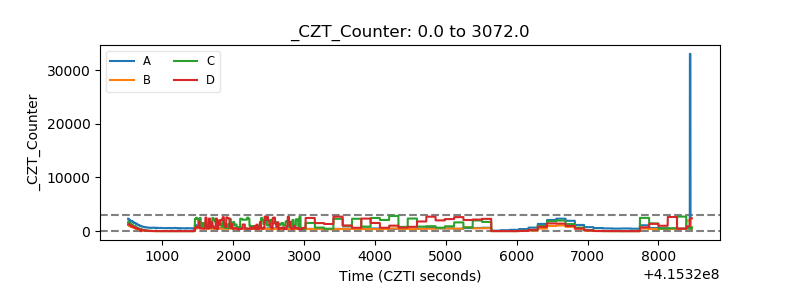 |
| +2.5 Volts monitor | 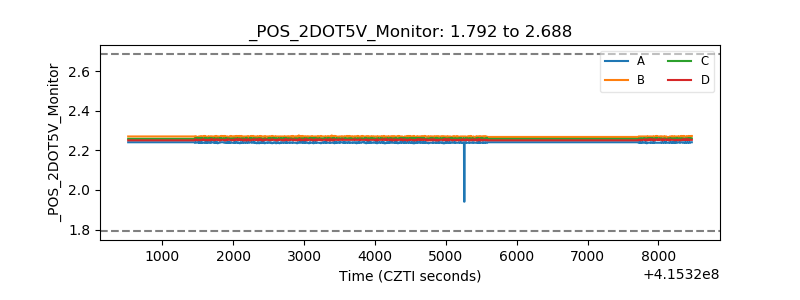 |
| +5 Volts monitor |  |
| _ROLL_ROT | 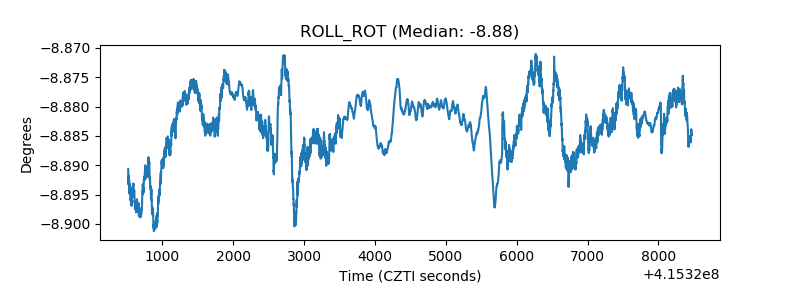 |
| _Roll_DEC | 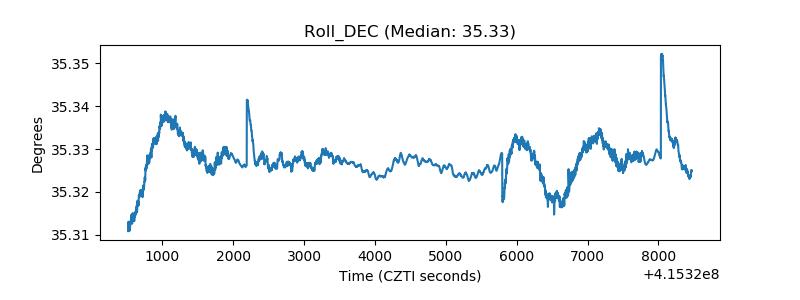 |
| _Roll_RA | 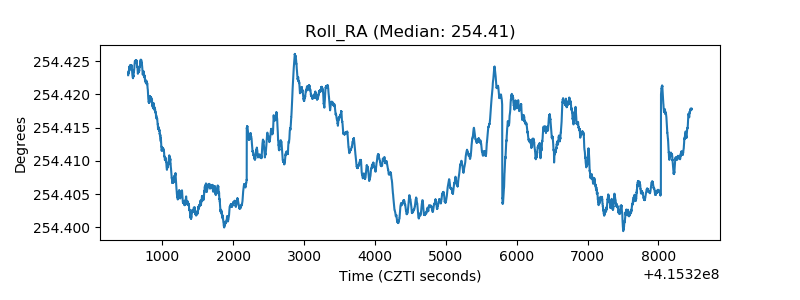 |
| Veto Counter | 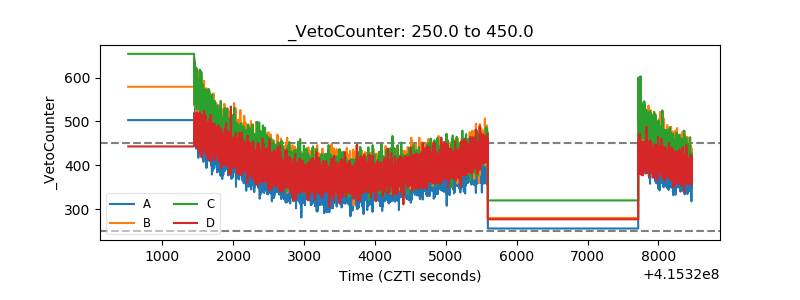 |