| Param | Original file | Final file |
|---|---|---|
| Filename | modeM0/AS1A12_004T01_9000005520_40129cztM0_level2.fits | modeM0/AS1A12_004T01_9000005520_40129cztM0_level2_quad_clean.evt |
| Size (bytes) | 512,331,840 | 82,843,200 |
| Size | 488.6 MB | 79.0 MB |
| Events in quadrant A | 2,671,087 | 601,219 |
| Events in quadrant B | 2,566,213 | 621,541 |
| Events in quadrant C | 7,930,038 | 435,696 |
| Events in quadrant D | 5,389,944 | 482,655 |
| Mode M0 | |||
|---|---|---|---|
| Quadrant | BADHDUFLAG | Total packets | Discarded packets |
| A | 0 | 11252 | 3 |
| B | 0 | 11378 | 2 |
| C | 0 | 27165 | 2 |
| D | 0 | 19750 | 2 |
| Mode M9 | |||
|---|---|---|---|
| Quadrant | BADHDUFLAG | Total packets | Discarded packets |
| A | 0 | 30 | 0 |
| B | 0 | 30 | 0 |
| C | 0 | 30 | 0 |
| D | 0 | 31 | 0 |
| Mode SS | |||
|---|---|---|---|
| Quadrant | BADHDUFLAG | Total packets | Discarded packets |
| A | 0 | 106 | 0 |
| B | 0 | 106 | 0 |
| C | 0 | 106 | 0 |
| D | 0 | 106 | 0 |
| Quadrant | Total seconds | Saturated seconds | Saturation percentage |
|---|---|---|---|
| A | 5246 | 13 | 0.247808% |
| B | 5246 | 80 | 1.524971% |
| C | 5246 | 1726 | 32.901258% |
| D | 5246 | 745 | 14.201296% |
Noise dominated data is calculated using 1-second bins in cleaned event files. If a bin has >2000 counts, and if more than 50% of those come from <1% of pixels, then it is considered to be noise-dominated and hence unusable.
| Quadrant | # 1 sec bins | Bins with >0 counts | Bins with >2000 counts | High rate bins dominated by noise | Noise dominated (total time) | Noise dominated (detector-on time) | Marked lightcurve |
|---|---|---|---|---|---|---|---|
| A | 7368 | 5247 | 4 | 4 | 0.05% | 0.08% | 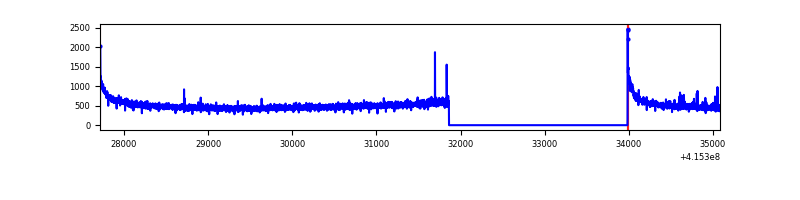 |
| B | 7368 | 5247 | 56 | 56 | 0.76% | 1.07% | 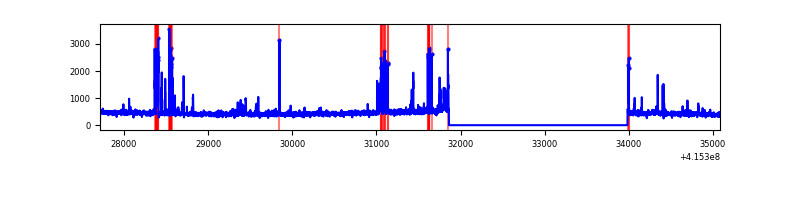 |
| C | 7368 | 5247 | 1795 | 1795 | 24.36% | 34.21% | 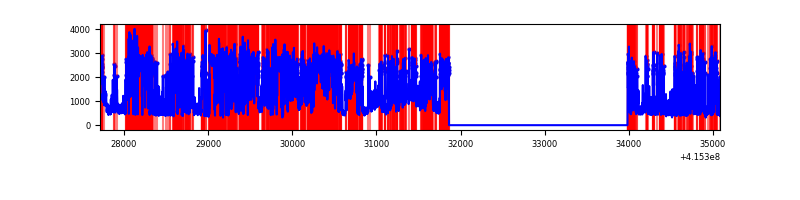 |
| D | 7368 | 5247 | 818 | 818 | 11.10% | 15.59% | 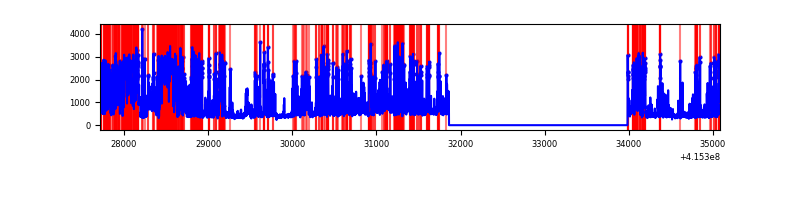 |
Top three noisy pixels from each quadrant. If the there are fewer than three noisy pixels in the level2.evt file, extra rows are filled as -1
| Pixel properties | Quadrant properties | ||||||
|---|---|---|---|---|---|---|---|
| Quadrant | DetID | PixID | Counts | Sigma | Mean | Median | Sigma |
| A | 10 | 83 | 450092 | 3892.87 | 566 | 555 | 115.5 |
| A | 2 | 79 | 25297 | 214.26 | 566 | 555 | 115.5 |
| A | 3 | 137 | 6076 | 47.81 | 566 | 555 | 115.5 |
| B | 5 | 255 | 234702 | 2138.67 | 568 | 553 | 109.5 |
| B | 4 | 171 | 74622 | 676.53 | 568 | 553 | 109.5 |
| B | 0 | 245 | 16615 | 146.71 | 568 | 553 | 109.5 |
| C | 9 | 187 | 5753458 | 51561.7 | 479 | 483 | 111.6 |
| C | 15 | 214 | 192674 | 1722.53 | 479 | 483 | 111.6 |
| C | 0 | 10 | 60201 | 535.23 | 479 | 483 | 111.6 |
| D | 12 | 227 | 2180183 | 17144.71 | 517 | 502 | 127.1 |
| D | 2 | 249 | 529998 | 4164.86 | 517 | 502 | 127.1 |
| D | 2 | 250 | 477944 | 3755.41 | 517 | 502 | 127.1 |
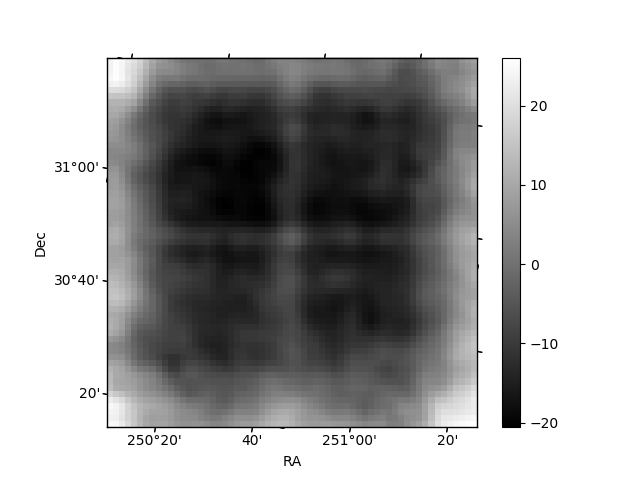
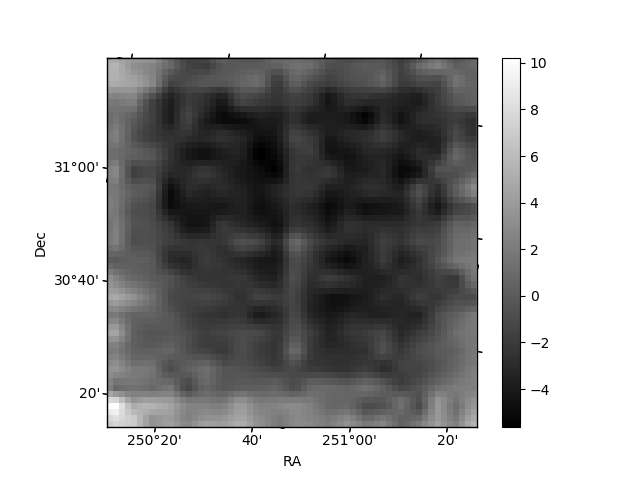
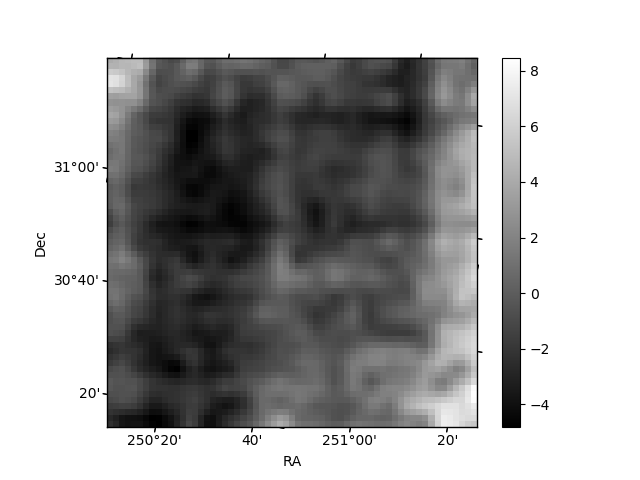
Histogram calculated using DETX and DETY for each event in the final _common_clean file
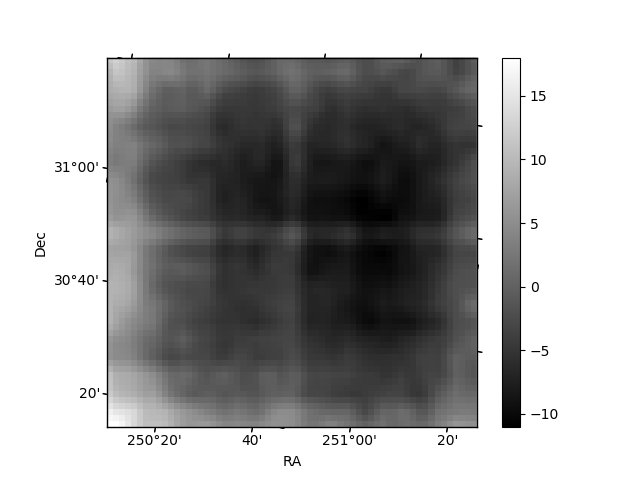
| Quadrant A | 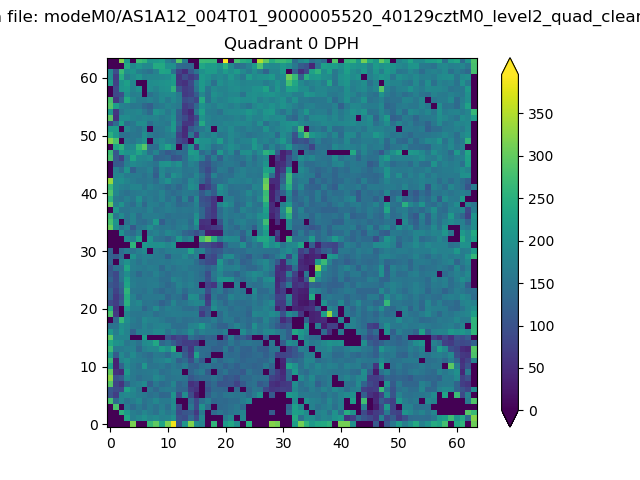 |
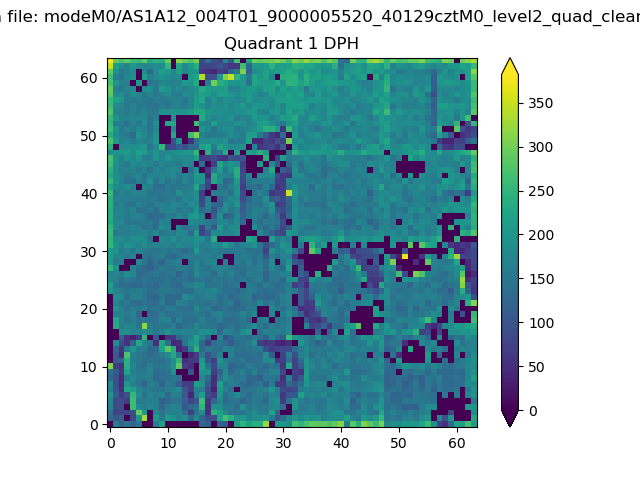 |
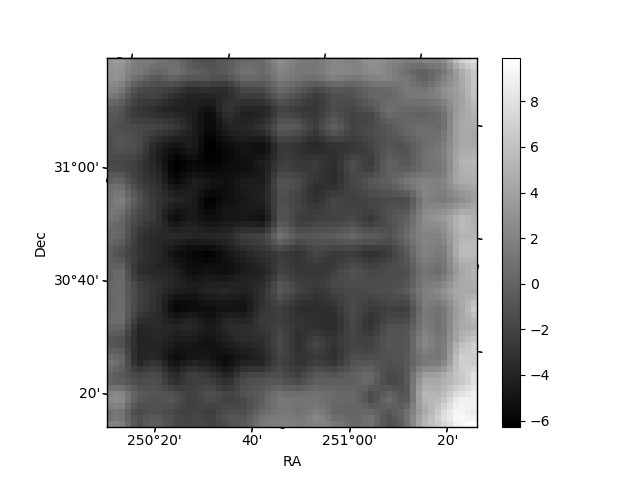
Quadrant B |
|---|---|---|---|
| Quadrant D | 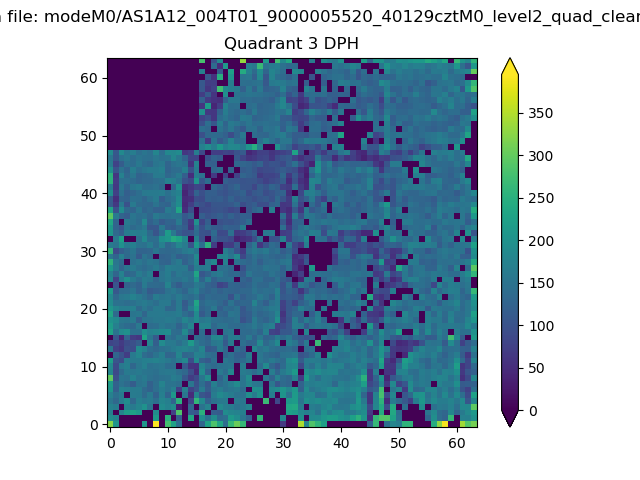 |
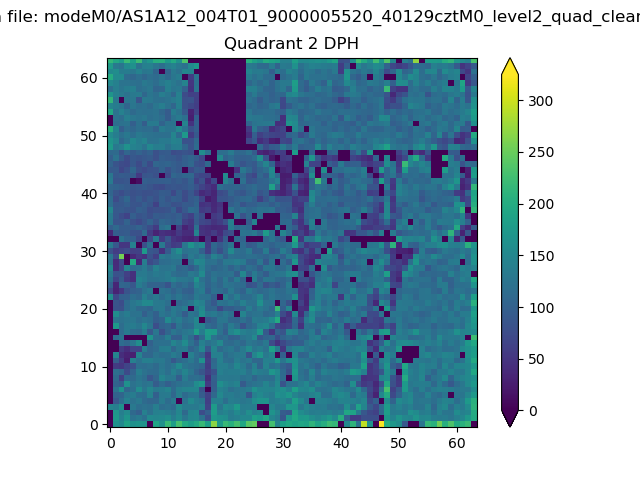 |
Quadrant C |
| Plot type | Count rate plots | Images |
|---|---|---|
| Comparison with Poisson distribution Blue bars denote a histogram of data divided into 1 sec bins. Red curve is a Poisson curve with rate = median count rate of data. |
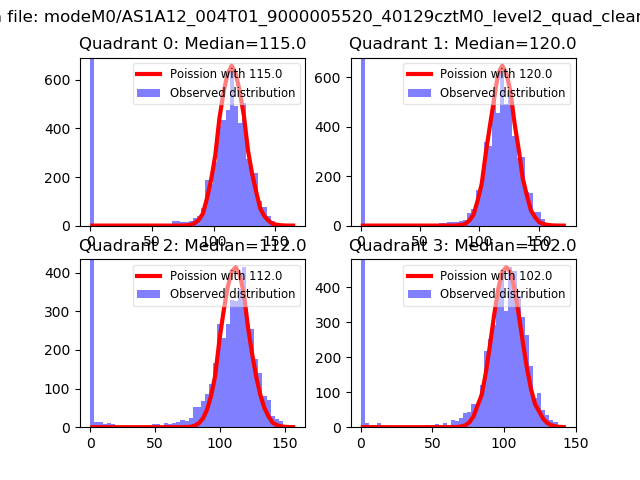 |
 |
| Quadrant-wise count rates Data is divided into 100 sec bins |
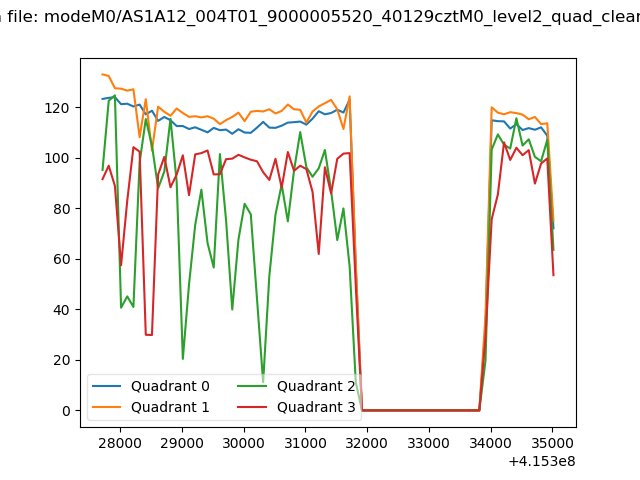 |
|
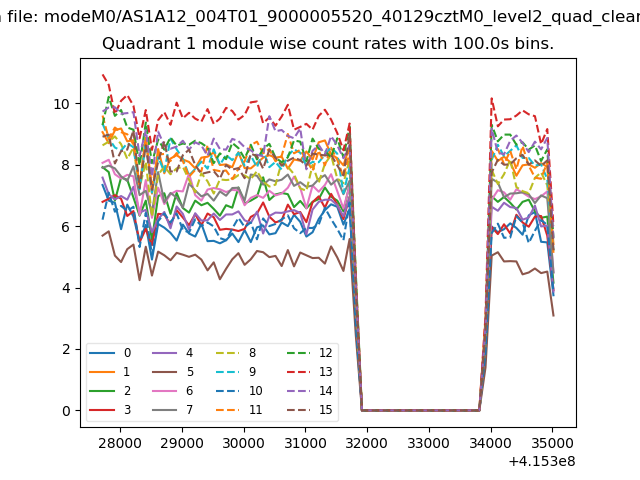
| Module-wise count rates for Quadrant A Data is divided into 100 sec bins |
 |
 |
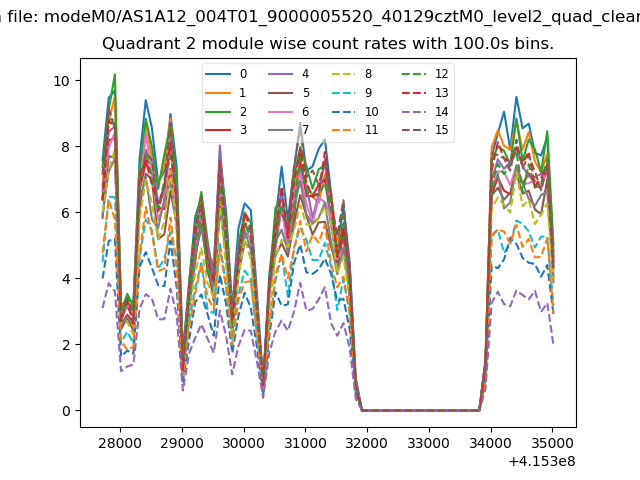
| Module-wise count rates for Quadrant B Data is divided into 100 sec bins |
 |
 |
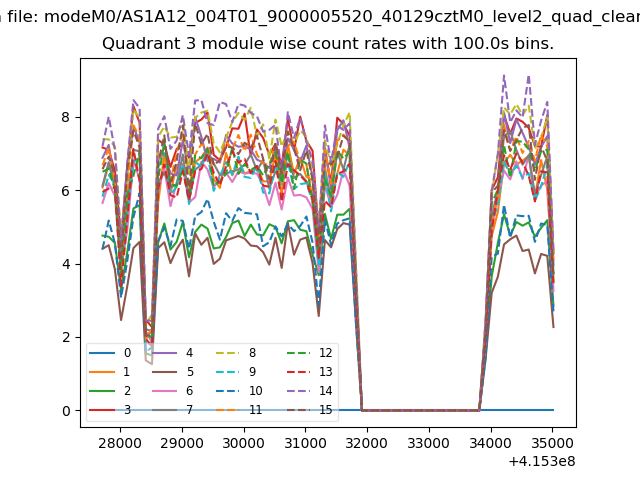
| Module-wise count rates for Quadrant C Data is divided into 100 sec bins |
 |
 |
| Module-wise count rates for Quadrant D Data is divided into 100 sec bins |
 |
 |
| Parameter | Plot |
|---|---|
| CZT HV Monitor |  |
| D_VDD | 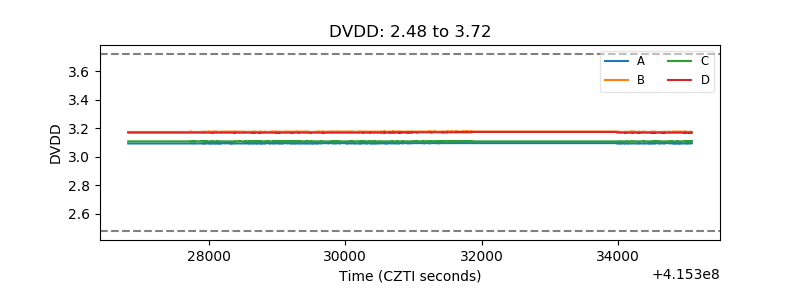 |
| Temperature 1 | 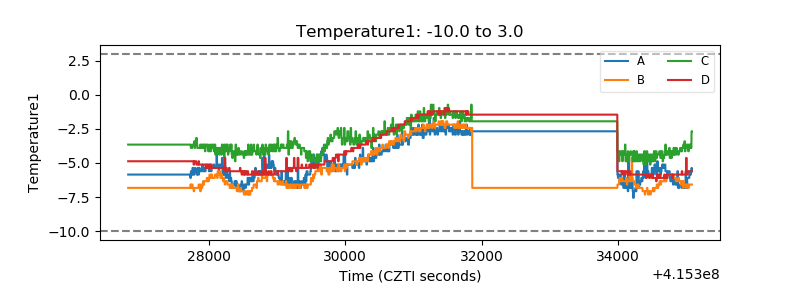 |
| Veto HV Monitor | 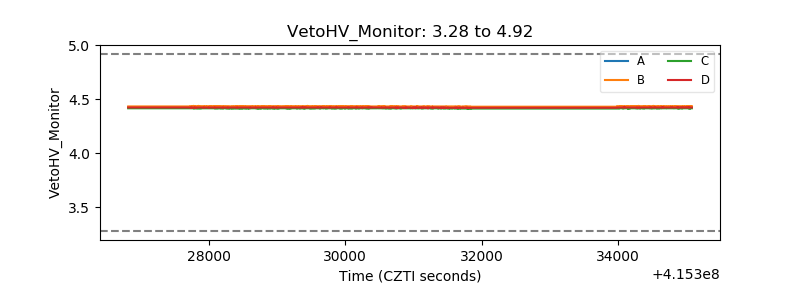 |
| Veto LLD | 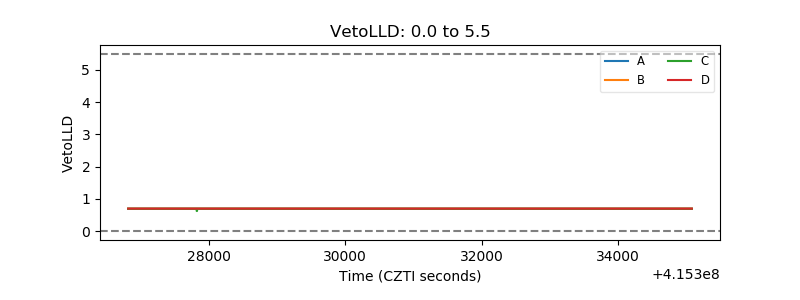 |
| Alpha Counter | 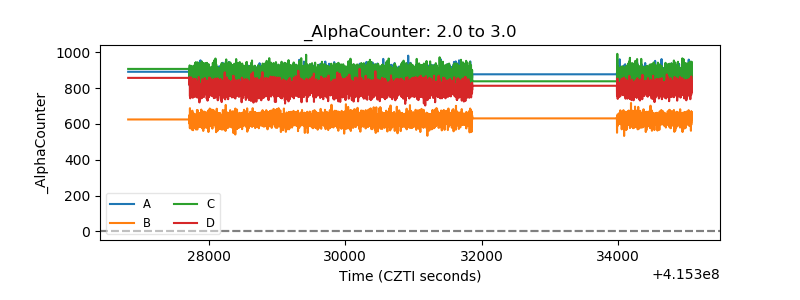 |
| _CPM_Rate | 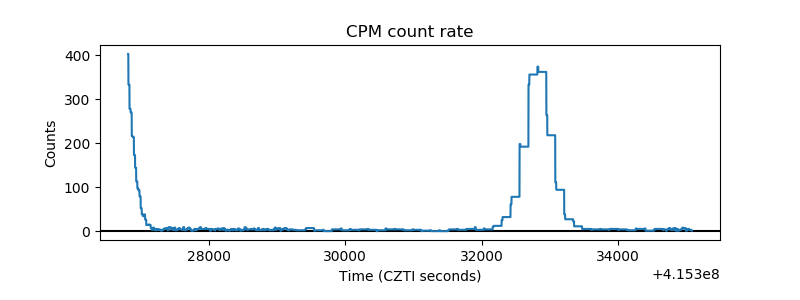 |
| CZT Counter | 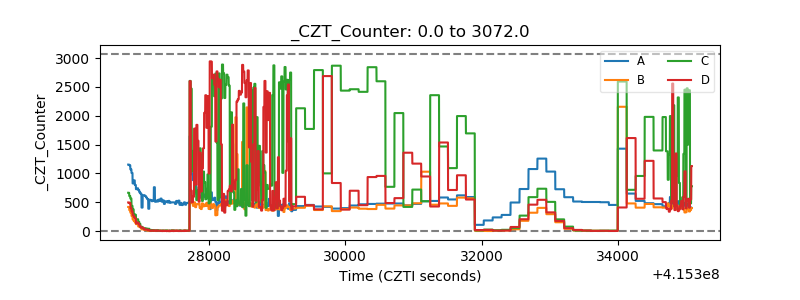 |
| +2.5 Volts monitor | 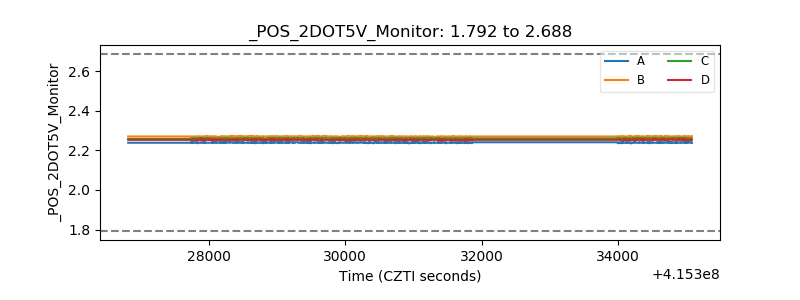 |
| +5 Volts monitor |  |
| _ROLL_ROT | 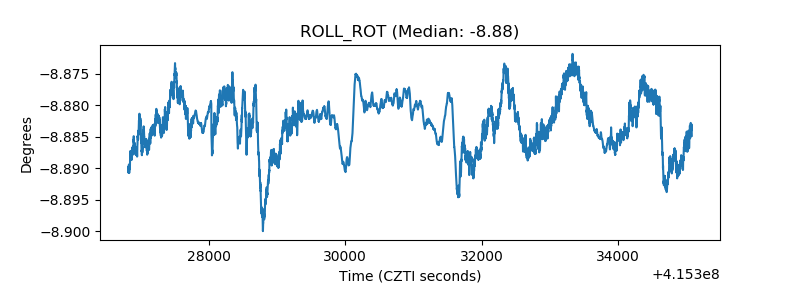 |
| _Roll_DEC | 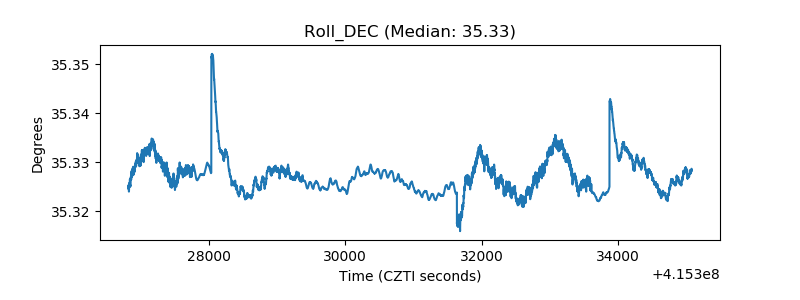 |
| _Roll_RA | 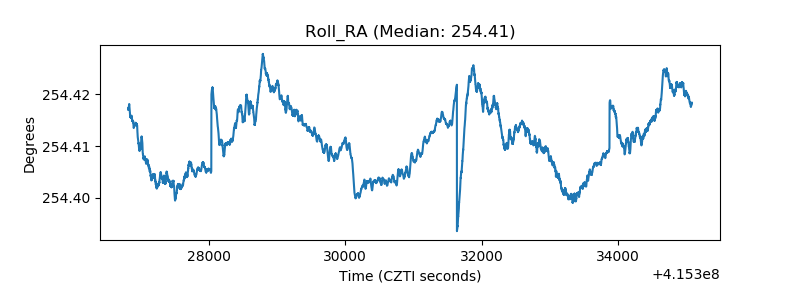 |
| Veto Counter | 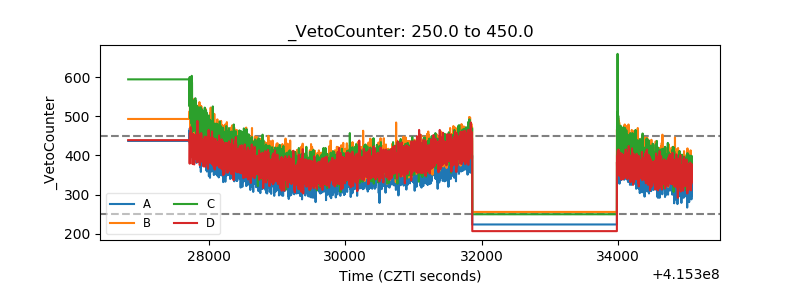 |