| Param | Original file | Final file |
|---|---|---|
| Filename | modeM0/AS1A12_004T01_9000005520_40130cztM0_level2.fits | modeM0/AS1A12_004T01_9000005520_40130cztM0_level2_quad_clean.evt |
| Size (bytes) | 477,048,960 | 85,089,600 |
| Size | 454.9 MB | 81.1 MB |
| Events in quadrant A | 2,777,423 | 599,515 |
| Events in quadrant B | 2,603,207 | 618,784 |
| Events in quadrant C | 8,369,235 | 447,374 |
| Events in quadrant D | 3,484,991 | 529,057 |
| Mode M0 | |||
|---|---|---|---|
| Quadrant | BADHDUFLAG | Total packets | Discarded packets |
| A | 0 | 11621 | 3 |
| B | 0 | 11756 | 2 |
| C | 0 | 28630 | 2 |
| D | 0 | 14315 | 2 |
| Mode M9 | |||
|---|---|---|---|
| Quadrant | BADHDUFLAG | Total packets | Discarded packets |
| A | 0 | 21 | 0 |
| B | 0 | 21 | 0 |
| C | 0 | 21 | 0 |
| D | 0 | 22 | 0 |
| Mode SS | |||
|---|---|---|---|
| Quadrant | BADHDUFLAG | Total packets | Discarded packets |
| A | 0 | 110 | 0 |
| B | 0 | 110 | 0 |
| C | 0 | 110 | 0 |
| D | 0 | 110 | 0 |
| Quadrant | Total seconds | Saturated seconds | Saturation percentage |
|---|---|---|---|
| A | 5455 | 12 | 0.219982% |
| B | 5455 | 75 | 1.374885% |
| C | 5455 | 1728 | 31.677360% |
| D | 5455 | 223 | 4.087993% |
Noise dominated data is calculated using 1-second bins in cleaned event files. If a bin has >2000 counts, and if more than 50% of those come from <1% of pixels, then it is considered to be noise-dominated and hence unusable.
| Quadrant | # 1 sec bins | Bins with >0 counts | Bins with >2000 counts | High rate bins dominated by noise | Noise dominated (total time) | Noise dominated (detector-on time) | Marked lightcurve |
|---|---|---|---|---|---|---|---|
| A | 7399 | 5456 | 5 | 5 | 0.07% | 0.09% | 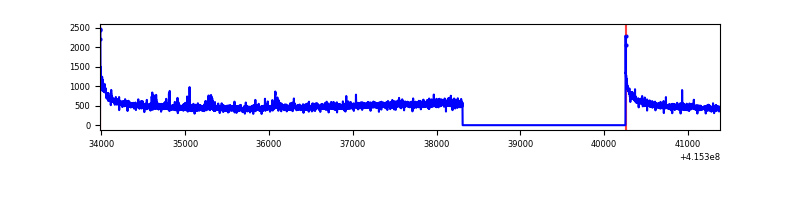 |
| B | 7399 | 5456 | 67 | 67 | 0.91% | 1.23% | 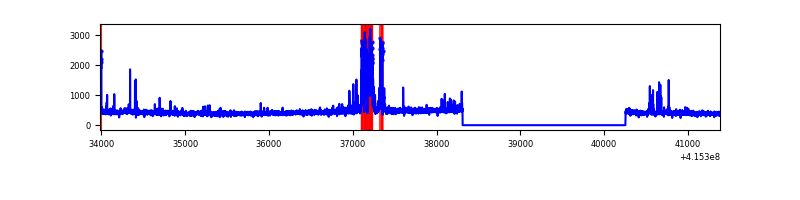 |
| C | 7399 | 5455 | 1825 | 1825 | 24.67% | 33.46% | 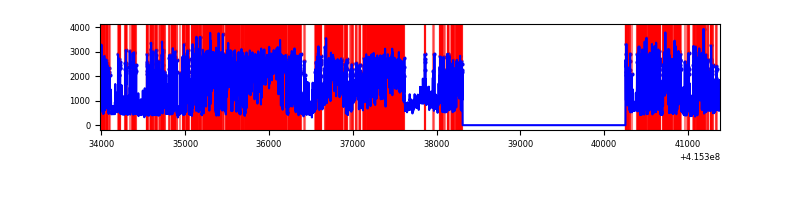 |
| D | 7399 | 5456 | 224 | 224 | 3.03% | 4.11% | 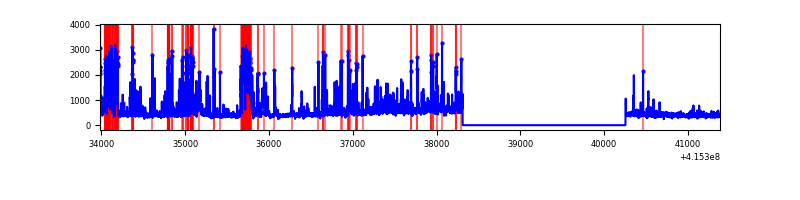 |
Top three noisy pixels from each quadrant. If the there are fewer than three noisy pixels in the level2.evt file, extra rows are filled as -1
| Pixel properties | Quadrant properties | ||||||
|---|---|---|---|---|---|---|---|
| Quadrant | DetID | PixID | Counts | Sigma | Mean | Median | Sigma |
| A | 10 | 83 | 462527 | 3864.84 | 581 | 570 | 119.5 |
| A | 2 | 79 | 50888 | 420.97 | 581 | 570 | 119.5 |
| A | 6 | 10 | 10075 | 79.52 | 581 | 570 | 119.5 |
| B | 5 | 255 | 278002 | 2475.95 | 578 | 562 | 112.1 |
| B | 4 | 171 | 21768 | 189.25 | 578 | 562 | 112.1 |
| B | 0 | 218 | 16541 | 142.6 | 578 | 562 | 112.1 |
| C | 9 | 187 | 6104632 | 52117.31 | 501 | 506 | 117.1 |
| C | 15 | 214 | 206591 | 1759.56 | 501 | 506 | 117.1 |
| C | 14 | 254 | 79440 | 673.94 | 501 | 506 | 117.1 |
| D | 2 | 249 | 836975 | 6065.03 | 558 | 541 | 137.9 |
| D | 13 | 249 | 112355 | 810.77 | 558 | 541 | 137.9 |
| D | 2 | 250 | 88710 | 639.32 | 558 | 541 | 137.9 |
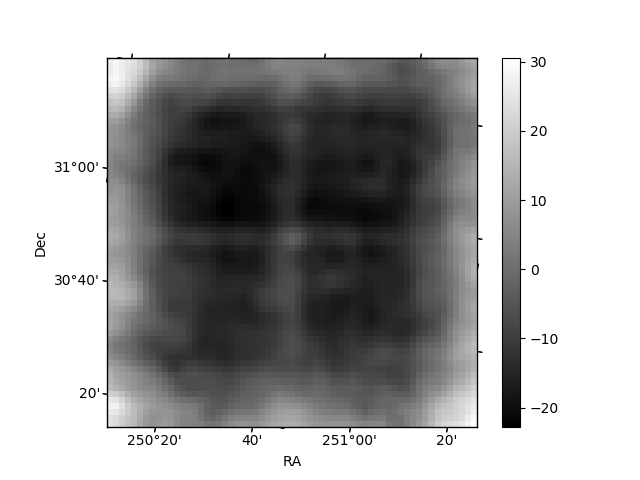
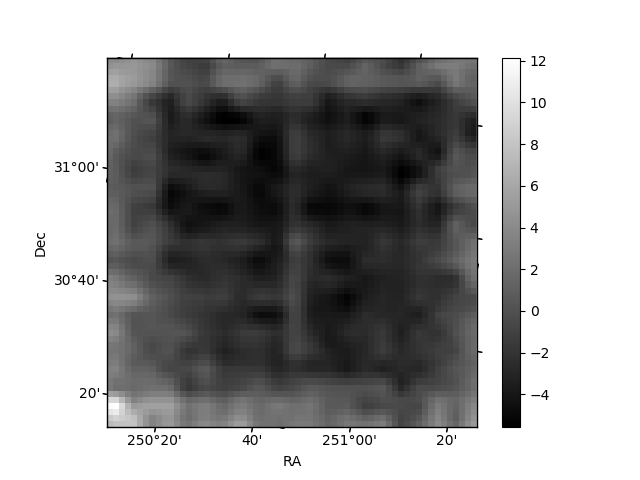
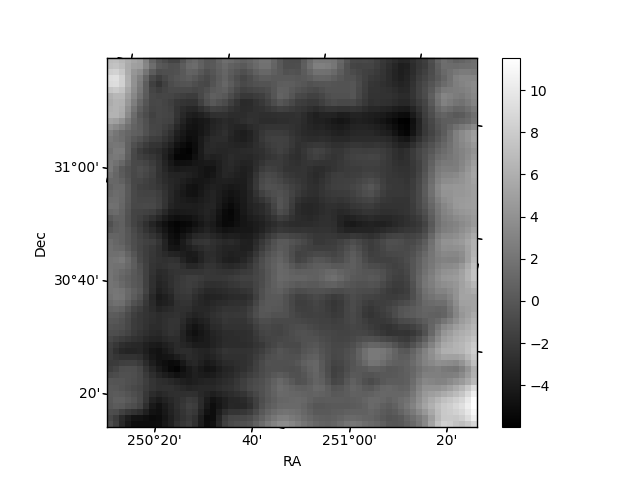
Histogram calculated using DETX and DETY for each event in the final _common_clean file
| Quadrant A | 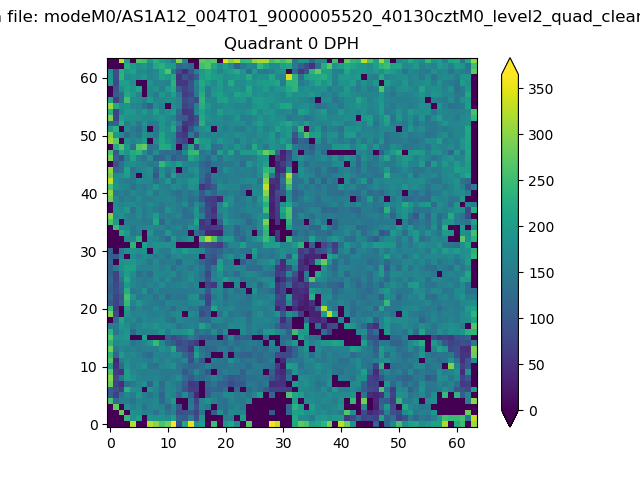 |
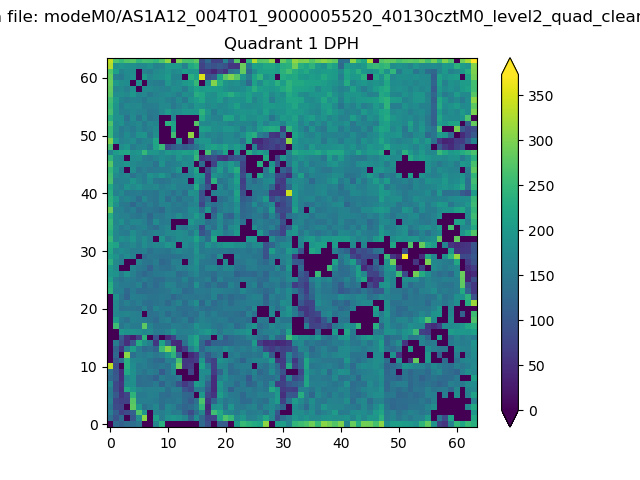 |
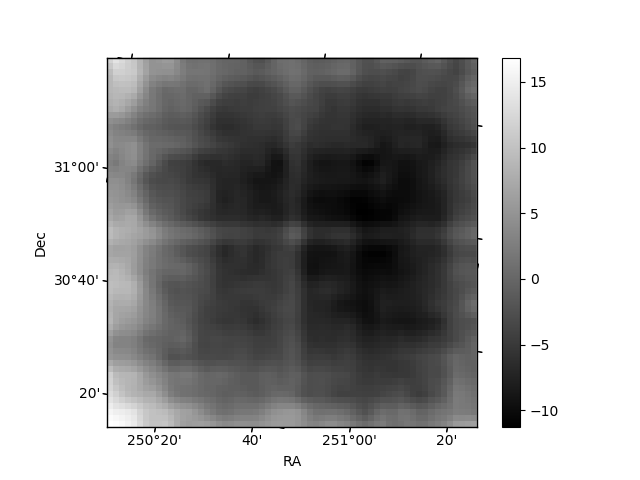
Quadrant B |
|---|---|---|---|
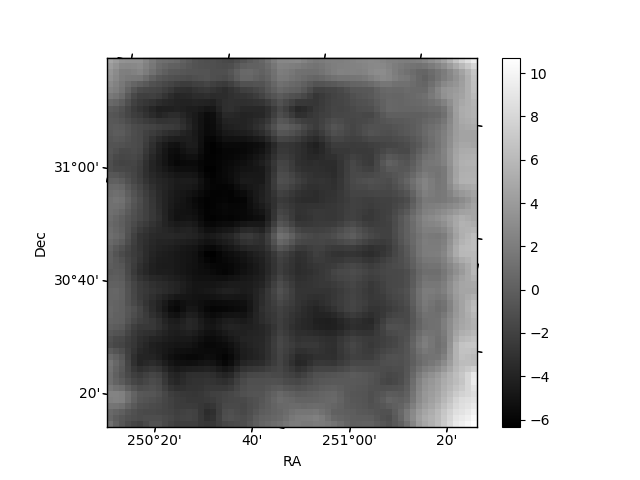
| Quadrant D | 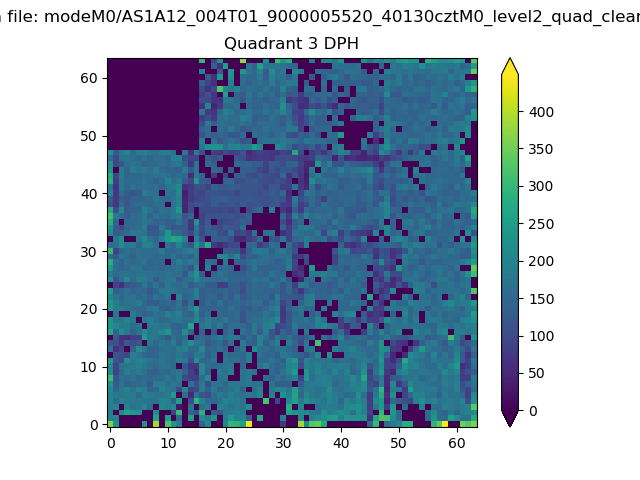 |
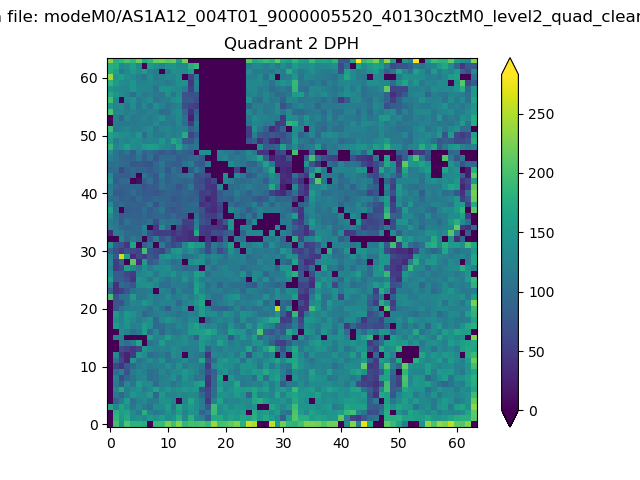 |
Quadrant C |
| Plot type | Count rate plots | Images |
|---|---|---|
| Comparison with Poisson distribution Blue bars denote a histogram of data divided into 1 sec bins. Red curve is a Poisson curve with rate = median count rate of data. |
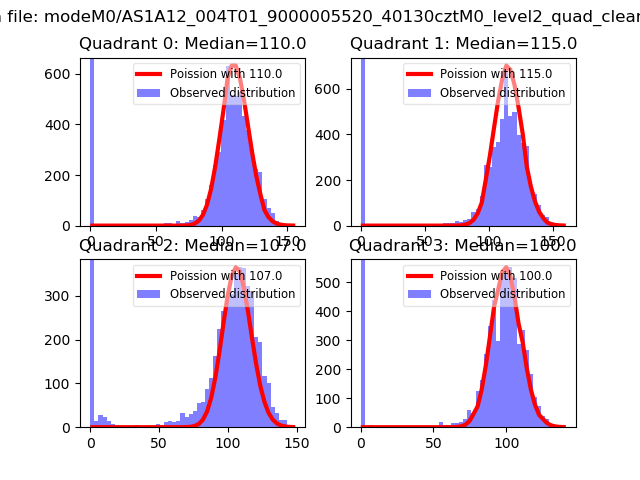 |
 |
| Quadrant-wise count rates Data is divided into 100 sec bins |
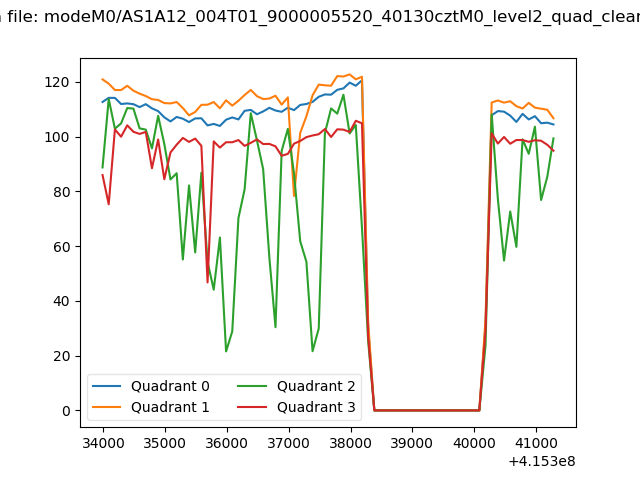 |
|
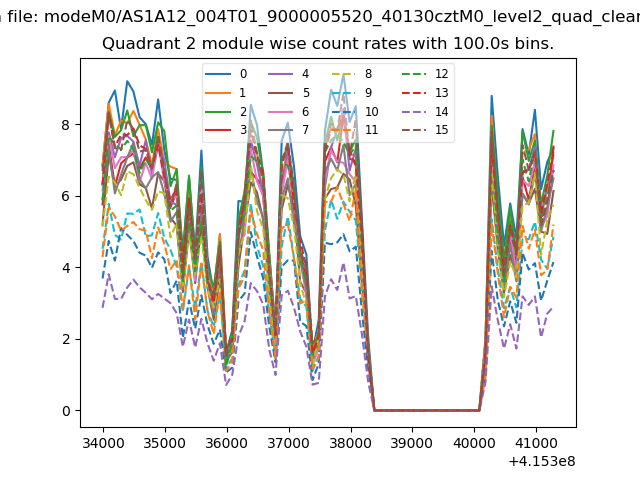
| Module-wise count rates for Quadrant A Data is divided into 100 sec bins |
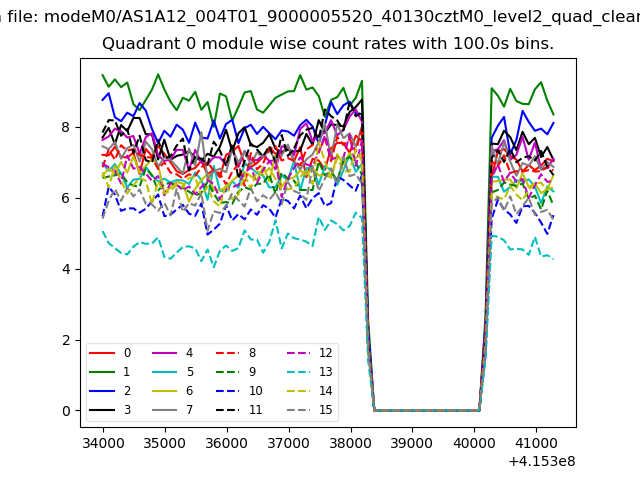 |
 |
| Module-wise count rates for Quadrant B Data is divided into 100 sec bins |
 |
 |
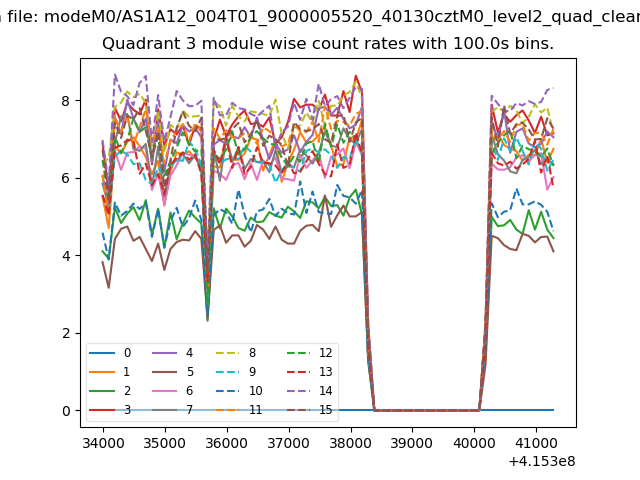
| Module-wise count rates for Quadrant C Data is divided into 100 sec bins |
 |
 |
| Module-wise count rates for Quadrant D Data is divided into 100 sec bins |
 |
 |
| Parameter | Plot |
|---|---|
| CZT HV Monitor |  |
| D_VDD | 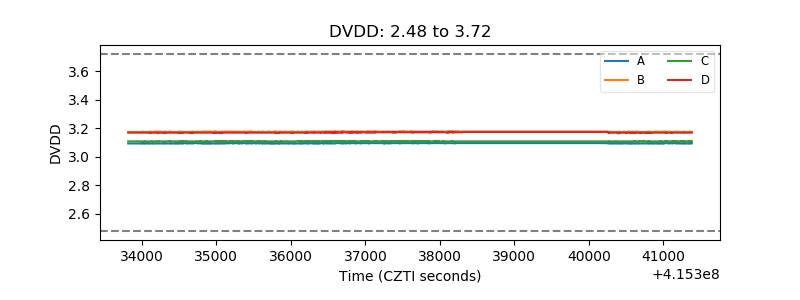 |
| Temperature 1 | 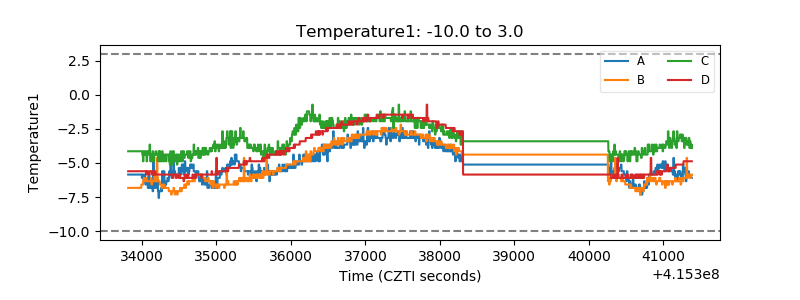 |
| Veto HV Monitor | 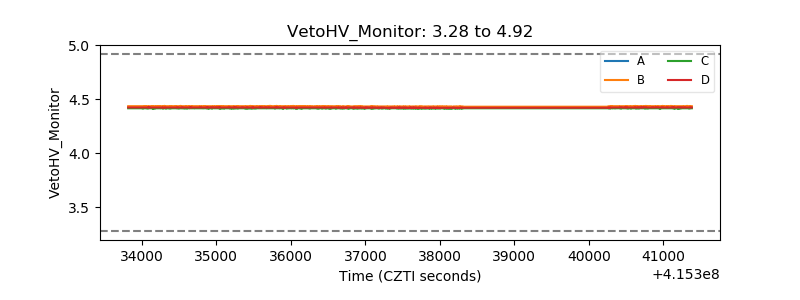 |
| Veto LLD | 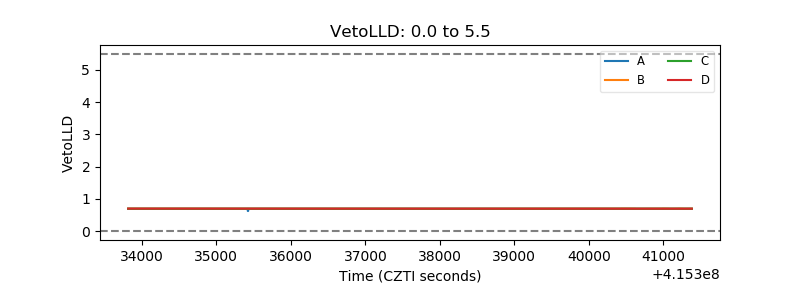 |
| Alpha Counter | 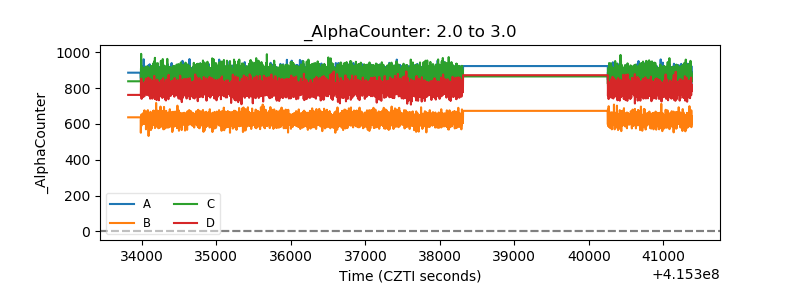 |
| _CPM_Rate | 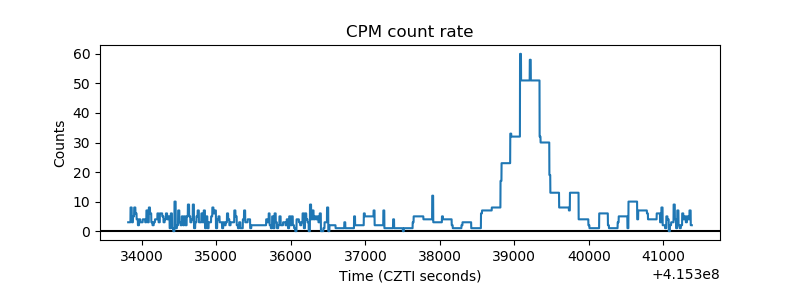 |
| CZT Counter | 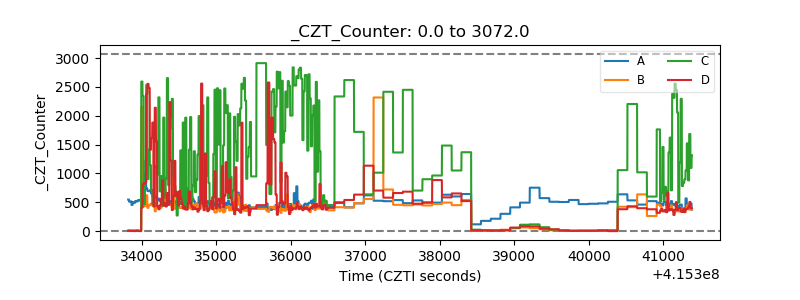 |
| +2.5 Volts monitor | 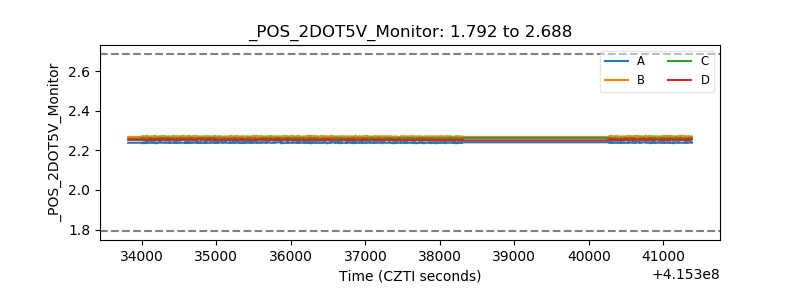 |
| +5 Volts monitor | 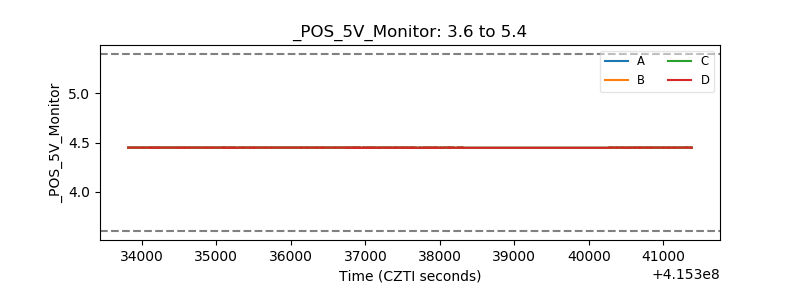 |
| _ROLL_ROT | 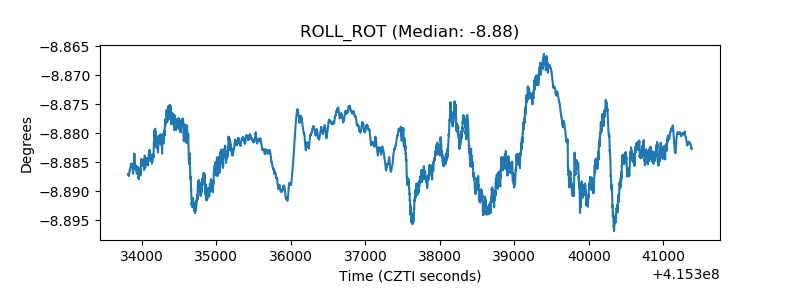 |
| _Roll_DEC | 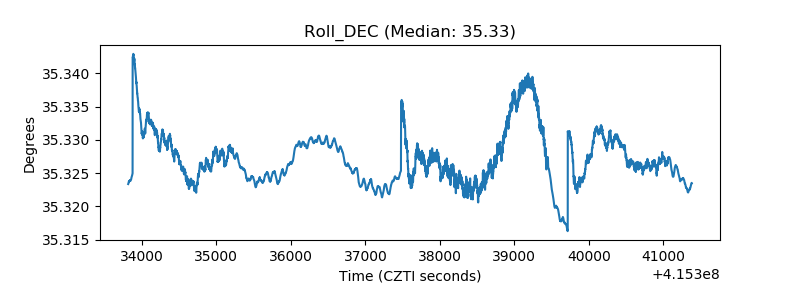 |
| _Roll_RA | 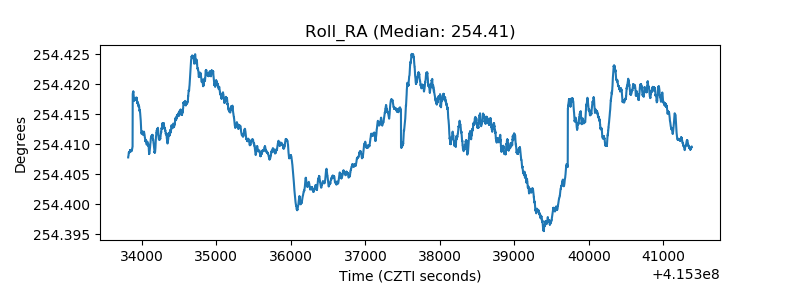 |
| Veto Counter | 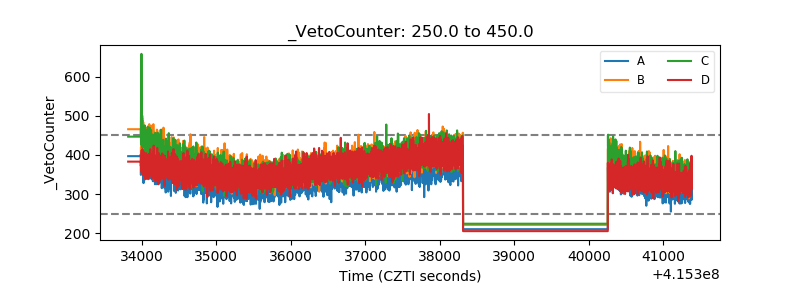 |