| Param | Original file | Final file |
|---|---|---|
| Filename | modeM0/AS1A12_004T01_9000005520_40131cztM0_level2.fits | modeM0/AS1A12_004T01_9000005520_40131cztM0_level2_quad_clean.evt |
| Size (bytes) | 937,077,120 | 149,941,440 |
| Size | 893.7 MB | 143.0 MB |
| Events in quadrant A | 5,201,340 | 1,089,213 |
| Events in quadrant B | 4,640,628 | 1,130,708 |
| Events in quadrant C | 16,985,600 | 672,861 |
| Events in quadrant D | 7,078,460 | 947,959 |
| Mode M0 | |||
|---|---|---|---|
| Quadrant | BADHDUFLAG | Total packets | Discarded packets |
| A | 0 | 21666 | 4 |
| B | 0 | 21177 | 3 |
| C | 0 | 57464 | 3 |
| D | 0 | 28314 | 3 |
| Mode M9 | |||
|---|---|---|---|
| Quadrant | BADHDUFLAG | Total packets | Discarded packets |
| A | 0 | 38 | 0 |
| B | 0 | 38 | 0 |
| C | 0 | 38 | 0 |
| D | 0 | 39 | 0 |
| Mode SS | |||
|---|---|---|---|
| Quadrant | BADHDUFLAG | Total packets | Discarded packets |
| A | 0 | 204 | 0 |
| B | 0 | 204 | 0 |
| C | 0 | 204 | 0 |
| D | 0 | 204 | 0 |
| Quadrant | Total seconds | Saturated seconds | Saturation percentage |
|---|---|---|---|
| A | 10091 | 38 | 0.376573% |
| B | 10091 | 80 | 0.792786% |
| C | 10091 | 4344 | 43.048261% |
| D | 10091 | 579 | 5.737786% |
Noise dominated data is calculated using 1-second bins in cleaned event files. If a bin has >2000 counts, and if more than 50% of those come from <1% of pixels, then it is considered to be noise-dominated and hence unusable.
| Quadrant | # 1 sec bins | Bins with >0 counts | Bins with >2000 counts | High rate bins dominated by noise | Noise dominated (total time) | Noise dominated (detector-on time) | Marked lightcurve |
|---|---|---|---|---|---|---|---|
| A | 13649 | 10093 | 31 | 31 | 0.23% | 0.31% | 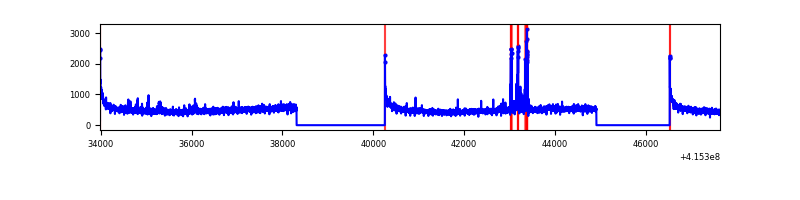 |
| B | 13649 | 10093 | 68 | 68 | 0.50% | 0.67% | 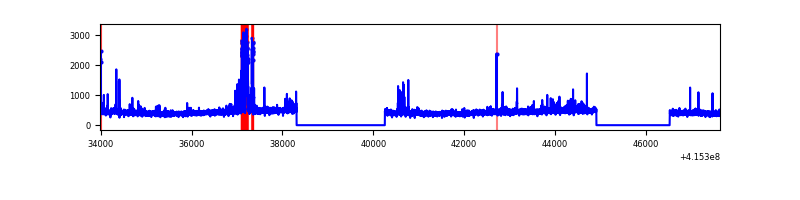 |
| C | 13648 | 10090 | 4449 | 4449 | 32.60% | 44.09% | 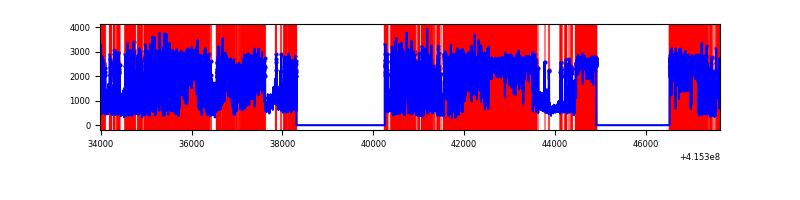 |
| D | 13649 | 10093 | 577 | 577 | 4.23% | 5.72% | 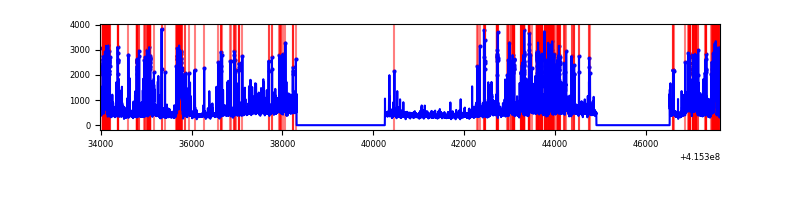 |
Top three noisy pixels from each quadrant. If the there are fewer than three noisy pixels in the level2.evt file, extra rows are filled as -1
| Pixel properties | Quadrant properties | ||||||
|---|---|---|---|---|---|---|---|
| Quadrant | DetID | PixID | Counts | Sigma | Mean | Median | Sigma |
| A | 10 | 83 | 790784 | 3576.63 | 1084 | 1065 | 220.8 |
| A | 15 | 223 | 138159 | 620.9 | 1084 | 1065 | 220.8 |
| A | 2 | 79 | 55358 | 245.89 | 1084 | 1065 | 220.8 |
| B | 5 | 255 | 300855 | 1449.03 | 1078 | 1048 | 206.9 |
| B | 0 | 218 | 45150 | 213.15 | 1078 | 1048 | 206.9 |
| B | 4 | 171 | 29954 | 139.71 | 1078 | 1048 | 206.9 |
| C | 9 | 187 | 13197452 | 67704.66 | 841 | 847 | 194.9 |
| C | 15 | 214 | 341352 | 1746.95 | 841 | 847 | 194.9 |
| C | 14 | 254 | 129954 | 662.38 | 841 | 847 | 194.9 |
| D | 2 | 249 | 868381 | 3462.64 | 1031 | 1002 | 250.5 |
| D | 12 | 227 | 782931 | 3121.52 | 1031 | 1002 | 250.5 |
| D | 1 | 47 | 610093 | 2431.54 | 1031 | 1002 | 250.5 |
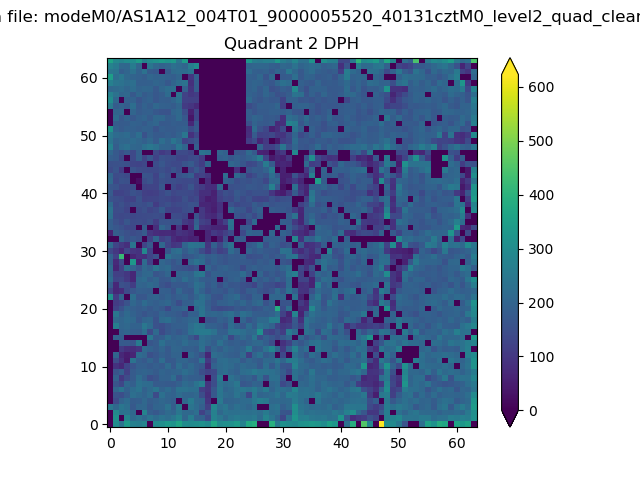
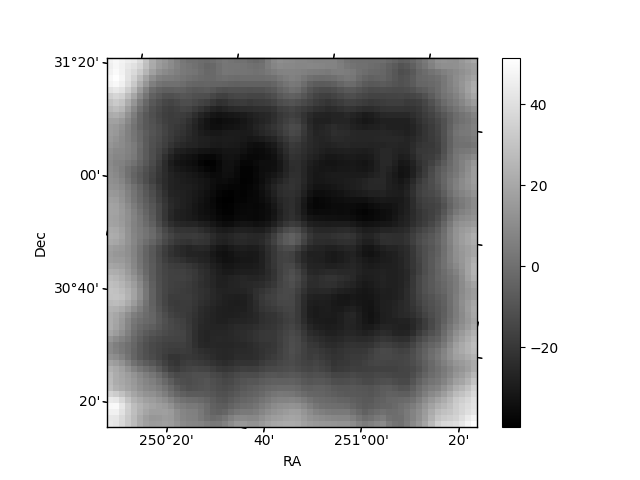
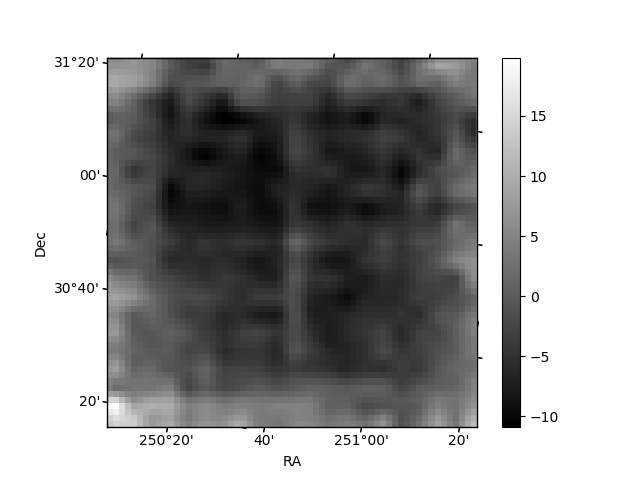
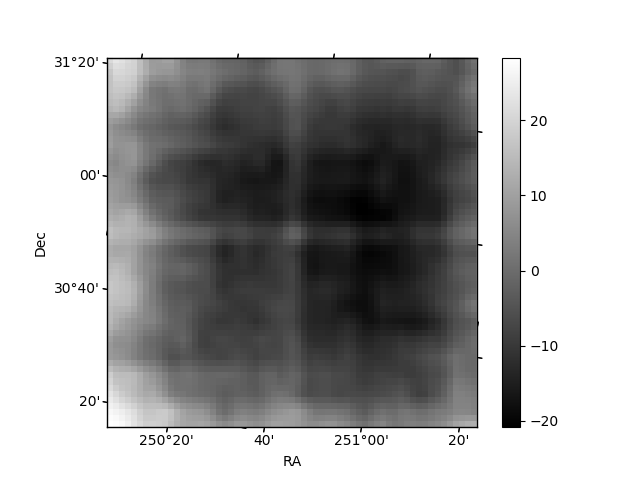
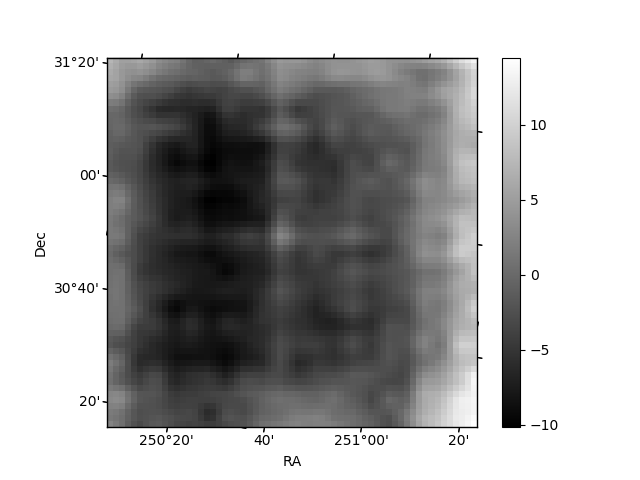
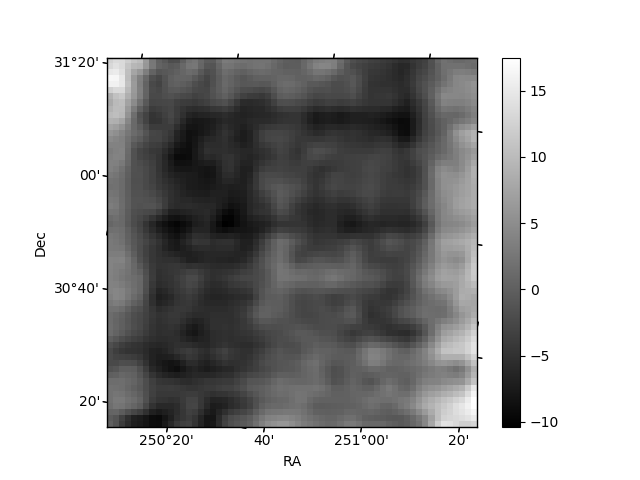
Histogram calculated using DETX and DETY for each event in the final _common_clean file
| Quadrant A | 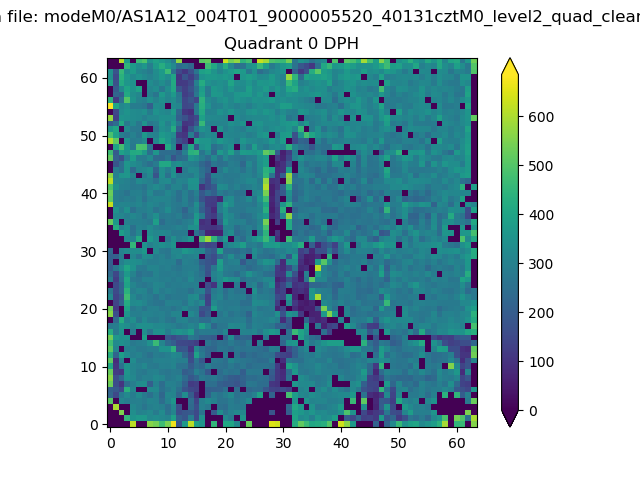 |
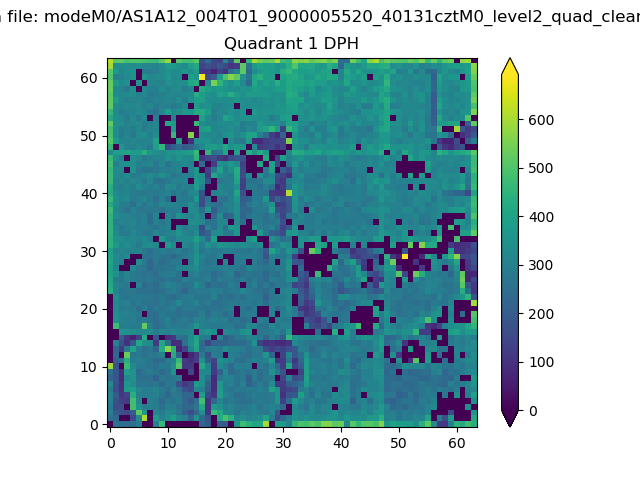 |
Quadrant B |
|---|---|---|---|
| Quadrant D | 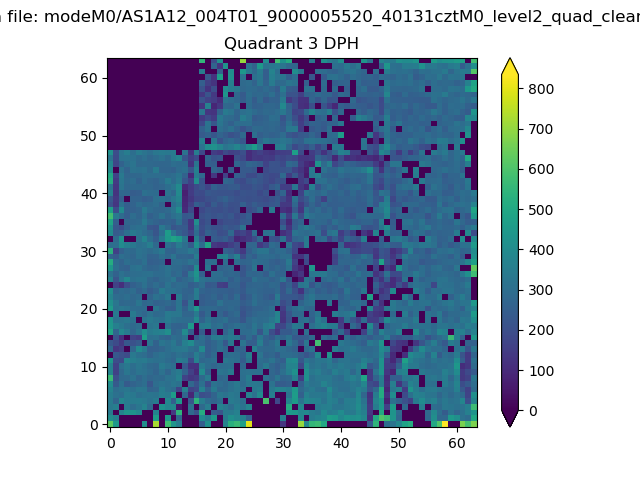 |
 |
Quadrant C |
| Plot type | Count rate plots | Images |
|---|---|---|
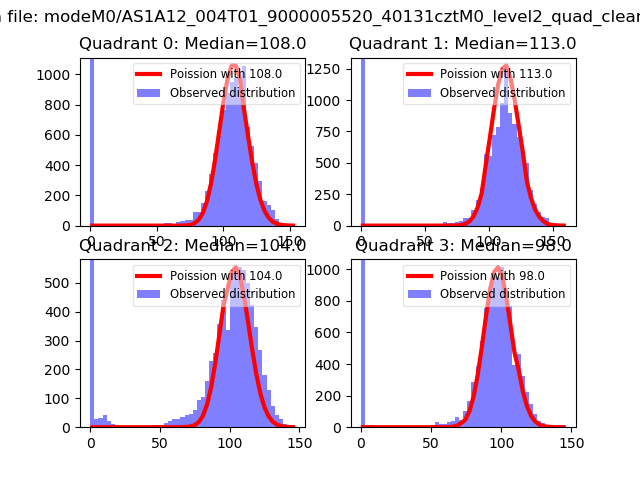
| Comparison with Poisson distribution Blue bars denote a histogram of data divided into 1 sec bins. Red curve is a Poisson curve with rate = median count rate of data. |
 |
 |
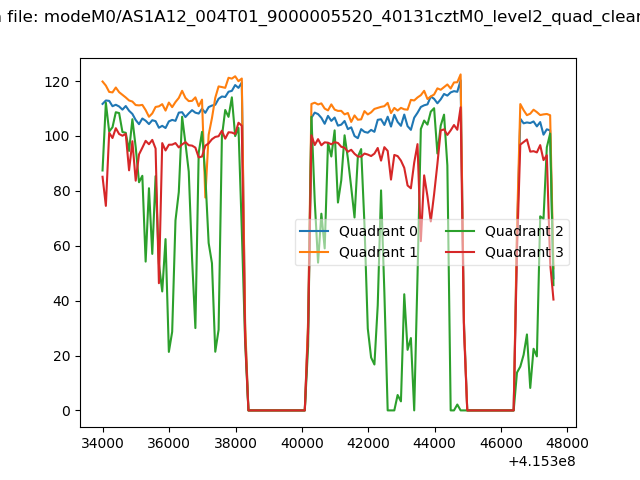
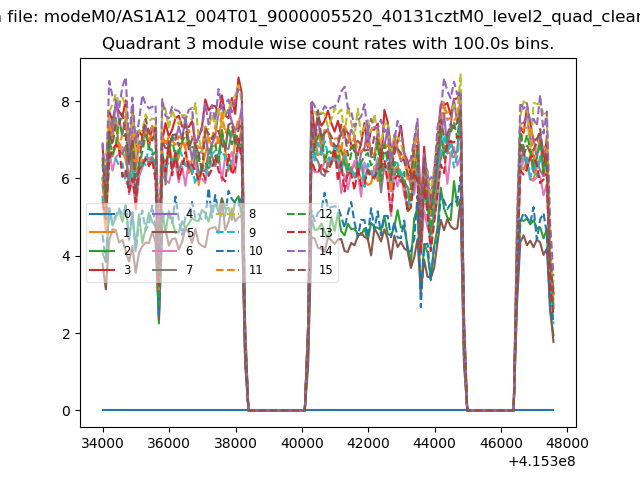
| Quadrant-wise count rates Data is divided into 100 sec bins |
 |
|
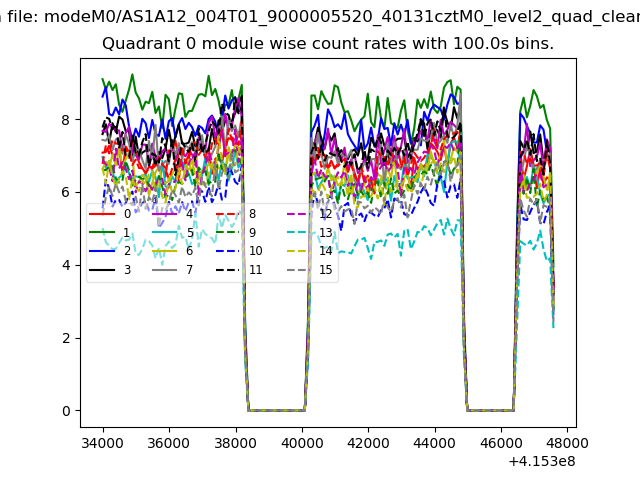
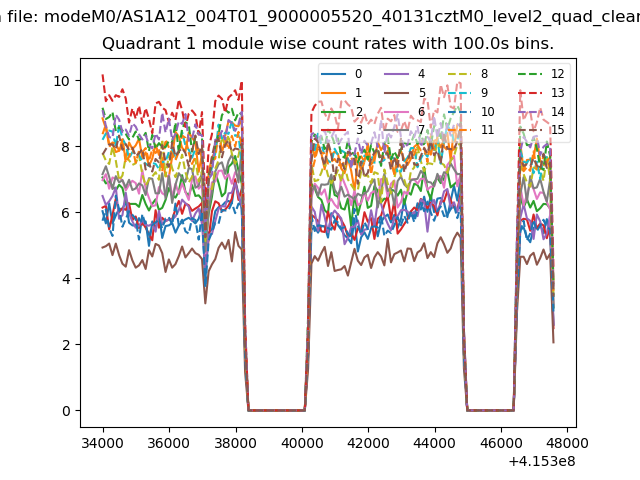
| Module-wise count rates for Quadrant A Data is divided into 100 sec bins |
 |
 |
| Module-wise count rates for Quadrant B Data is divided into 100 sec bins |
 |
 |
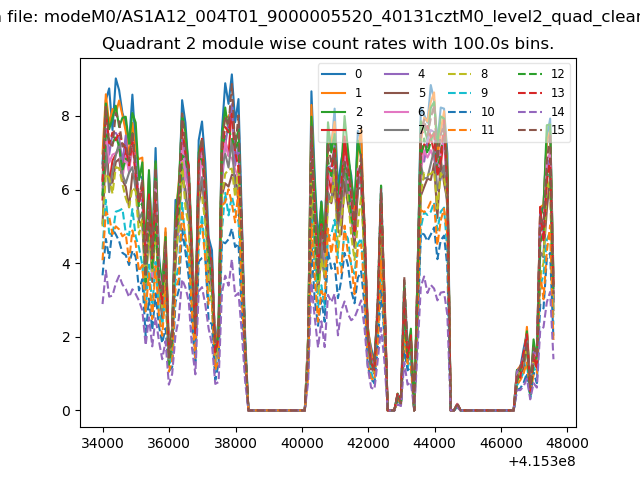
| Module-wise count rates for Quadrant C Data is divided into 100 sec bins |
 |
 |
| Module-wise count rates for Quadrant D Data is divided into 100 sec bins |
 |
 |
| Parameter | Plot |
|---|---|
| CZT HV Monitor | 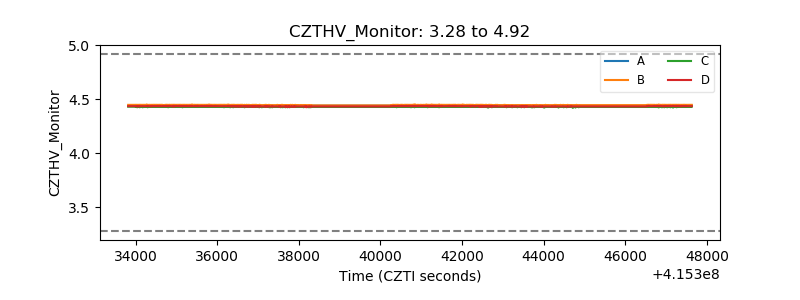 |
| D_VDD | 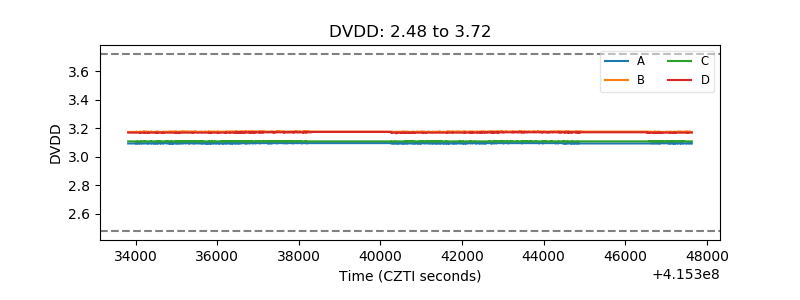 |
| Temperature 1 | 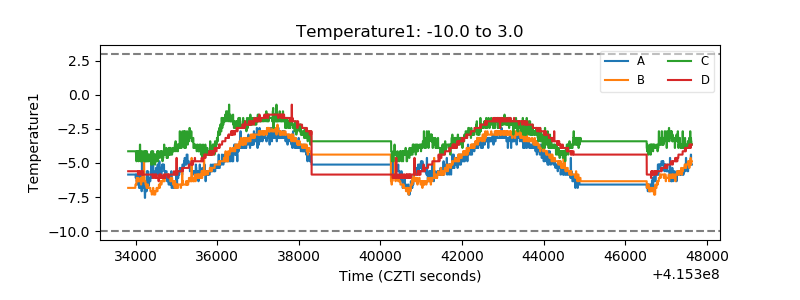 |
| Veto HV Monitor | 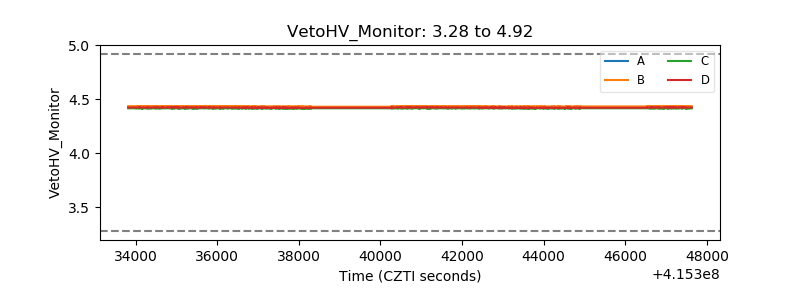 |
| Veto LLD | 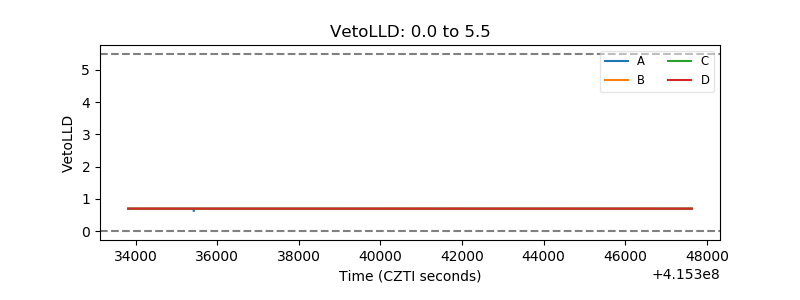 |
| Alpha Counter | 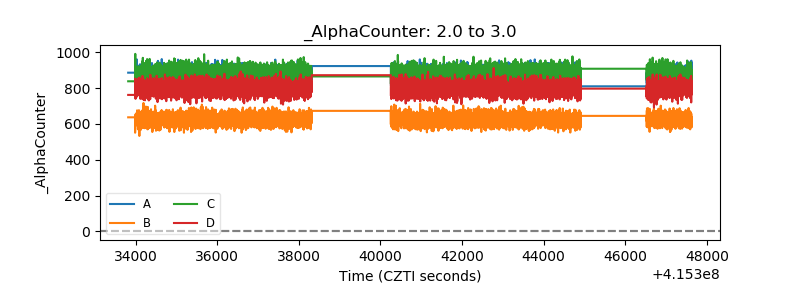 |
| _CPM_Rate | 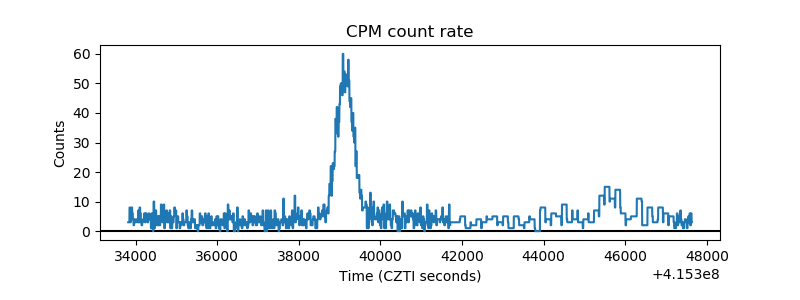 |
| CZT Counter | 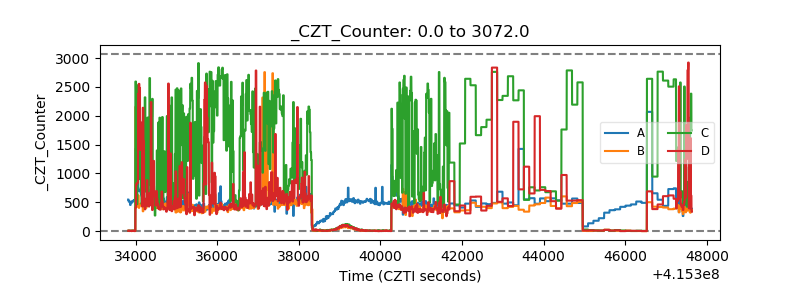 |
| +2.5 Volts monitor |  |
| +5 Volts monitor |  |
| _ROLL_ROT | 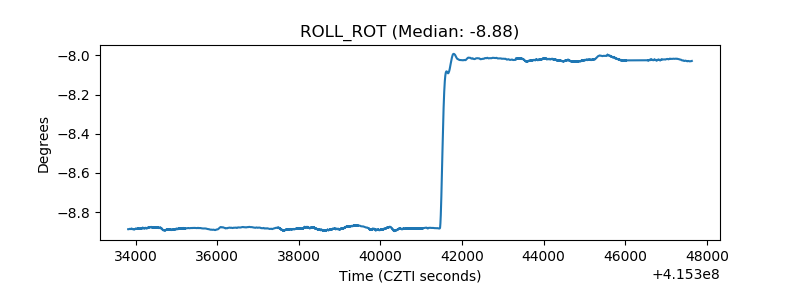 |
| _Roll_DEC | 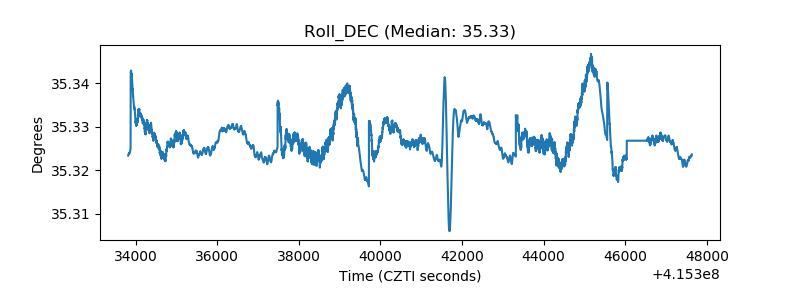 |
| _Roll_RA | 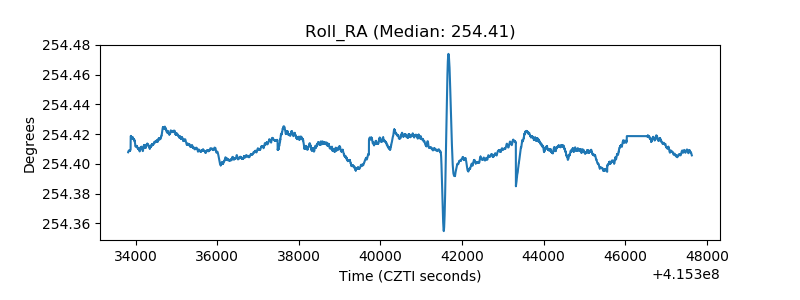 |
| Veto Counter | 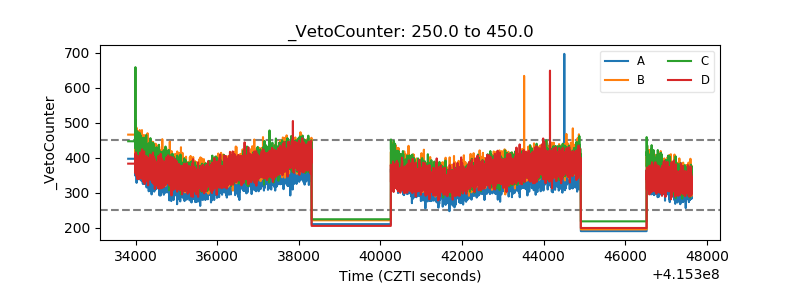 |