| Param | Original file | Final file |
|---|---|---|
| Filename | modeM0/AS1A12_004T01_9000005520_40132cztM0_level2.fits | modeM0/AS1A12_004T01_9000005520_40132cztM0_level2_quad_clean.evt |
| Size (bytes) | 547,591,680 | 86,886,720 |
| Size | 522.2 MB | 82.9 MB |
| Events in quadrant A | 2,939,732 | 635,054 |
| Events in quadrant B | 2,572,042 | 658,243 |
| Events in quadrant C | 8,621,243 | 435,637 |
| Events in quadrant D | 5,679,346 | 489,644 |
| Mode M0 | |||
|---|---|---|---|
| Quadrant | BADHDUFLAG | Total packets | Discarded packets |
| A | 0 | 12257 | 3 |
| B | 0 | 11921 | 2 |
| C | 0 | 29652 | 2 |
| D | 0 | 20871 | 2 |
| Mode M9 | |||
|---|---|---|---|
| Quadrant | BADHDUFLAG | Total packets | Discarded packets |
| A | 0 | 13 | 0 |
| B | 0 | 13 | 0 |
| C | 0 | 13 | 0 |
| D | 0 | 13 | 0 |
| Mode SS | |||
|---|---|---|---|
| Quadrant | BADHDUFLAG | Total packets | Discarded packets |
| A | 0 | 122 | 0 |
| B | 0 | 122 | 0 |
| C | 0 | 122 | 0 |
| D | 0 | 122 | 0 |
| Quadrant | Total seconds | Saturated seconds | Saturation percentage |
|---|---|---|---|
| A | 5890 | 11 | 0.186757% |
| B | 5890 | 9 | 0.152801% |
| C | 5890 | 2073 | 35.195246% |
| D | 5890 | 1000 | 16.977929% |
Noise dominated data is calculated using 1-second bins in cleaned event files. If a bin has >2000 counts, and if more than 50% of those come from <1% of pixels, then it is considered to be noise-dominated and hence unusable.
| Quadrant | # 1 sec bins | Bins with >0 counts | Bins with >2000 counts | High rate bins dominated by noise | Noise dominated (total time) | Noise dominated (detector-on time) | Marked lightcurve |
|---|---|---|---|---|---|---|---|
| A | 7233 | 5891 | 4 | 4 | 0.06% | 0.07% | 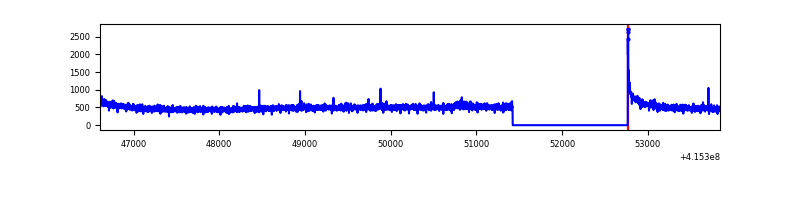 |
| B | 7233 | 5891 | 2 | 2 | 0.03% | 0.03% | 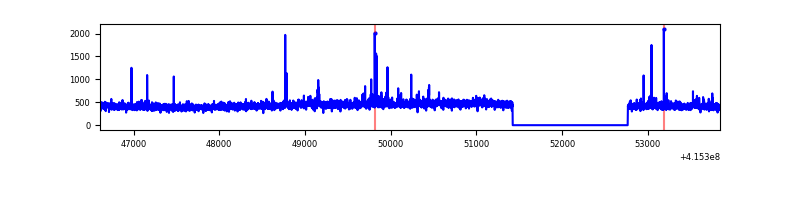 |
| C | 7232 | 5890 | 2009 | 2009 | 27.78% | 34.11% | 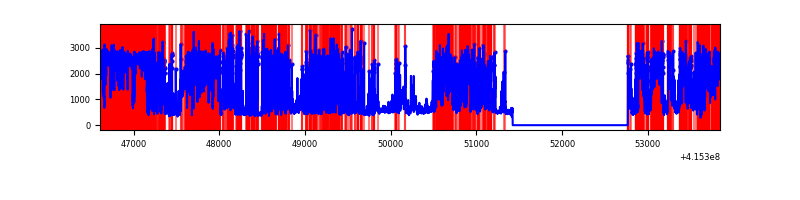 |
| D | 7232 | 5890 | 1043 | 1043 | 14.42% | 17.71% | 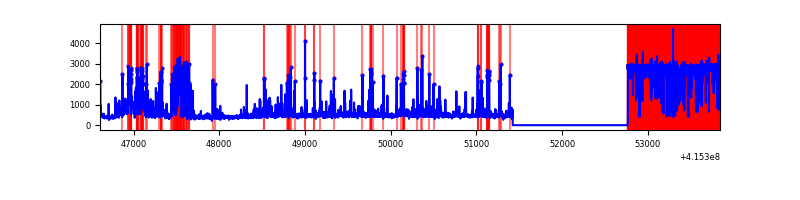 |
Top three noisy pixels from each quadrant. If the there are fewer than three noisy pixels in the level2.evt file, extra rows are filled as -1
| Pixel properties | Quadrant properties | ||||||
|---|---|---|---|---|---|---|---|
| Quadrant | DetID | PixID | Counts | Sigma | Mean | Median | Sigma |
| A | 10 | 83 | 447428 | 3414.72 | 637 | 625 | 130.8 |
| A | 6 | 10 | 20497 | 151.87 | 637 | 625 | 130.8 |
| A | 7 | 3 | 7848 | 55.2 | 637 | 625 | 130.8 |
| B | 5 | 255 | 37163 | 292.81 | 634 | 616 | 124.8 |
| B | 12 | 111 | 15654 | 120.48 | 634 | 616 | 124.8 |
| B | 11 | 111 | 14435 | 110.72 | 634 | 616 | 124.8 |
| C | 9 | 187 | 6291273 | 52002.61 | 518 | 522 | 121.0 |
| C | 15 | 214 | 204609 | 1687.09 | 518 | 522 | 121.0 |
| C | 14 | 254 | 46359 | 378.91 | 518 | 522 | 121.0 |
| D | 12 | 227 | 2578037 | 18405.33 | 564 | 548 | 140.0 |
| D | 1 | 47 | 568847 | 4058.11 | 564 | 548 | 140.0 |
| D | 9 | 19 | 112445 | 799.03 | 564 | 548 | 140.0 |
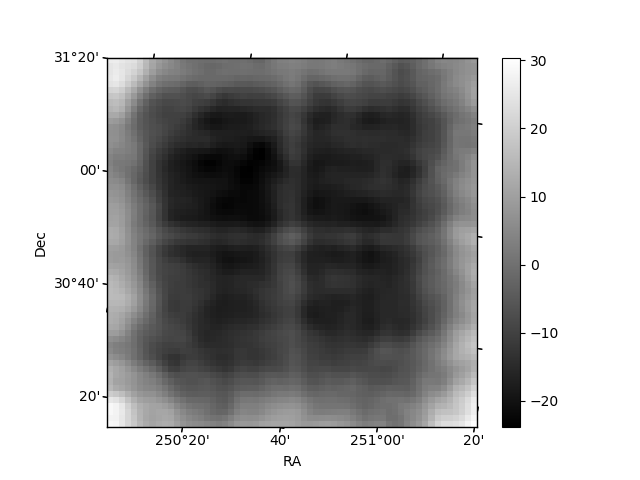
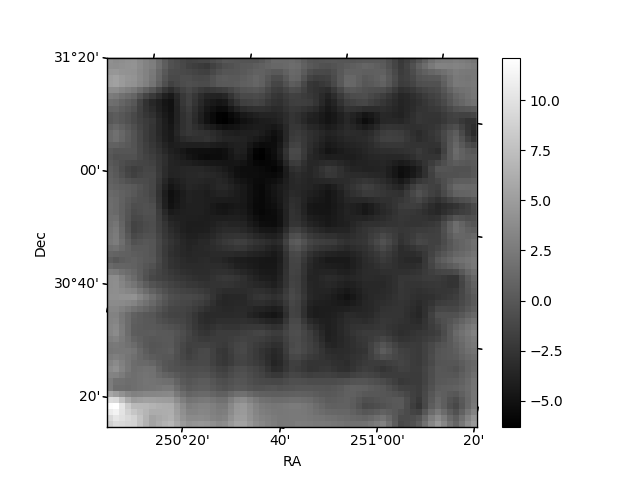
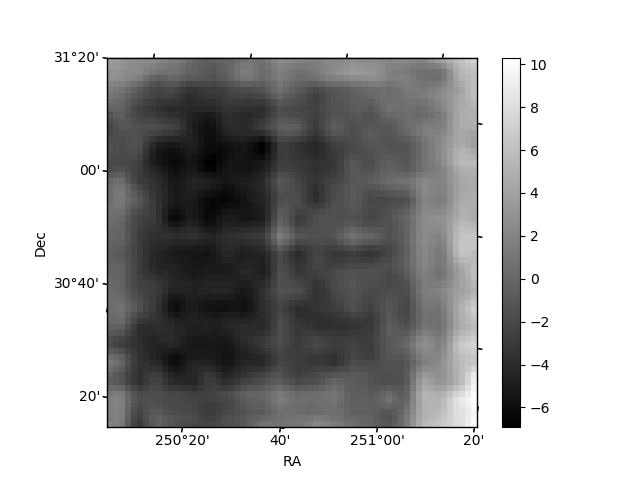
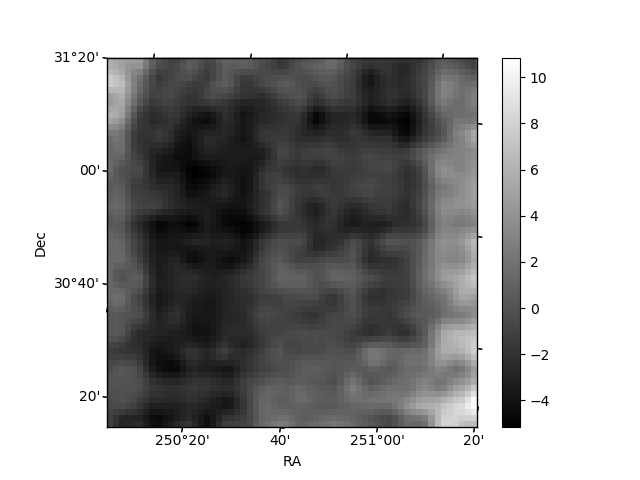
Histogram calculated using DETX and DETY for each event in the final _common_clean file
| Quadrant A | 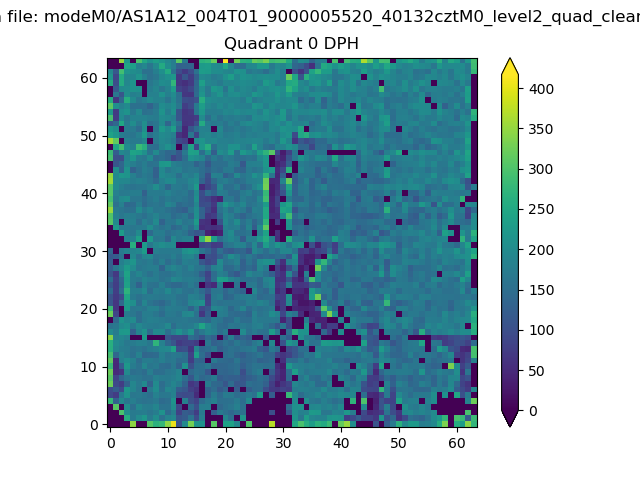 |
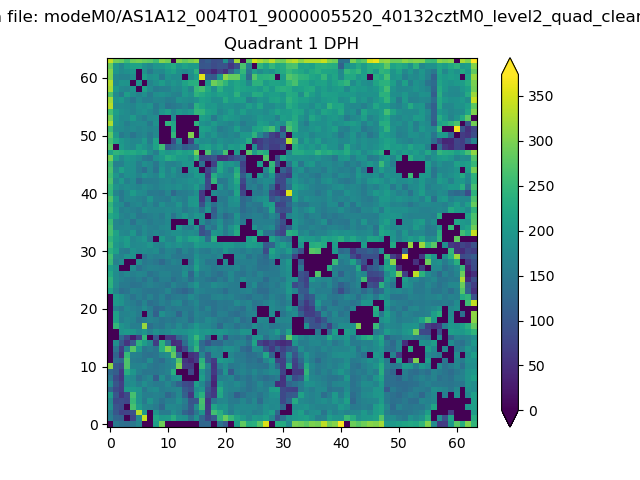 |
Quadrant B |
|---|---|---|---|
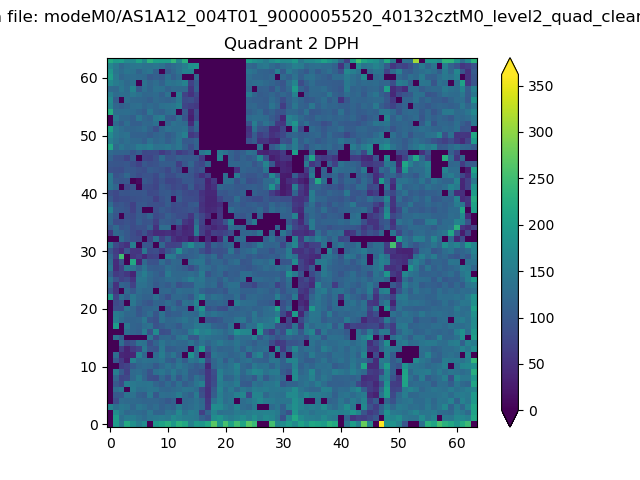
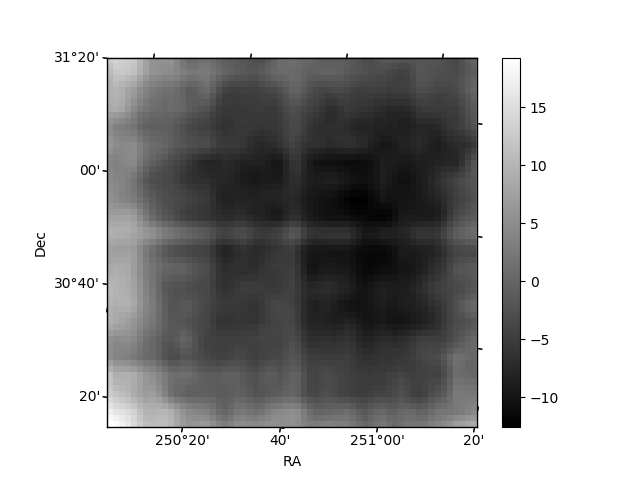
| Quadrant D | 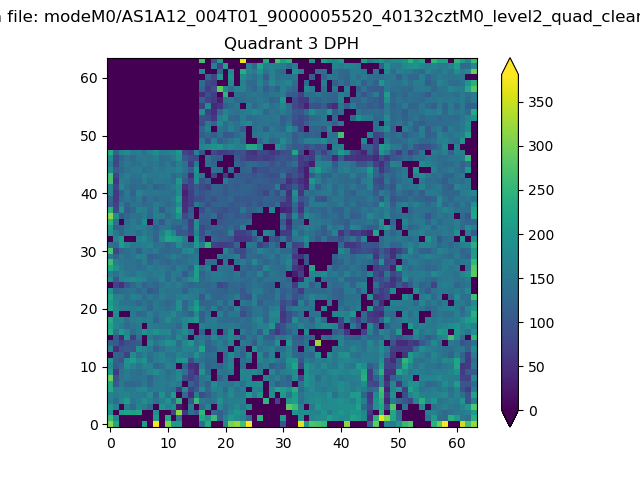 |
 |
Quadrant C |
| Plot type | Count rate plots | Images |
|---|---|---|
| Comparison with Poisson distribution Blue bars denote a histogram of data divided into 1 sec bins. Red curve is a Poisson curve with rate = median count rate of data. |
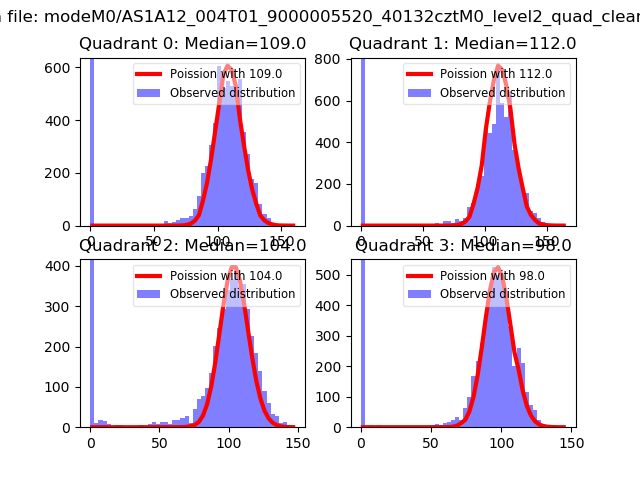 |
 |
| Quadrant-wise count rates Data is divided into 100 sec bins |
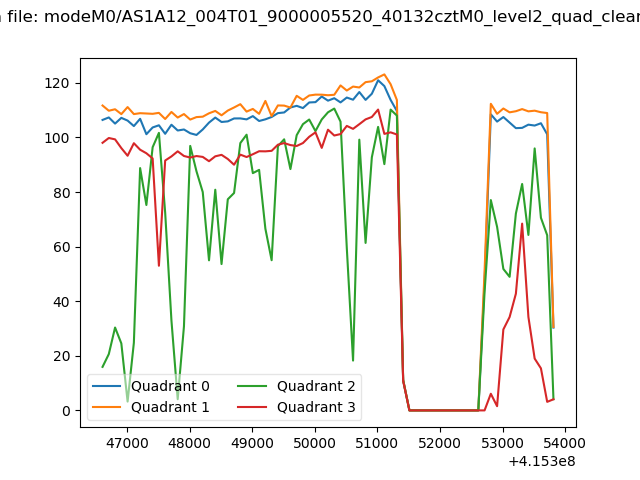 |
|
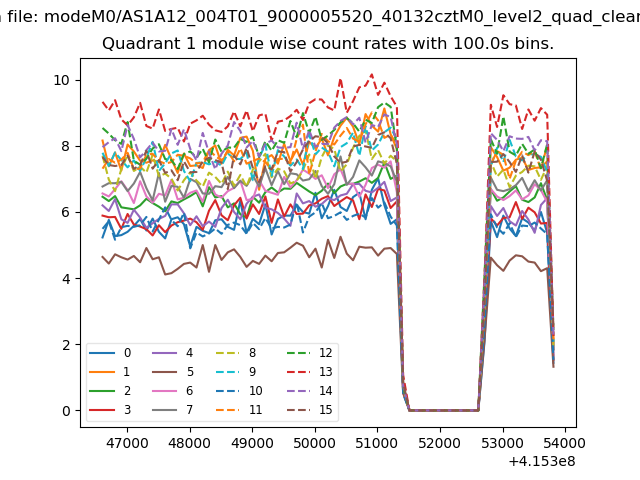
| Module-wise count rates for Quadrant A Data is divided into 100 sec bins |
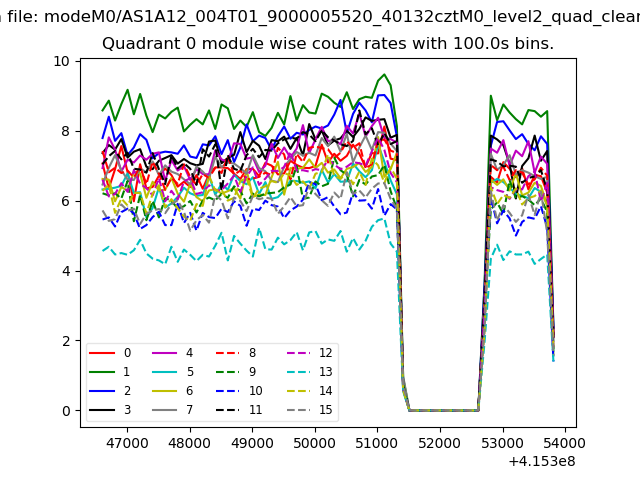 |
 |
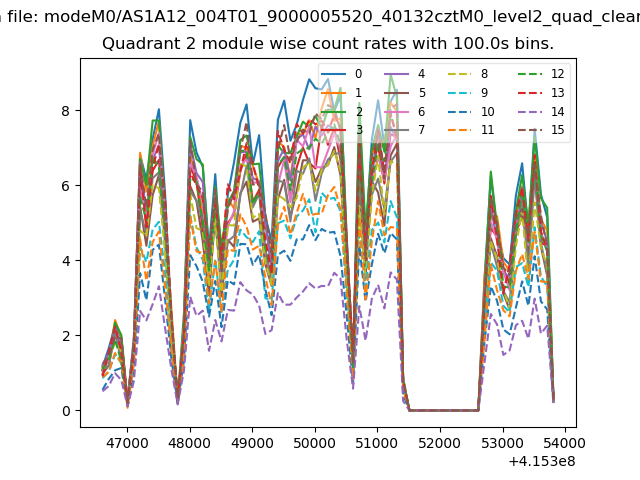
| Module-wise count rates for Quadrant B Data is divided into 100 sec bins |
 |
 |
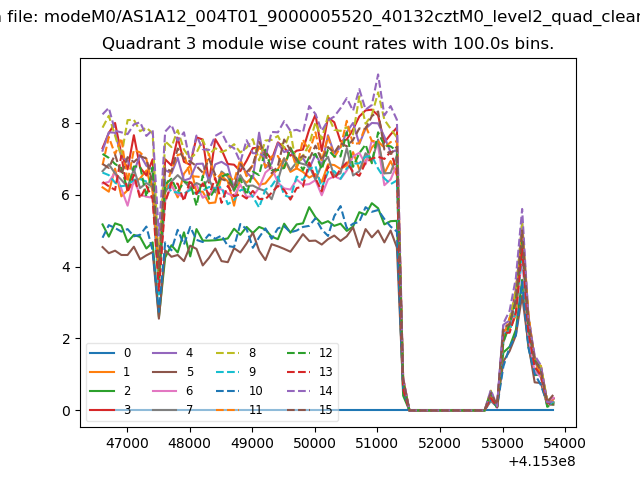
| Module-wise count rates for Quadrant C Data is divided into 100 sec bins |
 |
 |
| Module-wise count rates for Quadrant D Data is divided into 100 sec bins |
 |
 |
| Parameter | Plot |
|---|---|
| CZT HV Monitor | 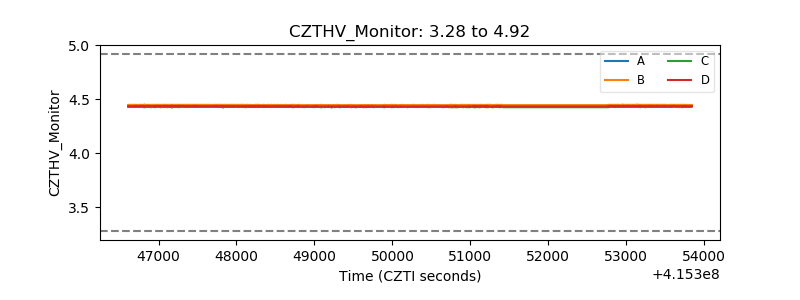 |
| D_VDD | 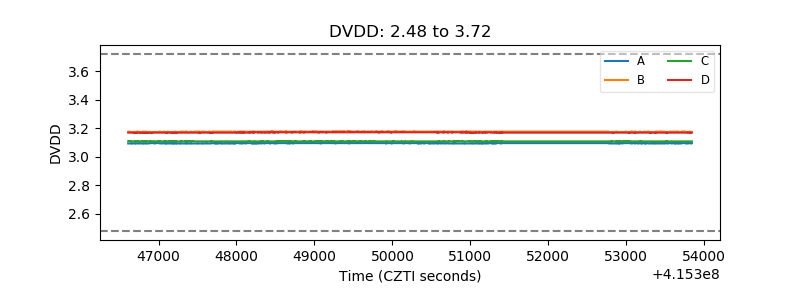 |
| Temperature 1 | 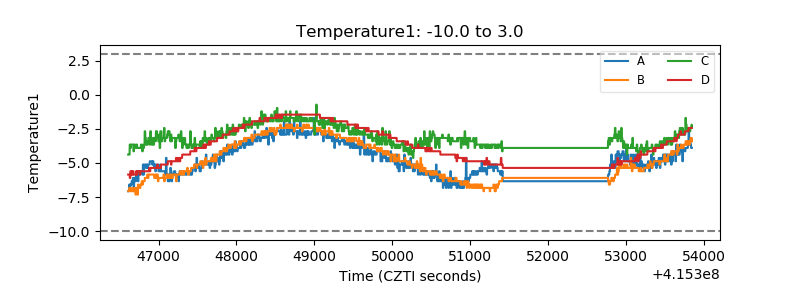 |
| Veto HV Monitor | 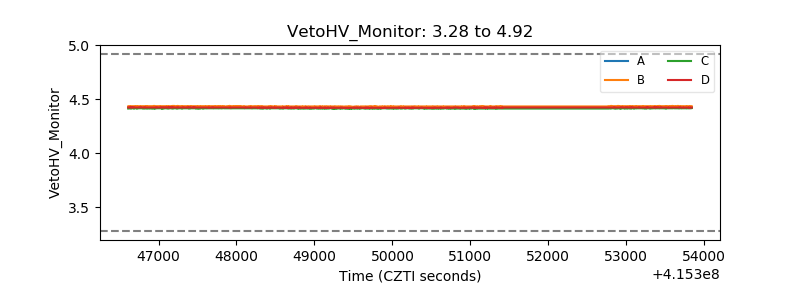 |
| Veto LLD | 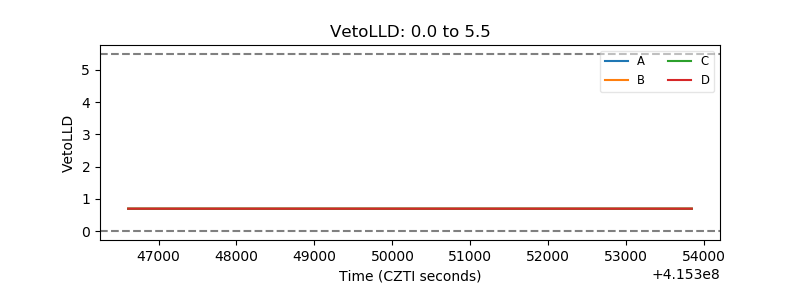 |
| Alpha Counter | 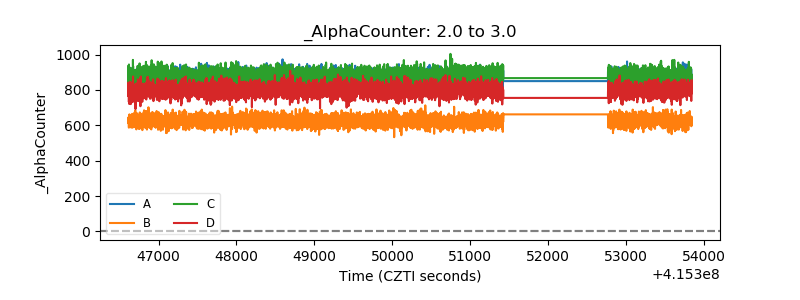 |
| _CPM_Rate | 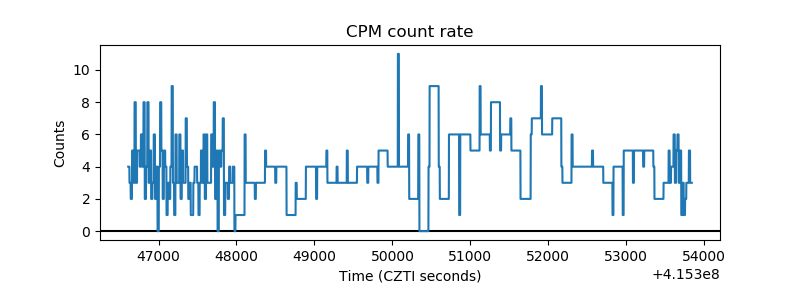 |
| CZT Counter | 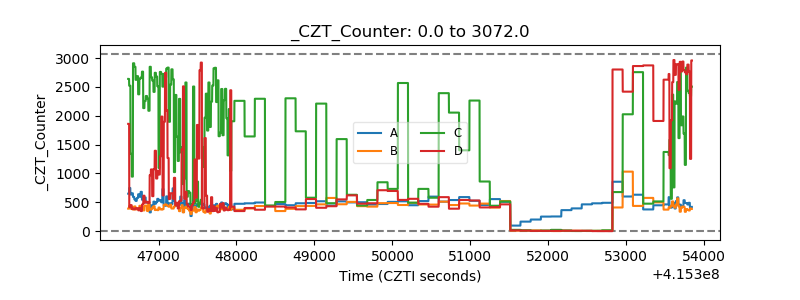 |
| +2.5 Volts monitor | 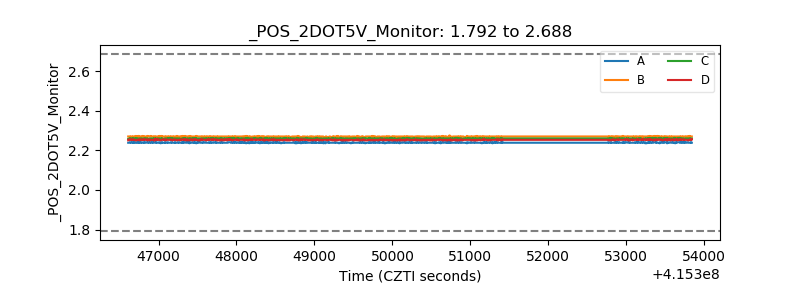 |
| +5 Volts monitor |  |
| _ROLL_ROT | 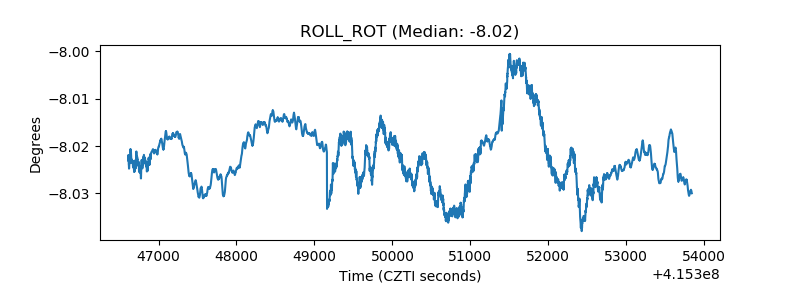 |
| _Roll_DEC | 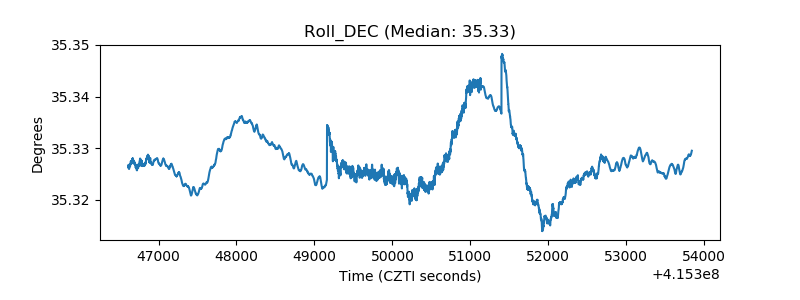 |
| _Roll_RA | 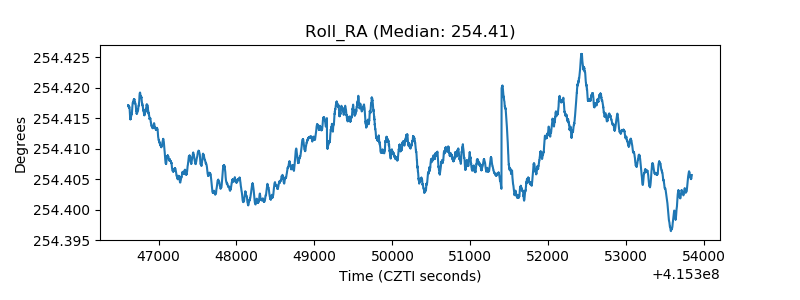 |
| Veto Counter | 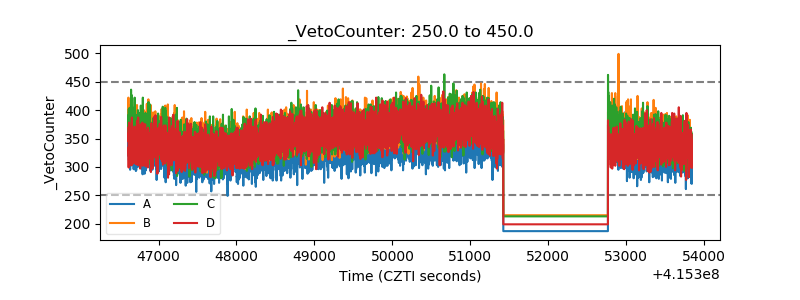 |